
Last week’s analysis expected downwards movement. This is not what happened.
Summary: The structure for downwards movement is still incomplete. A short term target for the next wave down is 38.07.
New updates to this analysis are in bold
MONTHLY ELLIOTT WAVE COUNT
Click chart to enlarge.
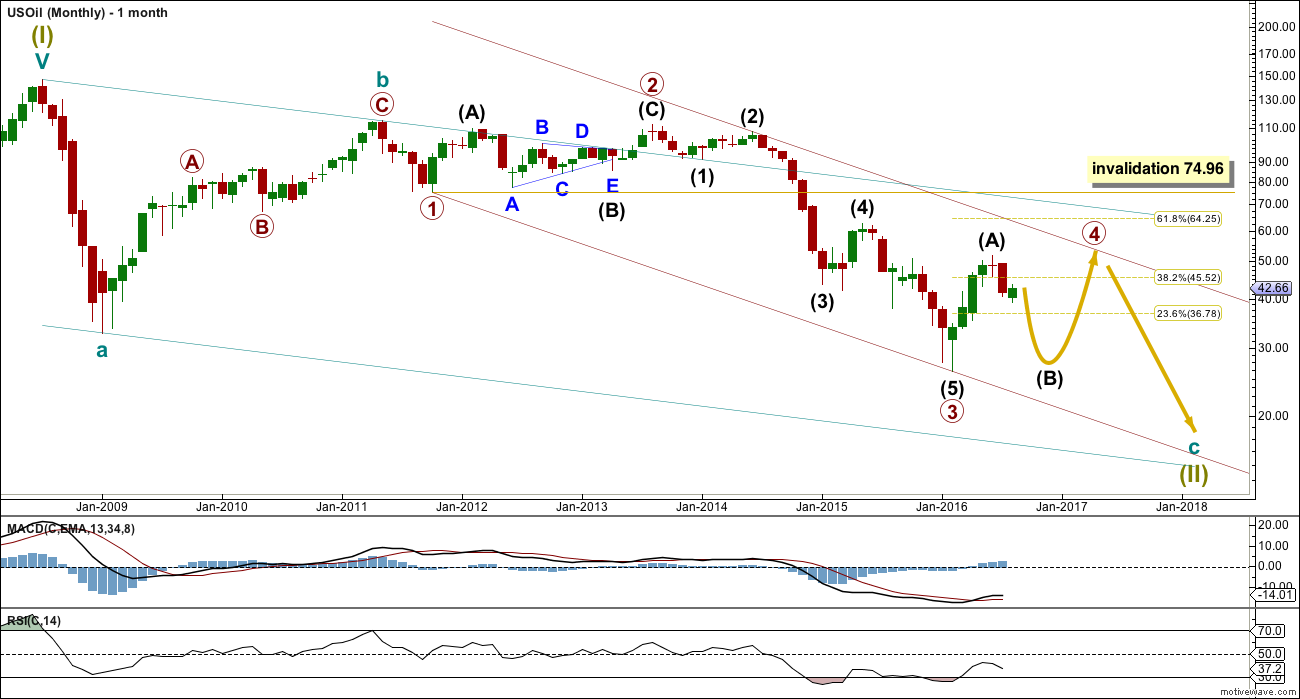
Within the bear market, cycle wave b is seen as ending in May 2011. Thereafter, a five wave structure downwards for cycle wave c begins.
Primary wave 1 is a short impulse lasting five months. Primary wave 2 is a very deep 0.94 zigzag lasting 22 months. Primary wave 3 is a complete impulse with no Fibonacci ratio to primary wave 1. It lasted 30 months.
Primary wave 4 is likely to exhibit alternation with primary wave 2. Primary wave 4 is most likely to be a flat, combination or triangle. Within all of these types of structures, the first movement subdivides as a three.
Primary wave 4 is likely to end within the price territory of the fourth wave of one lesser degree; intermediate wave (4) has its range from 42.03 to 62.58.
Primary wave 4 may end if price comes up to touch the upper edge of the maroon channel. The upper edge of this channel has been pushed up to sit on the end of intermediate wave (2) within primary wave 3.
Primary wave 4 is most likely to be shallow to exhibit alternation in depth with primary wave 2. So far it has passed the 0.382 Fibonacci ratio at 45.52. It may now move mostly sideways in a large range.
Primary wave 4 may not move into primary wave 1 price territory above 74.96.
DAILY ELLIOTT WAVE COUNT
Click chart to enlarge.
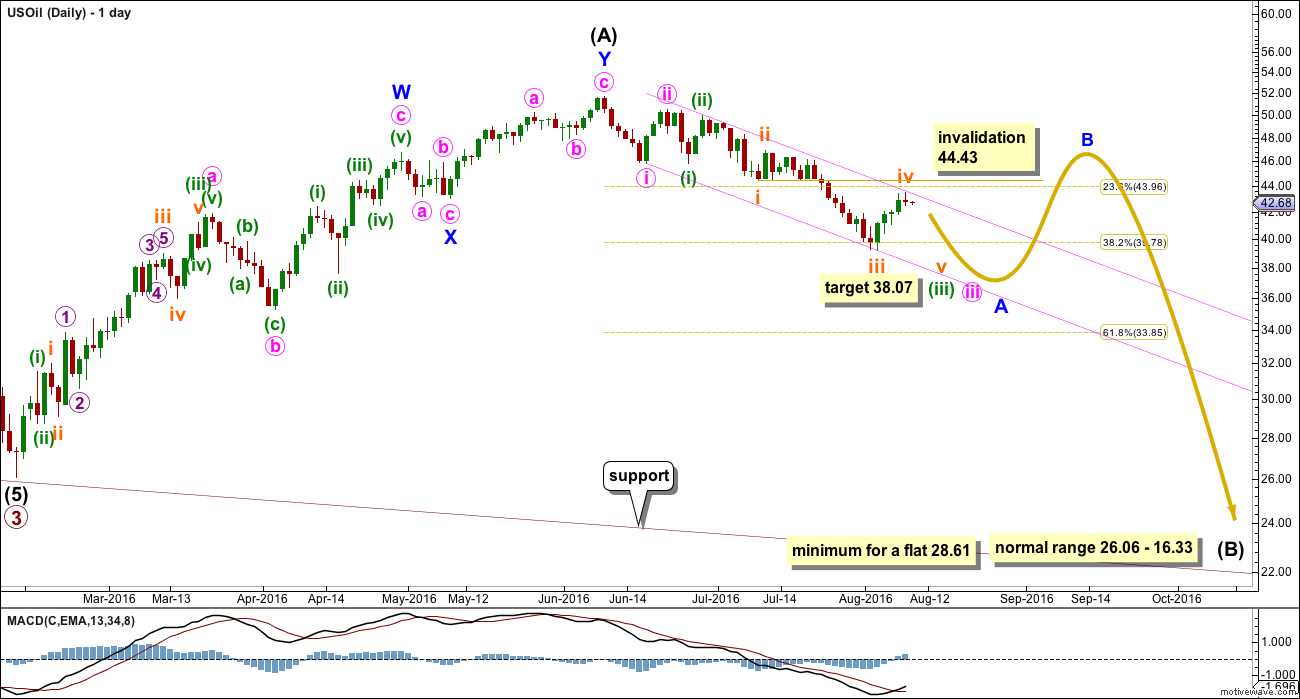
Intermediate wave (A) may be complete as a double zigzag.
If intermediate wave (A) is a three, then intermediate wave (B) is most likely to be a very deep correction. It may make a new low below the start of intermediate wave (A) at 26.06.
If primary wave 4 is to be a flat correction, then intermediate wave (B) must be a minimum 0.9 length of intermediate wave (A) at 28.61. The normal range for intermediate wave (B) would be 1 to 1.38 the length of intermediate wave (A) at 26.06 to 16.33.
If primary wave 4 is to be an expanded flat correction, then intermediate wave (B) should be 1.05 the length of intermediate wave (A) or longer, at 24.78.
If primary wave 4 is to be a triangle, then intermediate wave (B) has no minimum nor maximum. It must only subdivide as a three wave structure. It may make a new low below the start of intermediate wave (A) at 26.06 as in a running triangle.
Primary wave 4 may not move into primary wave 1 price territory above 74.96.
Intermediate wave (B) may be any of more than 23 possible corrective structures. It would most likely be a single or multiple zigzag in order to be a deep correction. It may also be an expanded flat to be deep. It may find support at the lower edge of the maroon channel.
Minor wave A is unfolding as an impulse. Within minor wave A, the middle is unfolding.
Subminuette wave iii ended short of the target in last week’s analysis, and it has no Fibonacci ratio to subminuette wave i. Subminuette wave iii fits as a complete impulse on the hourly chart. Upwards movement for the last week is most likely subminuette wave iv, which may not move back into subminuette wave i price territory above 44.43.
At 38.07 subminuette wave v would reach equality in length with subminuette wave i. This is the most common ratio for a fifth wave, so this target has a reasonable probability.
There should be two more relatively time consuming fourth wave corrections along the way down to complete minor wave A: the next for minuette wave (iv) and then the last for minute wave iv.
At 35.27 minute wave iii would reach 2.618 the length of minute wave i.
Draw a best fit acceleration channel about this downwards movement, and keep redrawing the channel as price moves lower. The upper edge may provide resistance to upcoming corrections along the way down. With price touching the upper edge today, this may provide resistance initiating a reaction and downwards movement today from here.
If price breaks above the upper edge of the channel and makes a new high above 44.43, then this wave count is wrong.
When minor wave A is a complete five wave structure, then minor wave B should begin. As a B wave within a B wave, it is likely to be complicated and time consuming. Oil may then move into a consolidation. Trading this market when a B wave within a B wave unfolds should be avoided.
ALTERNATE DAILY ELLIOTT WAVE COUNT
Click chart to enlarge.
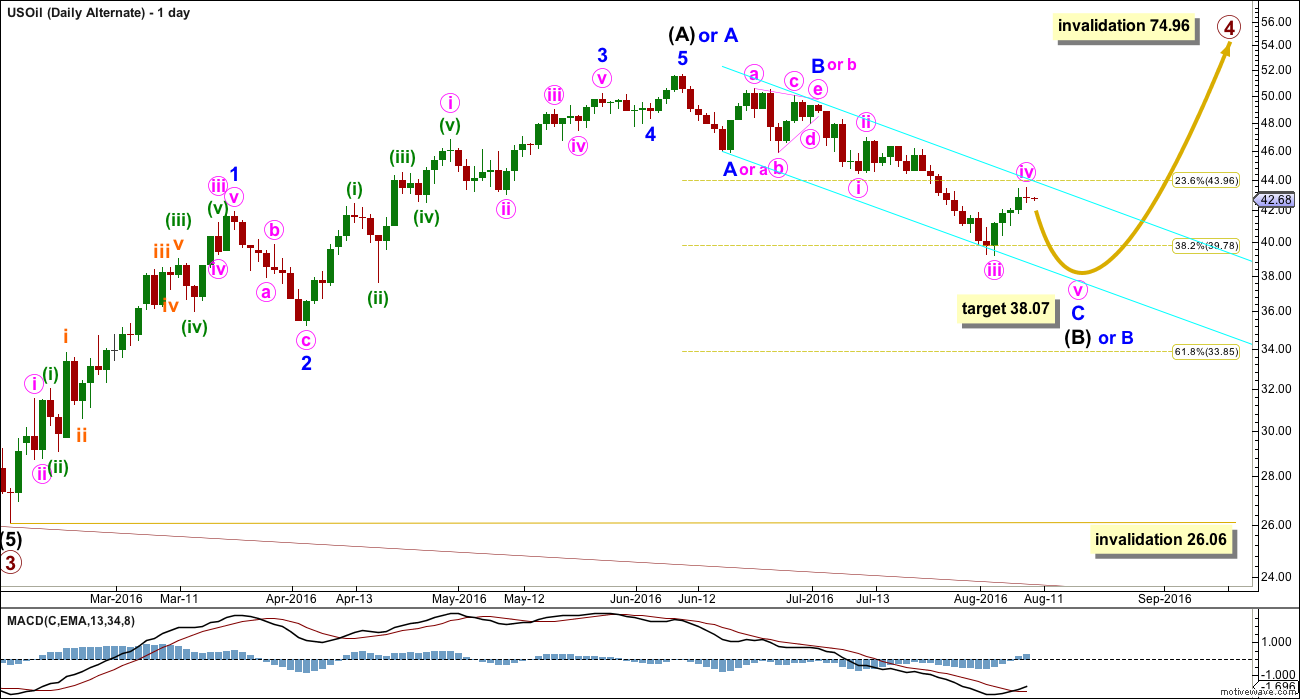
Primary wave 4 may be unfolding as a zigzag, or a zigzag upwards may be almost complete for intermediate wave (A) (as per alternate labelling on this chart).
Intermediate wave (B) or minor wave B downwards may be an almost complete zigzag. The impulse of minor wave C or minute wave c downwards would be incomplete because it still requires a final fifth wave down. The target is the same for the next wave down for a fifth wave. At 38.07 minute wave v would reach equality in length with minute wave i. Thereafter, the wave counts diverge strongly.
This wave count looks forced mostly because the triangle of minor wave B or minute wave b does not look right. It comes to too quick an end and the trend lines are too steep for a normal look. But it remains valid because no Elliott wave rules are broken and all guidelines are reasonably met.
If intermediate wave (A) or minor wave A is a five wave structure, then intermediate wave (B) or minor wave B may not move beyond its start below 26.06.
TECHNICAL ANALYSIS
DAILY CHART
Click chart to enlarge. Chart courtesy of StockCharts.com.
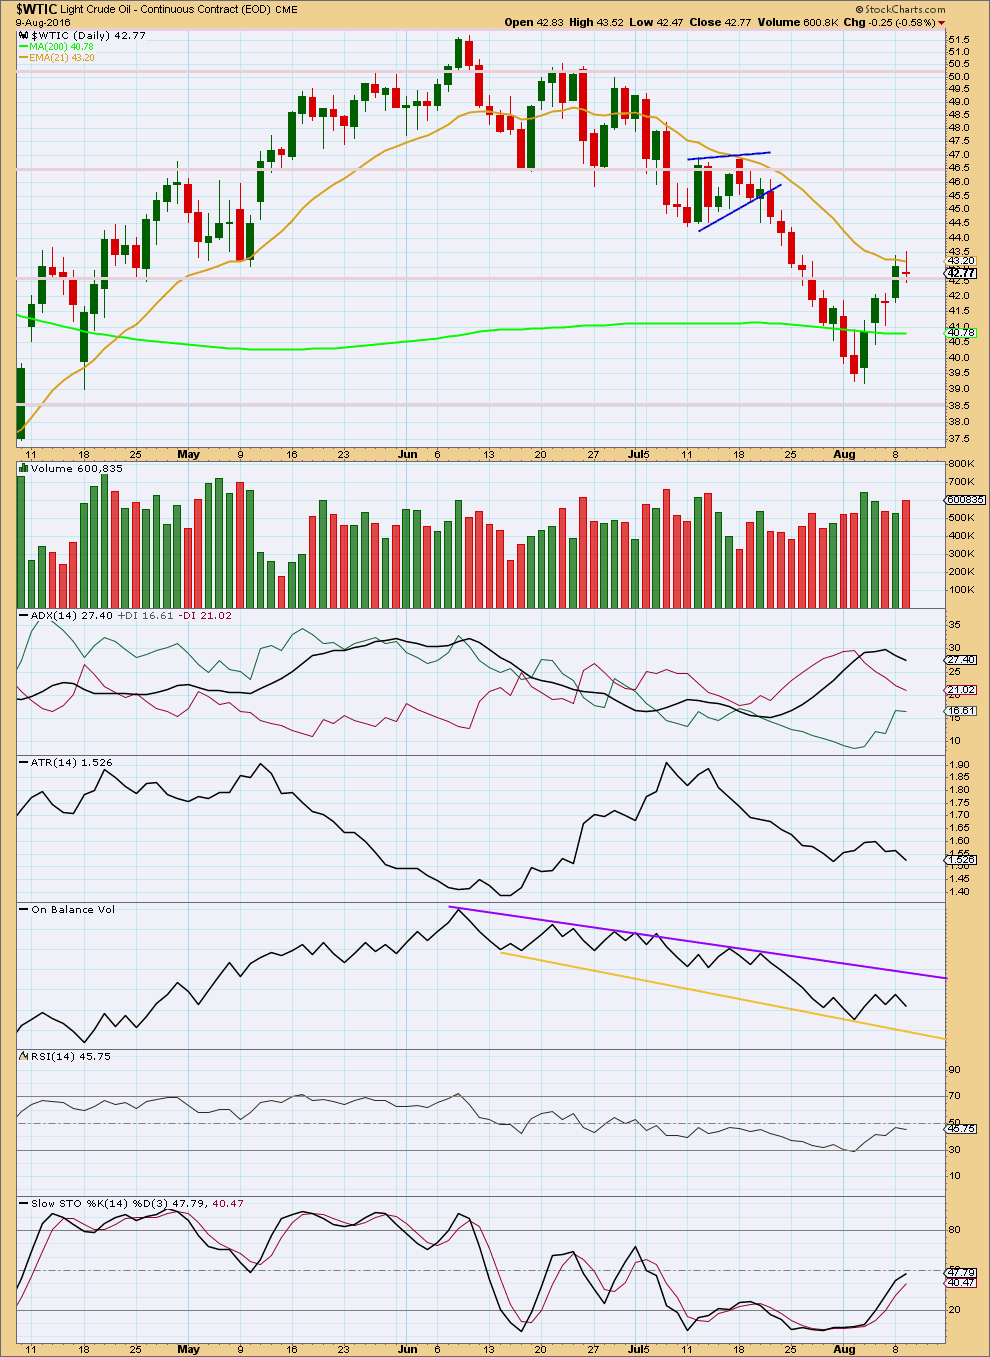
The small flag pattern correctly indicated a continuation of the downwards trend. Using the measured rule, a target of about 39.95 is indicated. Price reached 39.19, just below the target, and turned up there.
Overall, volume was increasing as price was falling. The fall in price was supported by volume, which supports the Elliott wave count. Third waves should have support from volume. Now volume is falling as price is rising. This also supports the Elliott wave count; upwards movement looks like a counter trend movement.
Price may find resistance about the 13 day average during this downwards movement. With price now at this average, this upwards correction may be expected to end about here.
ADX is now declining, indicating a correction. It has not indicated a trend change: the -DX line remains above the +DX line.
ATR is overall flat, in agreement with ADX.
On Balance Volume is constrained within the two trend lines, redrawn this week. A break above the purple line would be bullish. A break below the yellow line would be bearish.
RSI is not yet oversold. There is room for price to fall further.
This small correction has brought Stochastics back up from oversold. There is again room for price to fall.
This analysis is published @ 11:45 p.m. EST.
The last wave down now must be complete, and it looks like a three.
Intermediate (B) is either a flat correction as labelled here, or could also be a double zigzag.
If the minimum for a flat is not met then intermediate (B) must be a double zigzag by process of elimination.
Thanks for the update. Lets hope you get it right this time.
Greetings
Corrections are hard to get right. Particularly B waves.
One thing to mention is if this wave count above is right then this is a B wave within a B wave. They’re the absolute worst. They can be very complicated, choppy and overlapping.
I’ll be avoiding trying to trade this market while it unfolds.
It’s impossible for me to tell what pathway price will take along the way, there are more than 23 possible structures for this B wave. It could be any one.
I will be providing a new daily chart for US Oil before markets open on Monday.
I’ll be doing that tomorrow in my morning.
For now, I’ve surfed so much this weekend I’m exhausted 🙂 And so happy!
But yes, we need a new chart. I had a small short which was stopped out.
We went past $44.43 today on the september contract. I guess wave count is invalidated.
I don’t know what you guys think, but this looks like a wave 2 to me.
What do you think?
With the invalidation of the Main daily count , I went back to see if there is alternate count for the present price action. What if Intermediate (A), which ended in early June was not a three wave WXY, but rather a 5 wave impulse, as seen in the chart. True, the look is not great, but Minor 3 is not the shortest of the moves up and wave 4 does not move into the price territory of wave 1. If we use this count, then the recent retracement could be seen as a double zigzag (WXY) for Intermediate (B) ending in early August. In this count we would now be in the early stages of Intermediate (C), and we should expect a five wave move to the upside to reach at least 51.64 to avoid a truncation. Wave C reaches equality with Wave A at 64.73.
Have to make a correction, Minor wave 3 and 4 of Intermediate (A) must be where Lara has them on her alternate wave count in order to have an acceptable count for Minor 5 of Intermediate (A). While both the main and alternate counts were invalidated by today’s price action, I believe that Lara’s alternate count is still valid if Intermediate (B) is taken to be a complete WXY instead of an ABC in progress.
On my phone too. Does it look possible that Intermediate (B) is a flat (3-3-5)? Where the A wave completed as a double zig zag, B is probably in the process of finishing as a zig zag, and C wave is yet to come?
dang…i think the next invalidation is 45.80-45.90 ish…cant be exact as im on my phone. Still in down trend.
Think the same…
With the recent invalidation can we get a new chart?
Invalidated!