
Upwards movement was expected for Friday’s session but did not happen.
Price remains above the invalidation point on the daily chart, which is where final risk remains.
Summary: Divergence between the last two swing lows for price and RSI indicate bears are tired. It is likely still that downwards movement will end here or when price finds final support about 1,305. Confidence in a trend change may be had above 1,311.27, a breach of the channel on the hourly chart, and finally above 1,326.11. Upwards movement is expected next week.
New updates to this analysis are in bold.
Last weekly charts are here.
Grand SuperCycle analysis is here.
DAILY ELLIOTT WAVE COUNT
Click chart to enlarge.
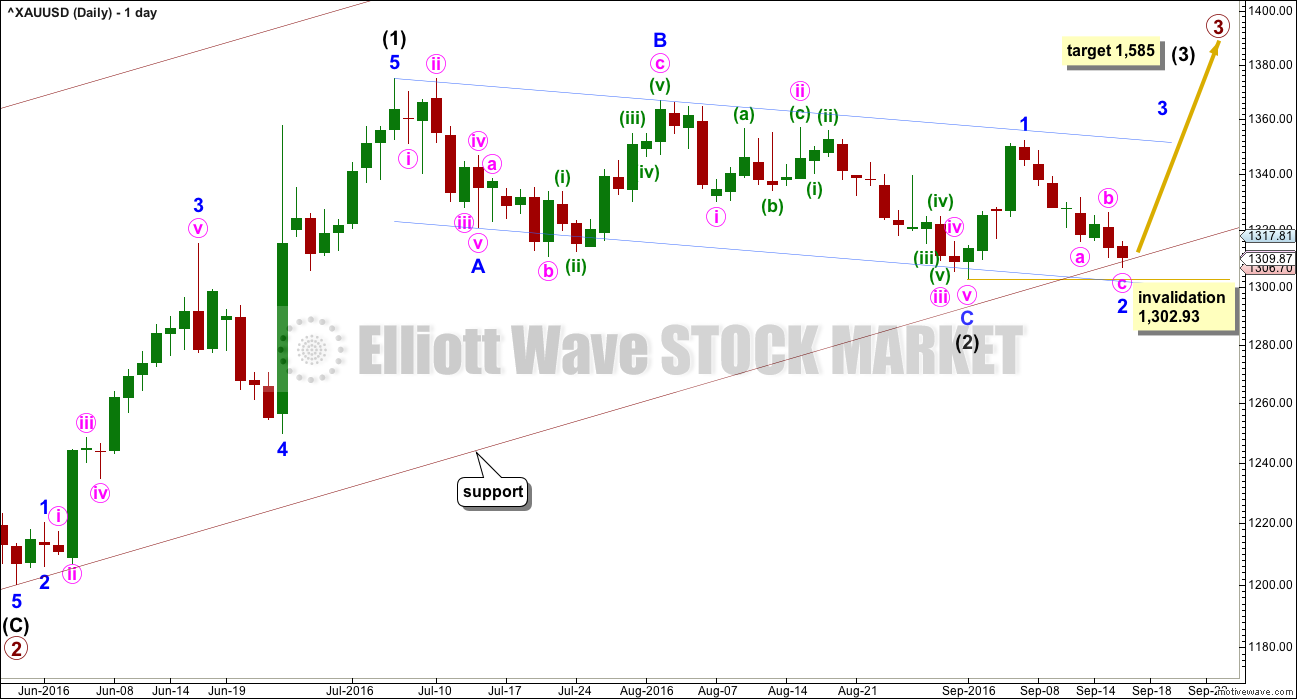
Primary waves 1 and 2 are complete. Thereafter, this wave count differs from the alternate.
This main wave count will expect primary wave 3 to be longer than primary wave 1. Because this is very common, this is the main wave count. It expects the most common scenario is most likely. At 1,585 intermediate wave (3) would reach 1.618 the length of intermediate wave (1).
Intermediate wave (2) may now be complete ending just below the 0.382 Fibonacci ratio of intermediate wave (1) and lasting 40 days. Within intermediate wave (3), minor wave 2 may not move beyond the start of minor wave 1 below 1,302.93.
Draw a channel about intermediate wave (2) using Elliott’s technique for a correction (blue lines). Price is finding some resistance on the way up about the upper edge. After breaking through resistance at the upper blue line price may then turn down to find support about there.
With this wave count expecting a third wave at two large degrees to begin, look out for surprises to the upside at this stage.
Intermediate wave (1) lasted 27 days and intermediate wave (2) lasted 40 days. Intermediate wave (3) may be reasonably expected to last longer than intermediate wave (1) in both time and price. A Fibonacci 55 days would be a first expectation.
FIRST HOURLY ELLIOTT WAVE COUNT
Click chart to enlarge.
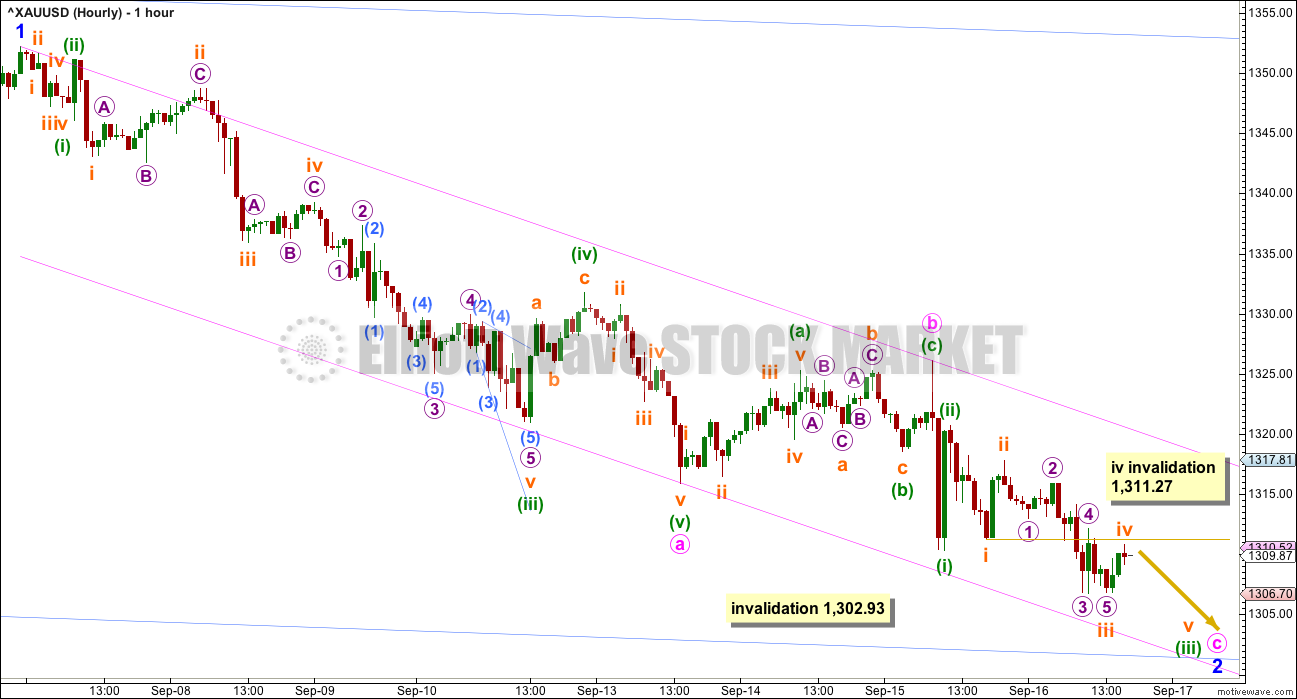
Two different hourly wave counts will be provided today.
This first wave count follows on from yesterday’s hourly analysis.
If minute wave b ended as labelled here, then the structure of minute wave c is now incomplete. This downwards movement will not fit as a completed impulse or ending diagonal, the only two structures allowable for a fifth wave.
Within minute wave c, two slight new lows are required to complete this structure. Subminuette wave v is very likely to end below the end of subminuette wave iii at 1,306.79 to avoid a truncation. This would complete minuette wave (iii).
After a small correction for minuette wave (iv), a final low to complete minuette wave (v) would complete the structure at all wave degrees.
Minor wave 2 may end at 1,302.93 but not below. It may not move beyond the start of minor wave 1. This invalidation point is black and white. It may not be breached by any amount at any time frame for the wave count to remain valid.
Within minute wave c, the small correction of subminuette wave iv may not move into subminuette wave i price territory above 1,311.27.
To judge the probability of the two hourly wave counts Fibonacci ratios and subdivisions may be compared.
Ratios within minute wave a are: there are no adequate Fibonacci ratios between minuette waves (i), (iii) and (v).
Ratios within minuette wave (iii) are: subminuette wave iii is 0.26 short of 1.618 the length of subminuette wave i, and subminuette wave v has no Fibonacci ratio to subminuette waves i or iii.
Problems:
1. Subminuette wave i within minuette wave (iii) within minute wave c looks like a three. It should be a five.
2. Micro wave 5 of subminuette wave iii of minuette wave (iii) of minute wave c is slightly truncated by 0.09.
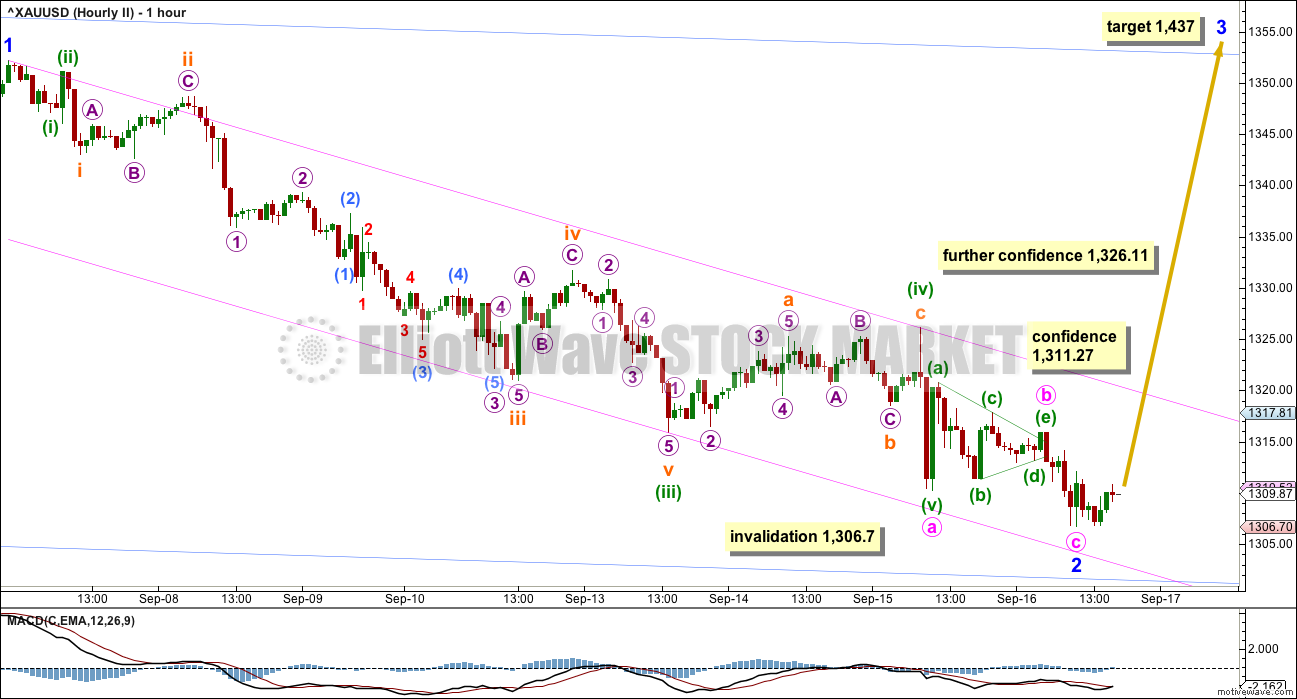
SECOND HOURLY ELLIOTT WAVE COUNT
Click chart to enlarge.
This second wave count is different from the first from the high labelled subminuette wave ii.
With minuette wave (iii) seen differently it could have ended lower. This means minute wave a ended later and minute wave b now fits as a small regular contracting triangle.
Minute wave c may have ended at Friday’s low.
Minute wave c would be just 0.67 short of 0.236 the length of minute wave a.
Ratios within minute wave a are: minuette wave (iii) is 0.54 longer than 6.854 the length of minuette wave (i), and minuette wave (v) has no Fibonacci ratio to either of minuette waves (i) or (iii).
Ratios within minuette wave (iii) are: there is no Fibonacci ratio between subminuette waves iii and i, and subminuette wave v is 1.34 short of 0.618 the length of subminuette wave iii.
The Fibonacci ratios for this second wave count are slightly better than the first wave count.
Problems:
1. The triangle of minute wave b looks a little forced. Also, it is not supported by MACD hovering at zero while it unfolded. This is a judgement based upon experience; no guidelines are breached nor rules broken.
2. Minute wave c looks like a three wave structure when it should be a five.
If price makes a new high above 1,311.27, that would provide a little confidence in this wave count. Further confidence may be had with a breach of the upper edge of the best fit channel (in pink, drawn the same way on both charts). Further confidence may be had in a trend change if price makes a new high above 1,326.11.
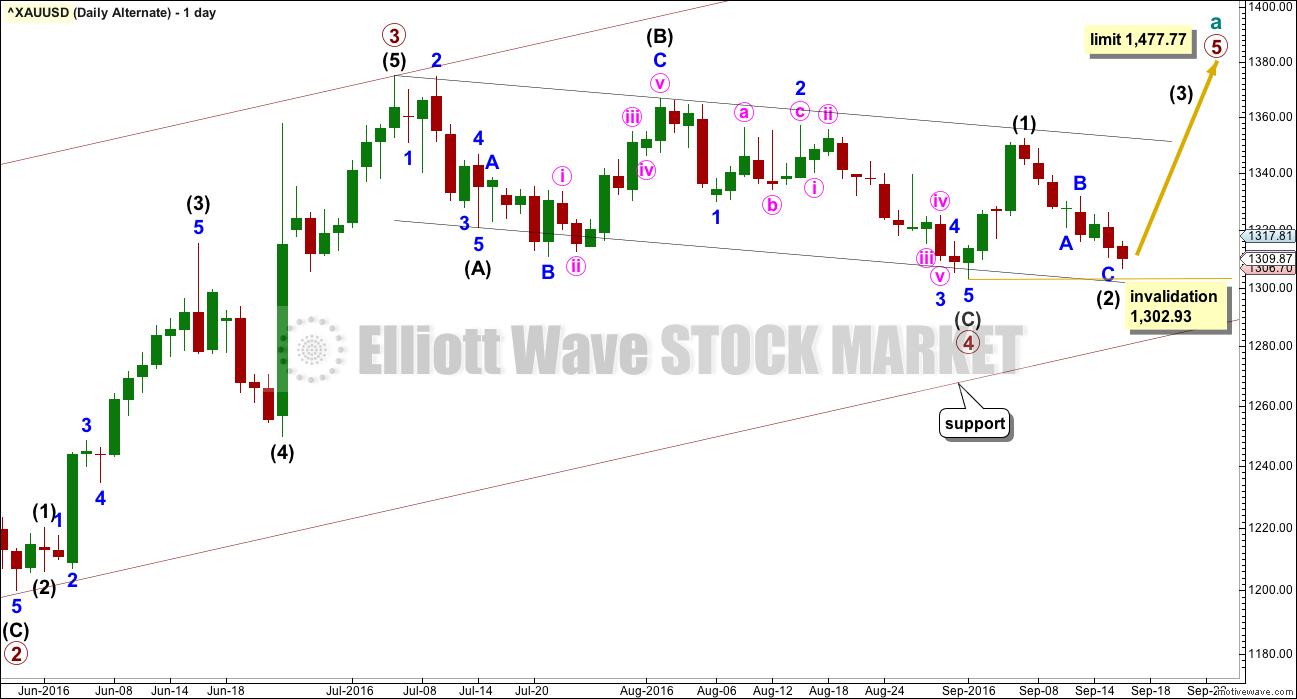
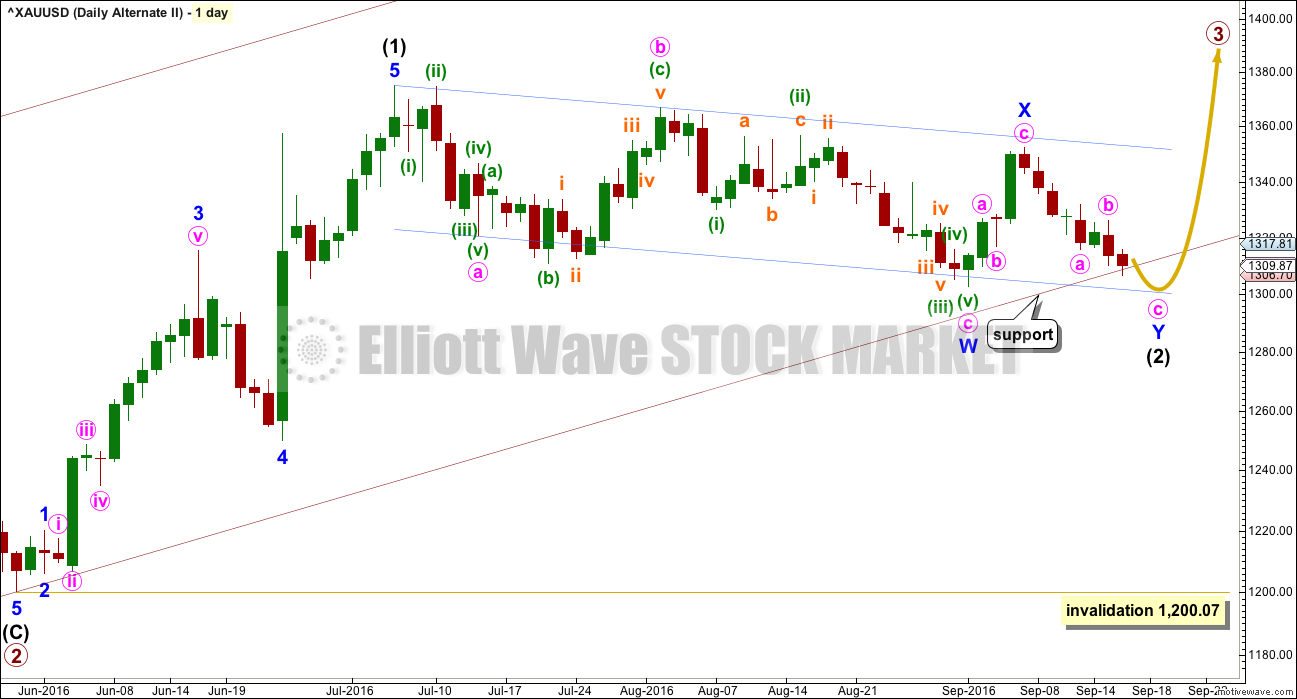
ALTERNATE DAILY ELLIOTT WAVE COUNT
Click chart to enlarge.
It is possible that primary wave 3 is over and shorter than primary wave 1. Primary wave 3 shows stronger volume than primary wave 1 (see technical analysis weekly chart).
If primary wave 3 is over, then the current consolidation for Gold would be primary wave 4.
Primary wave 2 was a relatively shallow 0.35 expanded flat correction. Primary wave 4 may be a deeper zigzag which would exhibit perfect alternation.
Within primary wave 5, no second wave correction may move beyond the start of its first wave below 1,302.93.
Primary wave 5 would be limited to no longer than equality in length with primary wave 3, so that the core Elliott wave rule stating a third wave may not be the shortest is met. Primary wave 5 would have a limit at 1,477.77.
The hourly chart would be exactly the same.
SECOND ALTERNATE DAILY ELLIOTT WAVE COUNT
Click chart to enlarge.
What if the price point of 1,302.93 is breached? How would the Elliott wave count look and would it make sense?
In the unlikely event that happens, then the most reasonable explanation would be a continuation of intermediate wave (2).
The lower maroon trend line would be important. This is the lower edge of a base channel drawn about primary waves 1 and 2. Lower degree second waves should not breach base channels drawn about first and second waves one or more degrees higher. This is usually how Gold’s impulses behave, but almost is not the same as always. Occasionally base channels are breached.
The structure of intermediate wave (2) would not make sense unless it moves substantially lower and strongly breaches the base channel. It will fit as a double zigzag, but this so far has a sideways look. The purpose of the second zigzag in the double is to deepen the correction when the first zigzag does not move price deep enough. Minor wave Y should end substantially below the end of minor wave W to achieve this purpose.
Double zigzags usually have a clear slope against the prior trend; they look very much like single zigzags. So far this movement looks more like a combination, but it will not fit the rules for a combination. Again, almost is not the same as always. Very occasionally a double zigzag does not have the right look.
This wave count is possible in that many things are possible. However, it must be judged to have a very low probability due to the problems with the base channel and the structure of intermediate wave (2).
It is published primarily to illustrate the low probability of a new low below 1,302.93 at this stage.
TECHNICAL ANALYSIS
WEEKLY CHART
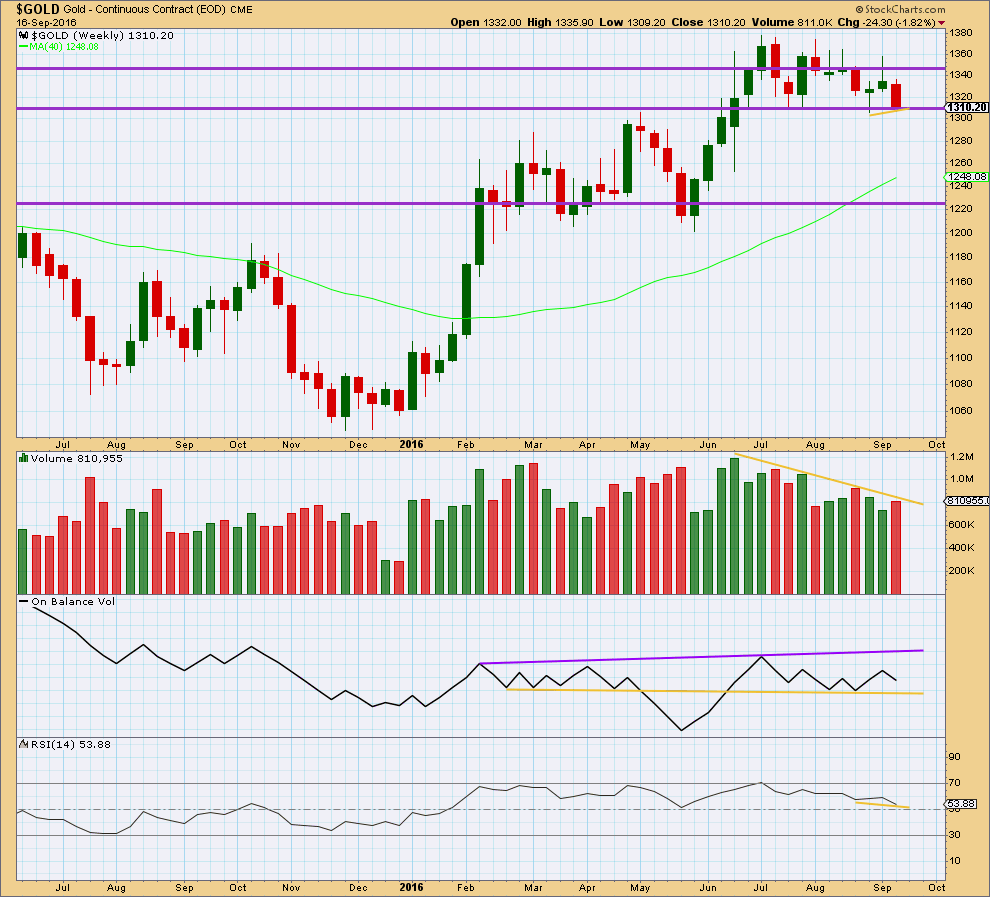
Click chart to enlarge. Chart courtesy of StockCharts.com.
Short term stronger volume for this downwards week compared to the prior green weekly candlestick is short term bearish. Again, it is important to look inside this week at daily candlesticks to have a clearer picture to what is happening here.
Mid term price is again finding support about 1,310 – 1,305. Volume is declining as price has been moving sideways. This sideways movement is more likely to be a consolidation than the start of a new trend.
On Balance Volume remains overall bullish with the last signal a bounce up from support at the yellow line. A break above the purple line would be a strong bullish signal. A break below the yellow support line would be a reasonable bearish signal.
RSI is close to neutral. There is room for price to rise or fall. RSI exhibits short term divergence at this week’s low with its last low, indicated by short yellow lines on price and RSI. This divergence is bullish and indicates weakness in the downwards movement from price this week. For Gold this divergence at the weekly chart level at its lows is usually a fairly reliable signal of a bottom. This reliability in the past means this divergence should be given reasonable weight in this analysis.
DAILY CHART
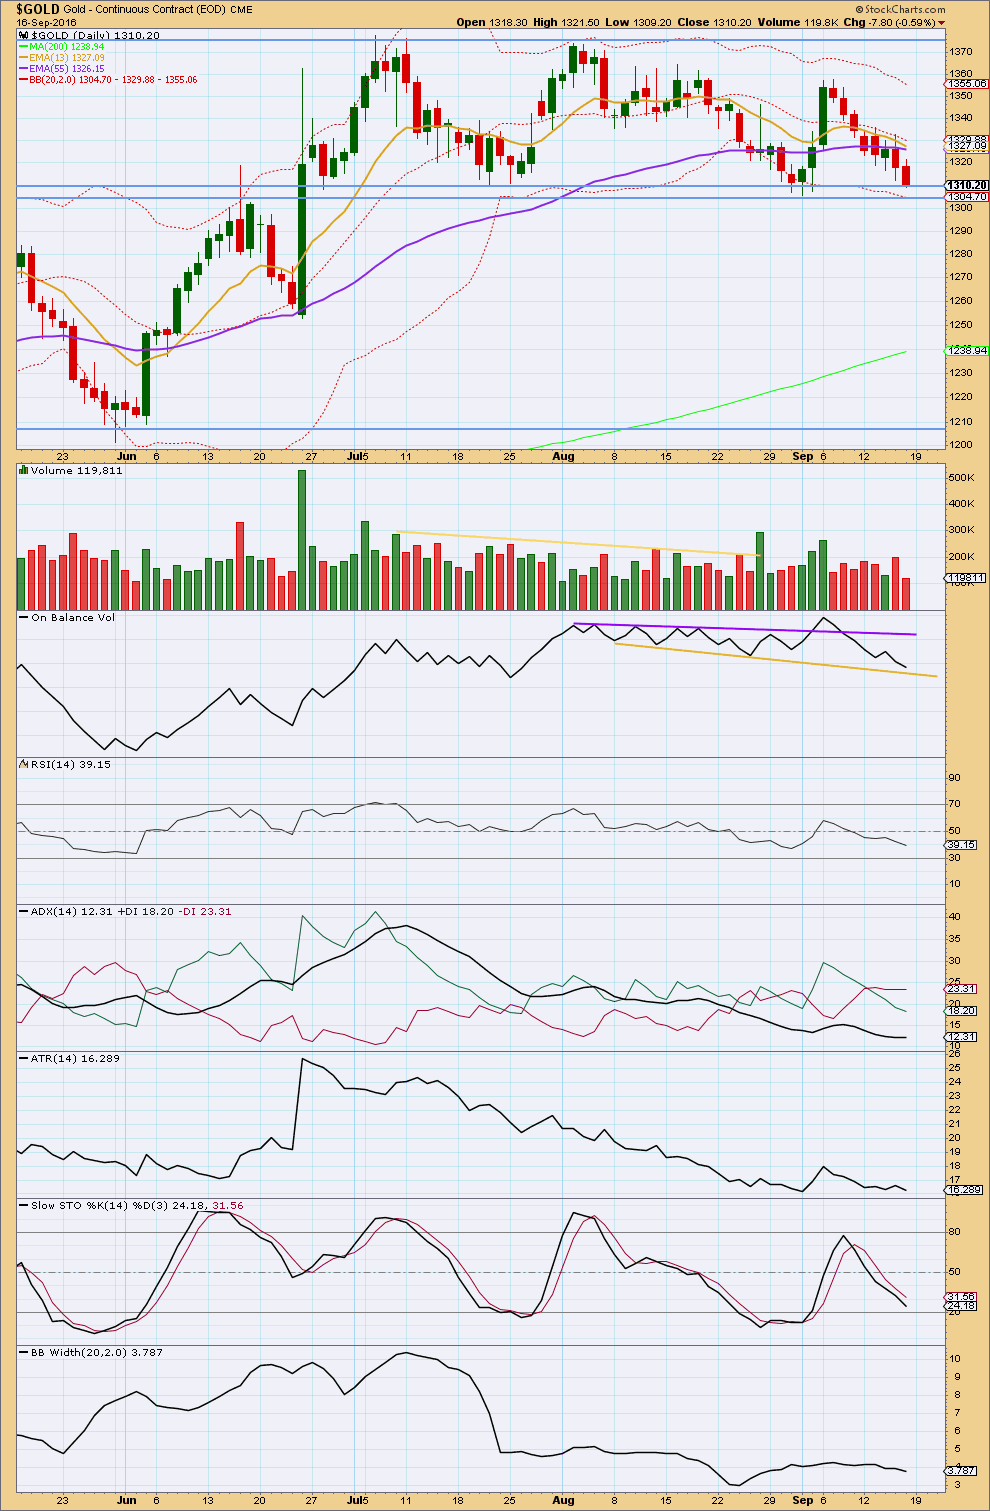
Click chart to enlarge. Chart courtesy of StockCharts.com.
Price is now again at support at 1,310. Thursday’s stronger volume suggested a little more downwards movement was possible, and now Friday’s red daily candlestick comes with much lighter volume. With volume for Friday now the lightest of all days, within this eight day fall, this indicates the bears are tired and the probability that a low is in place for Friday has increased.
The yellow support line for On Balance Volume has been redrawn. At this stage, it may not be made any steeper. This line now allows for a very little more downwards movement from OBV, so there is a little room here for price to move slightly lower as OBV moves lower. Price should find support at 1,305 and OBV should now find support at the yellow line.
ADX at 12.31 is flat, exactly the same as yesterday. ADX is indicating that this market is not trending. ATR overall still agrees because it is still flat to declining and is very low. Bollinger Bands are still tightly contracted. With all three of these indicators still in agreement that the market is not trending, it is reasonable to conclude still that this downwards movement is a counter trend movement and will end when price finds support.
RSI is below neutral. There is plenty of room for price to rise or fall. At the daily chart level, there is no additional divergence between price and RSI to indicate any weakness.
The bottom line is the market is consolidating. It is range bound with resistance at 1,375 and support at 1,310 – 1,305. During the consolidation, it remains three upwards days which have strongest volume. This strongly suggests an upwards breakout is more likely than downwards.
The 200 day moving average remains pointing upwards. Price remains above it. The mid term Fibonacci 55 day moving average is today slightly declining and it is possible it may be rolling over. It remains above the long term average. The short term Fibonacci 13 day moving average is pointing lower, but remains above the mid and long term averages. These averages so far indicate the longer term trend remains upwards and that downwards movement is a counter trend movement.
Assume the trend remains the same until proven otherwise. At this stage, the weight of evidence points to the longer term trend remaining upwards.
This analysis is published @ 10:46 p.m. EST.
The first hourly chart is invalidated with a new high above 1,312.11. The second hourly chart is confirmed.
Price has not moved much higher, today’s upwards day has a small range. Price remains within the best fit channel, it’s finding resistance at the upper edge.
For a reasonable level of confidence that there has been a trend change I want that channel to be breached and a new high above 1,326.11.
Particularly while price remains within that channel there is the possibility that my wave count is wrong at the hourly chart level and Gold may yet move lower.
Invalidation point on the daily chart will remain for now at 1,302.93. For any long positions at this stage this is still where risk must be.
More conservative traders may like to wait for the channel to be breached and / or price to move above 1,326.11 before entering long.
My stops will remain just below 1,302.93 for now.
Going by the 2nd hourly, here’s one possible update. There may be others.
I agree with that count off the lows, hopefully this is it for the gold bulls
Hi everyone
Gold is in subminutte 3 of minuette 3 or still its in submin 1 ??
Any comment
Subminuette 3 of Minuette 1 to me.
I feel that otherwise there is insufficient room for price to rise to 1585 unless there are outsized price spikes like 4.236 or 6.854 Fib. Lara may disagree though.
First Hourly wave count invalidated. Second hourly wave count in play:
Lara: “If price makes a new high above 1,311.27, that would provide a little confidence in this wave count.”.
Gold is trading at 1315.
Yes as per Barchart gold traded above 1,311.27 Sunday so bearish First hourly wave count invalidated with movement for subminuette iv invalidated when moved above 1,311.27 and bullish Second hourly wave count confirmed with confidence above 1,311.27.
http://www.barchart.com/quotes/stocks/%5EXAUUSD
go to barchart.com and choose symbol %5EXAUUSD
Forex Quote as of Sun, Sep 18th, 2016
High 1,316.62
Hi Lara,
what do think about this as an alternative count?
Can it be that primary wave 2 is not done?
Stefan
Two thoughts:
It would be highly unlikely for an X wave to be so strong and to go beyond the start of the previous W wave. That defeats the purpose of an x wave
You can’t have a multiple within a multiple, in other words, a W-X-Y cannot be within another W-X-Y
So if P2 was continuing, it would need to be labeled differently as an expanded flat
In addition to Dreamer’s comments:
If relabelling this as an expanded flat, intermediate (B) at 174.84 is over 2 X the length of intermediate (A) which was 82.61. The probability that primary 2 is continuing further as an expanded flat is so low the idea should be discarded. Which is why I discarded it.
There is a problem in your labelling of intermediate (Y). If it’s A wave subdivides as a three (and it may be any corrective structure, including a multiple) then it’s B wave must retrace a minimum 0.9 length of the A wave. When A waves subdivide as threes a flat is indicated, and the minimum rule for length of the B wave to follow must be met.
I’m mentioning this because your arrow for minor B within intermediate (Y) is too shallow.
As for the no multiples within multiples, this is how that works:
Within a multiple (example here of intermediate (W) and (Y) ) the subdivisions may be only A-B-C (or A-B-C-D-E in the case of triangles). And so in your example minor waves within your intermediate (W) and (Y) may only be A-B-C.
But within minor waves A or B they may subdivide as multiples.
It’s only minor degree which must meet the rule, so that the maximum number of corrective structures at minor degree is three.
Does that make sense?
JUST A VIEW: IMO Gold price appears top heavy for the week with weekly H 1332 / L 1306. MACD, Momentum & ROC remain bearish. Sentiment: Keeping it short for the week. Will look to add shorts on an expected rebound on Monday which not expecting to get to or past Friday high (it will be great if it did). Lets see how this plays out. GL all!
Great analysis.
On a weekly analysis gold ended bear trend with ZZ WXY.
From Rule of Alteration Y leg was longer in duration than wave X.
In current wave count Alt II gold is moving down in wave Y.
What should be the duration of wave Y compared to wave X?