
Upwards movement was again expected.
Price has moved sideways to complete an inside day.
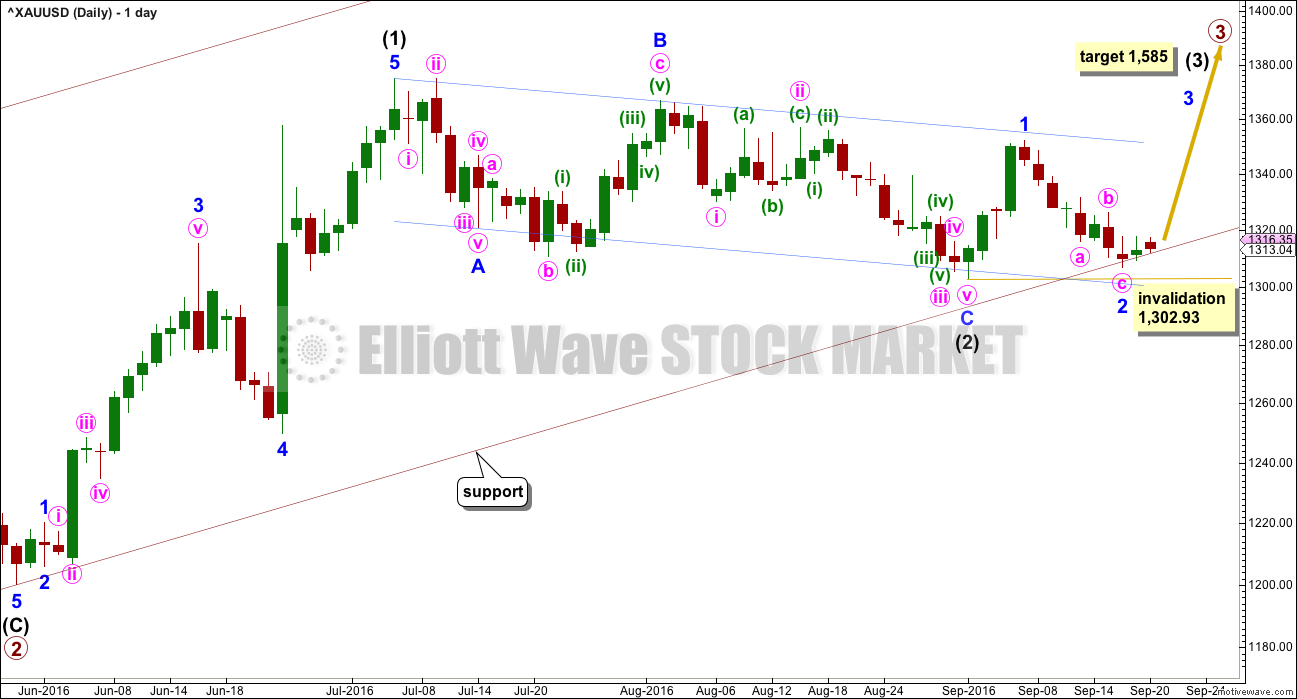
Summary: The larger picture remains bullish. It is still more likely that Gold remains in a larger upwards trend and this downwards movement is a countertrend pullback. There is room still for price to make a slight new low before turning, risk remains at 1,302.93. The long term target remains at 1,585.
New updates to this analysis are in bold.
Last weekly charts are here.
Grand SuperCycle analysis is here.
DAILY ELLIOTT WAVE COUNT
Click chart to enlarge.
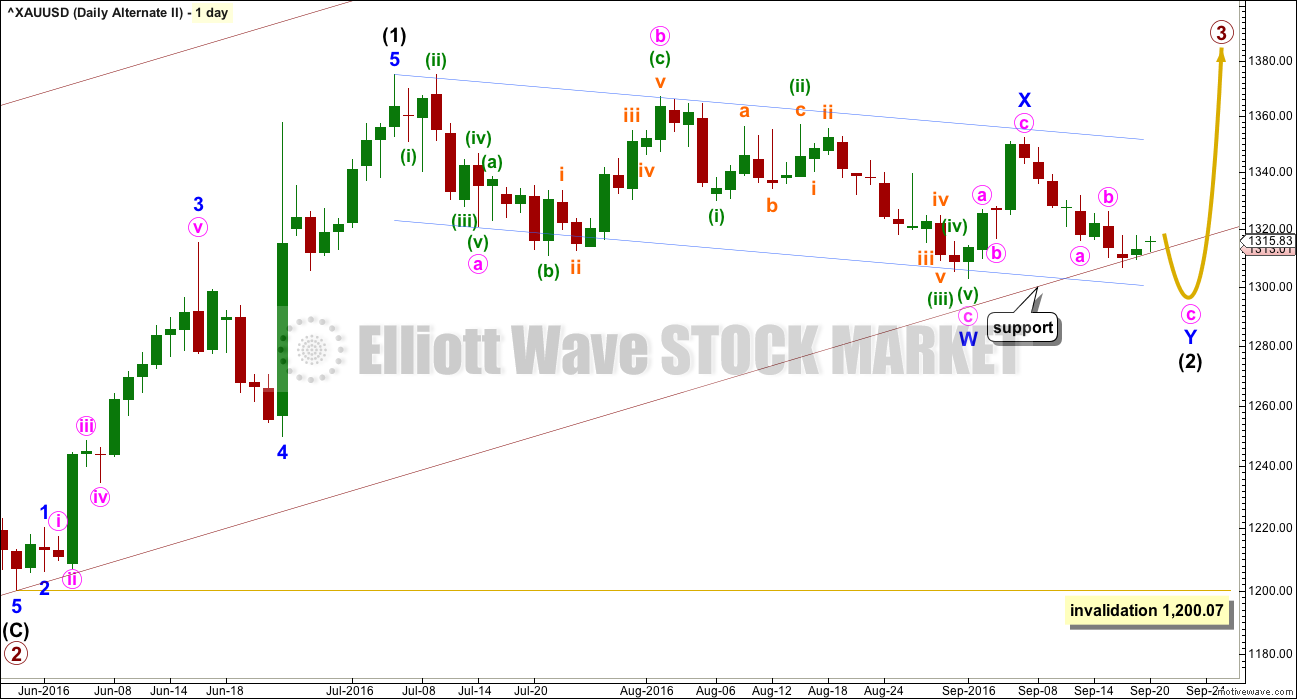
Primary waves 1 and 2 are complete. Thereafter, this wave count differs from the alternate.
This main wave count will expect primary wave 3 to be longer than primary wave 1. Because this is very common, this is the main wave count. It expects the most common scenario is most likely. At 1,585 intermediate wave (3) would reach 1.618 the length of intermediate wave (1).
Intermediate wave (2) may now be complete ending just below the 0.382 Fibonacci ratio of intermediate wave (1) and lasting 40 days. Within intermediate wave (3), minor wave 2 may not move beyond the start of minor wave 1 below 1,302.93.
Draw a channel about intermediate wave (2) using Elliott’s technique for a correction (blue lines). Price is finding some resistance on the way up about the upper edge. After breaking through resistance at the upper blue line price may then turn down to find support about there.
With this wave count expecting a third wave at two large degrees to begin, look out for surprises to the upside at this stage.
Intermediate wave (1) lasted 27 days and intermediate wave (2) lasted 40 days. Intermediate wave (3) may be reasonably expected to last longer than intermediate wave (1) in both time and price. A Fibonacci 55 days would be a first expectation. Intermediate wave (3) may end with a blowoff top.
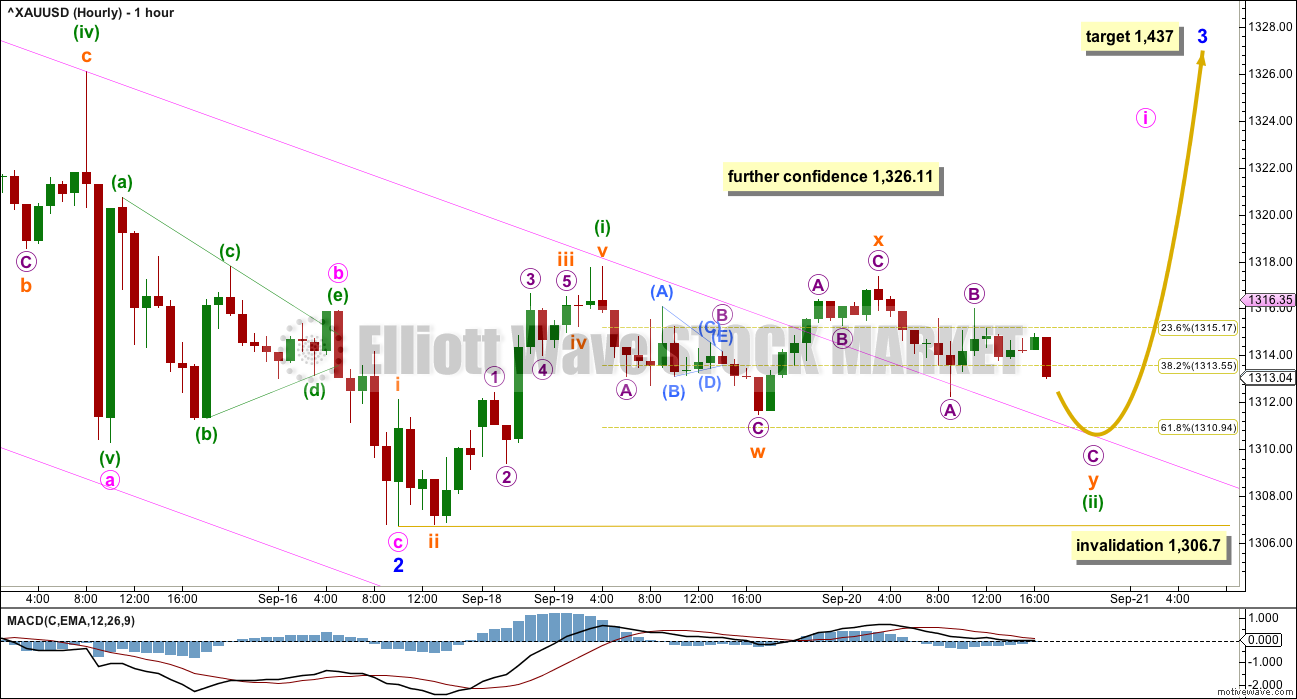
FIRST HOURLY ELLIOTT WAVE COUNT
Click chart to enlarge.
Minute wave c may have ended at Friday’s low.
Minute wave c would be just 0.67 short of 0.236 the length of minute wave a.
Ratios within minute wave a are: minuette wave (iii) is 0.54 longer than 6.854 the length of minuette wave (i), and minuette wave (v) has no Fibonacci ratio to either of minuette waves (i) or (iii).
Ratios within minuette wave (iii) are: there is no Fibonacci ratio between subminuette waves iii and i, and subminuette wave v is 1.34 short of 0.618 the length of subminuette wave iii.
The Fibonacci ratios for this wave count are slightly better than the alternate wave count below.
Problems:
1. The triangle of minute wave b looks a little forced. Also, it is not supported by MACD hovering at zero while it unfolded. This is a judgement based upon experience; no guidelines are breached nor rules broken.
2. Minute wave c looks like a three wave structure when it should be a five.
A little more confidence may now be had with a breach of the upper edge of the best fit channel (in pink). Further confidence may be had in a trend change if price makes a new high above 1,326.11.
The best fit channel has been breached and it looks like price has turned down for a throwback, to test support at the upper trend line. Minuette wave (ii) may be continuing sideways as a double zigzag or double combination. It may not move beyond the start of minuette wave (i) below 1,306.70.
Price may now continue to find support at the upper pink trend line.
At 1,437 minor wave 3 would reach 2.618 the length of minor wave 1.
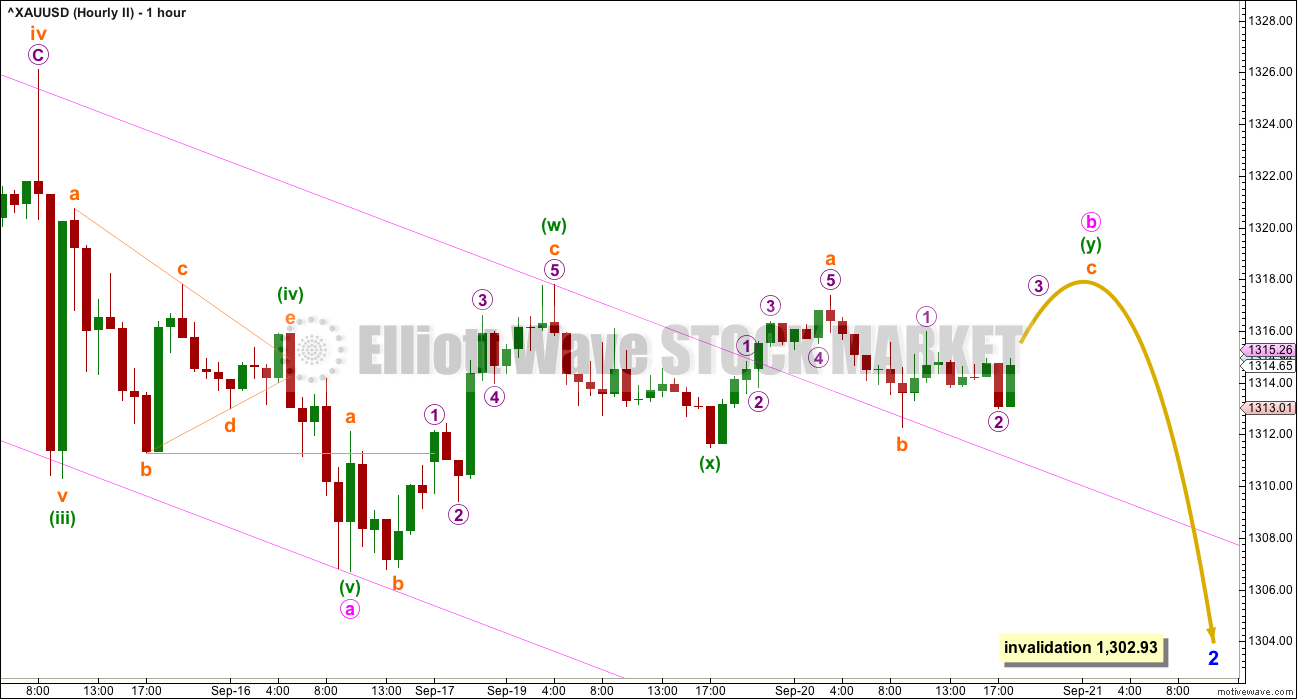
ALTERNATE HOURLY ELLIOTT WAVE COUNT
Click chart to enlarge.
This alternate wave count looks at the possibility that minor wave 2 is still not over and may yet have one more low before it is done. If it does move lower, then it should find strong support at the lower edge of the dark blue channel on the daily chart.
It is possible that minute wave a ended at the last low. Minute wave b may continuing higher as a double zigzag. Unfortunately, this means that there is no price point below the start of minute wave a at 1,352.19 which would invalidate a continuation of minute wave b. Minute wave b may move higher, but it may not move beyond the start of minute wave a if minute wave a is labelled correctly as a five wave impulse.
Ratios within minute wave a are: there is no Fibonacci ratio between minuette waves (i) and (iii), and minuette wave (v) is 0.42 short of 0.236 the length of minuette wave (iii).
Ratios within minuette wave (iii) are: subminuette wave iii is 1.44 short of 4.236 the length of subminuette wave i, and subminuette wave v has no Fibonacci ratio to either of subminuette waves i or iii.
When minute wave b is complete, then the best fit channel may be redrawn using Elliott’s technique for a correction. At that stage, a target for minute wave c may be calculated. With minute wave b incomplete today, it is not known where minute wave c begins, so a target cannot be calculated for it to end.
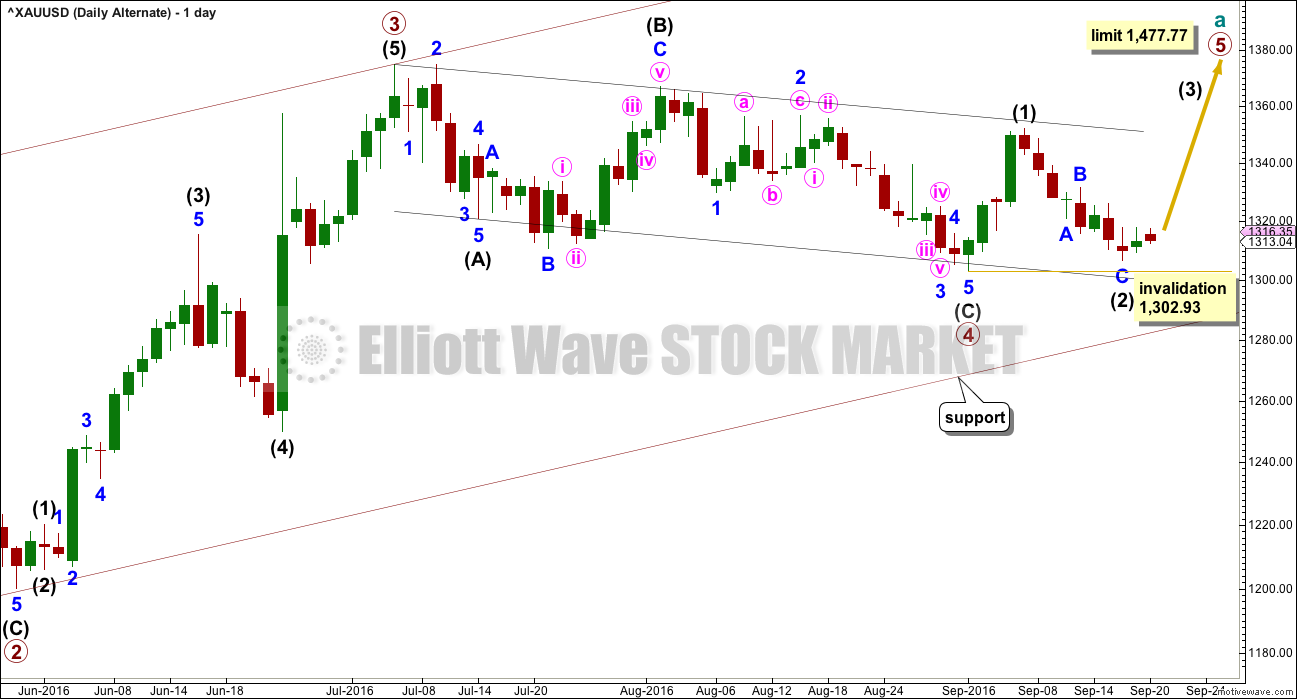
ALTERNATE DAILY ELLIOTT WAVE COUNT
Click chart to enlarge.
It is possible that primary wave 3 is over and shorter than primary wave 1. Primary wave 3 shows stronger volume than primary wave 1 (see technical analysis weekly chart).
If primary wave 3 is over, then the current consolidation for Gold would be primary wave 4.
Primary wave 2 was a relatively shallow 0.35 expanded flat correction. Primary wave 4 may be a deeper zigzag which would exhibit perfect alternation.
Within primary wave 5, no second wave correction may move beyond the start of its first wave below 1,302.93.
Primary wave 5 would be limited to no longer than equality in length with primary wave 3, so that the core Elliott wave rule stating a third wave may not be the shortest is met. Primary wave 5 would have a limit at 1,477.77.
The hourly chart would be exactly the same.
SECOND ALTERNATE DAILY ELLIOTT WAVE COUNT
Click chart to enlarge.
What if the price point of 1,302.93 is breached? How would the Elliott wave count look and would it make sense?
In the unlikely event that happens, then the most reasonable explanation would be a continuation of intermediate wave (2).
The lower maroon trend line would be important. This is the lower edge of a base channel drawn about primary waves 1 and 2. Lower degree second waves should not breach base channels drawn about first and second waves one or more degrees higher. This is usually how Gold’s impulses behave, but almost is not the same as always. Occasionally base channels are breached.
The structure of intermediate wave (2) would not make sense unless it moves substantially lower and strongly breaches the base channel. It will fit as a double zigzag, but this so far has a sideways look. The purpose of the second zigzag in the double is to deepen the correction when the first zigzag does not move price deep enough. Minor wave Y should end substantially below the end of minor wave W to achieve this purpose.
Double zigzags usually have a clear slope against the prior trend; they look very much like single zigzags. So far this movement looks more like a combination, but it will not fit the rules for a combination. Again, almost is not the same as always. Very occasionally a double zigzag does not have the right look.
This wave count is possible in that many things are possible. However, it must be judged to have a very low probability due to the problems with the base channel and the structure of intermediate wave (2).
It is published primarily to illustrate the low probability of a new low below 1,302.93 at this stage.
TECHNICAL ANALYSIS
WEEKLY CHART
Click chart to enlarge. Chart courtesy of StockCharts.com.
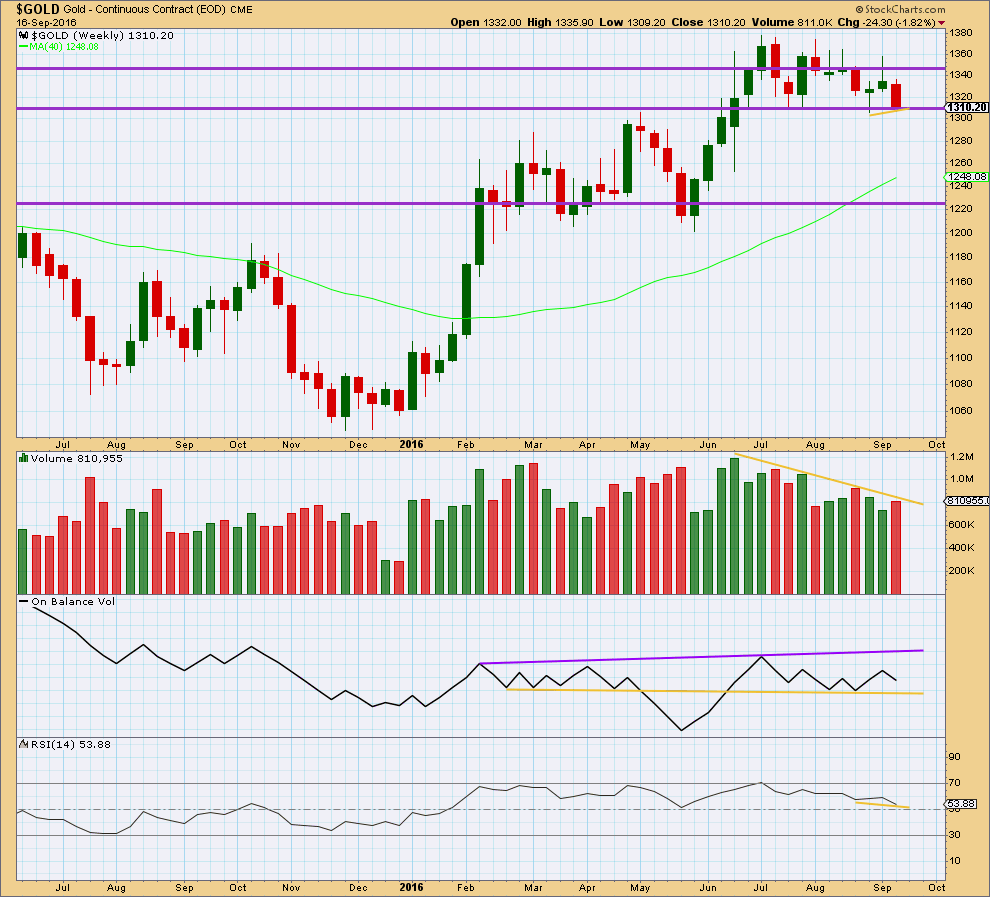
Short term stronger volume for last week compared to the prior green weekly candlestick is short term bearish. Again, it is important to look inside last week at daily candlesticks to have a clearer picture to what is happening here.
Mid term price is again finding support about 1,310 – 1,305. Volume is declining as price has been moving sideways. This sideways movement is more likely to be a consolidation than the start of a new trend.
On Balance Volume remains overall bullish with the last signal a bounce up from support at the yellow line. A break above the purple line would be a strong bullish signal. A break below the yellow support line would be a reasonable bearish signal.
RSI is close to neutral. There is room for price to rise or fall. RSI exhibits short term divergence at last week’s low with its last low, indicated by short yellow lines on price and RSI. This divergence is bullish and indicates weakness in the downwards movement from price last week. For Gold this divergence at the weekly chart level at its lows is usually a fairly reliable signal of a bottom. This reliability in the past means this divergence should be given reasonable weight in this analysis.
DAILY CHART
Click chart to enlarge. Chart courtesy of StockCharts.com.
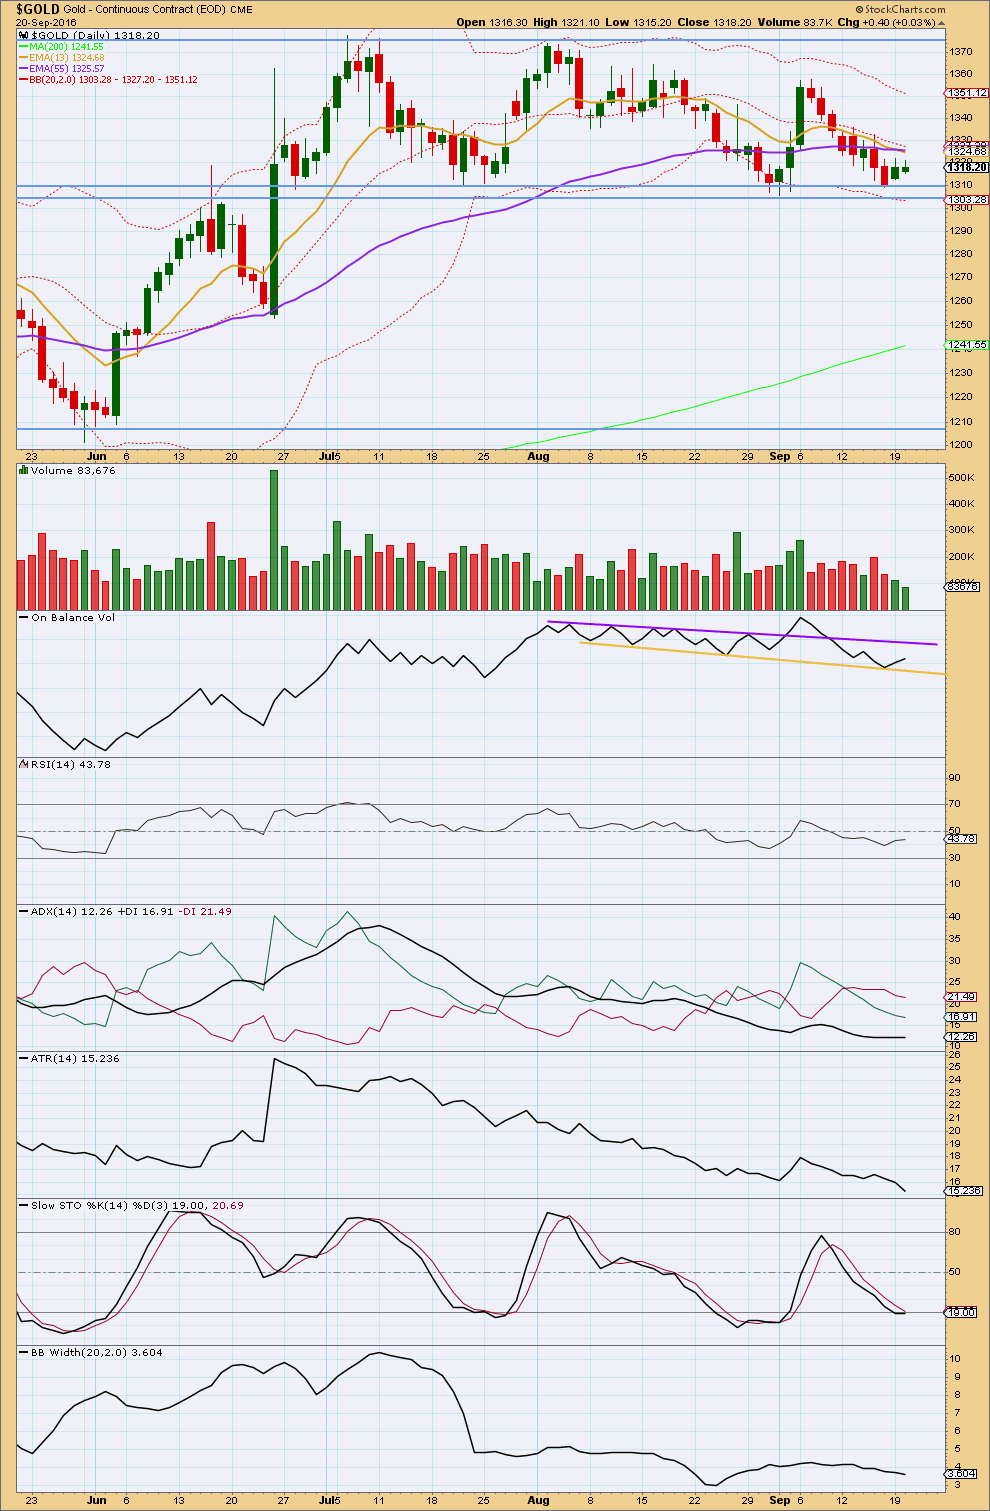
Two small range upwards days in a row come with light and declining volume. The rise in price was not supported by volume. This suggests Gold may yet move lower before this downwards swing is over. Final support is still likely to be about 1,305.
The mid term volume profile is still more bullish than bearish. The last rise in price up to 6th September came on strong and increasing volume and the following fall in price has come on much lighter and declining volume. Gold remains within a consolidation, with resistance about 1,375 and support about 1,305. During this consolidation, it remains three upwards days which have strongest volume and this suggests an upwards breakout is more likely than downwards. This trick usually works well for Gold.
On Balance Volume gave a bullish signal with a move up and away from support at the yellow line. The purple line may provide resistance, but this is some distance away and it allows for a reasonable rise in price before it is reached.
RSI is still close to neutral. There is plenty of room for price to rise or fall.
ADX is today slightly declining, indicating this market is not currently trending. ATR agrees; it too is declining. Bollinger Bands remain tightly contracted. With all three indicators in agreement, it is reasonable to conclude the market is not currently trending.
Stochastics is close to oversold. There is a little room here for it to move lower, so this indicates there is room also for price to move a little lower before this downwards swing is over.
This analysis is published @ 8:22 p.m. EST.
Hi Lara – First of all…. a marriage proposal… on bended knee of course 😉
Thank you for your consistent and frequent updates as we all felt the heat of so many down days (7 of 9). You’ve certainly provided members with your very best efforts and shared thoughts before the end of each trading day (extra value for sure).
Regarding the blog quietness, I believe we also owe a thank you to some of the key members that make significant blogging contributions: Richard, Dreamer, and Alan. These are the guys that stir the pot during the day and provide us with terrific insight. I hit my refresh button way too often seeking their input/ comments.
In no way am I disrespecting others that make contributions but instead, just giving a shout out to those that have made a difference for ME.
This is one of the first trades that I’ve actually made a gain. However, it took nerves of steel to hold my position knowing that Fed decisions can drive gold; BOJ and US Fed. Today, we win, and I’m very grateful.
Best Regards,
– Steve
Steve, congrats on your trade (so far). It should be a great one. Learning from others is what it is all about. Thanks for the shout out!
Stephen.
My heartiest congratulations on your winning trade.
One of the reasons why we post is to be able to share our knowledge and insights. If we can profit together, that will be the ideal situation.
I do not claim to be always right. As long as my winners outweigh the losers, I’ll be happy. It always make me glad when someone can gain from the market based on what all of us post. It makes it worthwhile to take the effort to pen all these.
An updated wave count will be helpfull here.
Lara might be having her coffee. Where is Alan 🙂
Good morning, it’s 6:40am, I’m only just up now.
Updated first / main hourly chart. It looks like this nice push up was a third wave, as expected, and now a small fourth wave may be completing.
Minuette (iv) should be over within a few hours, then minuette (v) up should continue this trend.
When minute i is done, in another day or so, then another deep and possibly time consuming second wave for minute ii should unfold.
More confidence may be had today that the upwards trend remains. I also have confidence in the final risk / invalidation point at 1,302.93.
When I’ve gone through the process of completing the analysis this invalidation point will probably be moved up. The alternate hourly chart may be discarded.
Thank you lara
Lara beat me to it.
I agree with her count, that’s what I had.
I was also thinking of another possibility. What if the high reached today, labelled minuette 3, was actually only subminuette 1? This is because the third waves could be strong in this uptrend. The minus factor would be that we start slow and slowly build up more momentum.
Now we can say that hourly count is in play.No rate hike and ther will be no hike now unless untill gold reaches 1580$ 🙂
And we will celebrate that here on this superb blog 🙂
SENTIMENT: Difficult to say which way this will go. FED decision of no change in interest rate may likely result in short covering rally. Keeping it short nonetheless with upside risk 1346-47 or possibly a stop lower down at 38.2% retrace of H 1352 / L 1302 at 1333/50dma with downside target a break below pivot / 1313-12 (50% retrace H 1374 / L 1250). Lets see how this goes. Dont mind getting stomped out lol. IMO Gold price remains bearish; hourly and 4-hourly RSI are a little overheated. GL all!
Gold inching higher.
Lara primary hourly wave count:”A little more confidence may now be had with a breach of the upper edge of the best fit channel (in pink). Further confidence may be had in a trend change if price makes a new high above 1,326.11.”
Gold sentiment is apparent from lack of interest on this blog?????
What is the sentiment???
Papudi
Sometimes News release and Events dominates technical chart and wave counts..this week had started with such kind of atmosphere. All knows that any negative news has the power to create a new alternate count. That is what is happening right now. Silence is gud sometimes
🙂
When price is correcting and I get the turn wrong, people lose paitence and leave.
The membership is still very healthy, but I suspect a few people were seriously doubting if I knew what I was doing.
And they may still be doubting today.
Trading markets requires patience. I suspect many of the personalities drawn to it do not have the required patience.
At least, that’s my 2 cents worth after years of interacting with many traders.
Lara. You have my backing and complete trust.
I would suggest that those people who are quick to blame others try their hand at counting waves themselves.
I do a count as the market progresses, and yet I’m wrong a lot of times. There are just too many possibilities at every juncture. In your case, it would be worse. Your count is almost half a day away from the US market opening, and much will have transpired during the Asian and European hours.
If we can be correct all the time, we’ll amass a 6-figure profit every day and very soon be as wealthy as Warren Buffett. And retire to a nice secluded island, enjoying life.
You should always enjoy life Alan! Even when you’re stuck on your not very secluded island of Singapore and down in a trade.
I don’t think there is a lack of interest, I believe people are gun-shy of taking a position on Fed day. I know I’ve been wrong more than right.