
Downwards movement to about 1,320.71 was expected for Wednesday’s session.
Price moved lower to reach 1,318.02 for the session.
Summary: Upwards movement is now expected and should show an increase in momentum and strong volume over the coming weeks. Corrections may now start to be more brief and shallow. A short term target is first at 1,378, and second at 1,414. A mid term target is at 1,437. The long term target remains the same at 1,585.
New updates to this analysis are in bold.
Last weekly charts are here.
Grand SuperCycle analysis is here.
DAILY ELLIOTT WAVE COUNT
Click chart to enlarge.
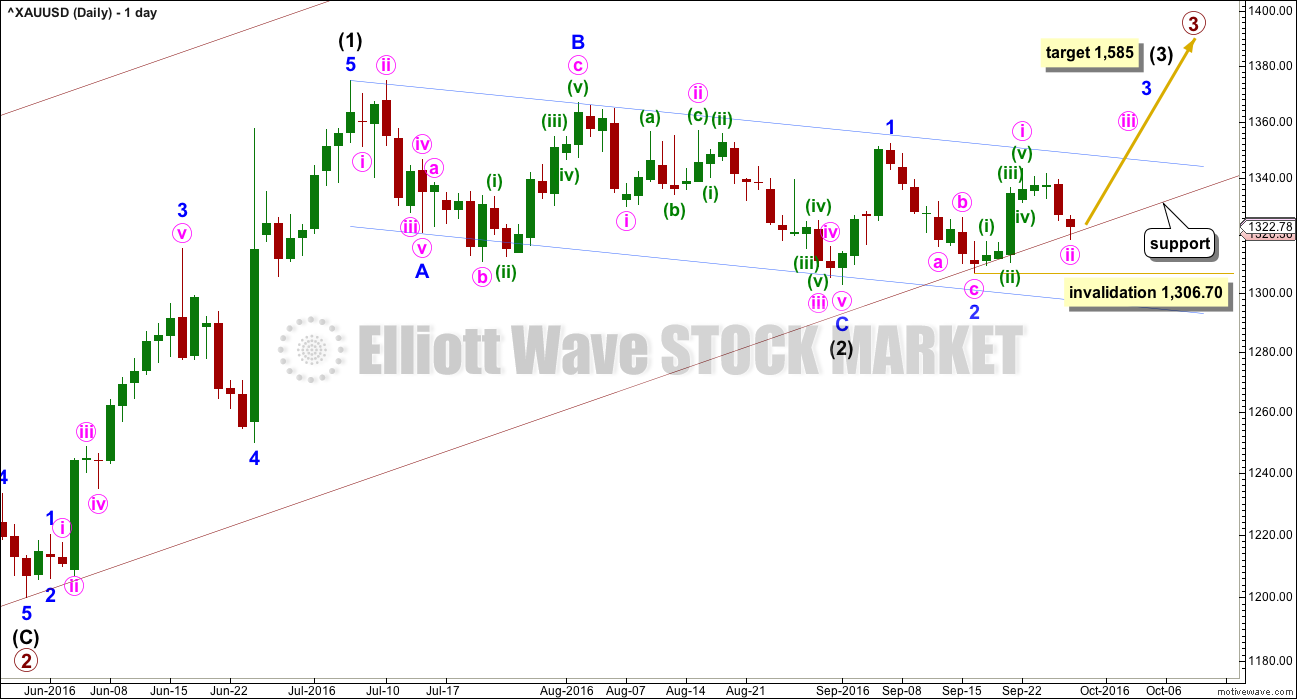
Primary waves 1 and 2 are complete. Thereafter, this wave count differs from the alternate.
This main wave count will expect primary wave 3 to be longer than primary wave 1. Because this is very common, this is the main wave count. The most common scenario is most likely. At 1,585 intermediate wave (3) would reach 1.618 the length of intermediate wave (1).
Intermediate wave (2) may now be complete ending just below the 0.382 Fibonacci ratio of intermediate wave (1) and lasting 40 days.
A multi day pullback for minute wave ii is most likely now complete; it should find very strong support here at the lower edge of the maroon channel. Minute wave ii may not move beyond the start of minute wave i below 1,306.70.
Draw a channel about intermediate wave (2) using Elliott’s technique for a correction (blue lines). Price is finding some resistance on the way up about the upper edge. After breaking through resistance at the upper blue line price may then turn down to find support about there.
With this wave count expecting a third wave at two large degrees to begin, look out for surprises to the upside at this stage.
Intermediate wave (1) lasted 27 days and intermediate wave (2) lasted 40 days. Intermediate wave (3) may be reasonably expected to last longer than intermediate wave (1) in both time and price. A Fibonacci 55 days would be a first expectation. Intermediate wave (3) may end with a blowoff top.
The lower edge of the maroon base channel has proven to be providing strong support. Copy this over from weekly charts: draw a base channel from the start of a first wave to end end of the second wave, then place a parallel copy on the end of the first wave. In this case, the lower edge of the base channel is providing support. If price again comes down to touch it for another pullback, then it would provide an opportunity to join the trend at a very good price. Risk to long positions is at 1,306.70. Always use a stop loss for all trades, and do not invest more than 3-5% of equity on any one trade.
HOURLY ELLIOTT WAVE COUNT
Click chart to enlarge.
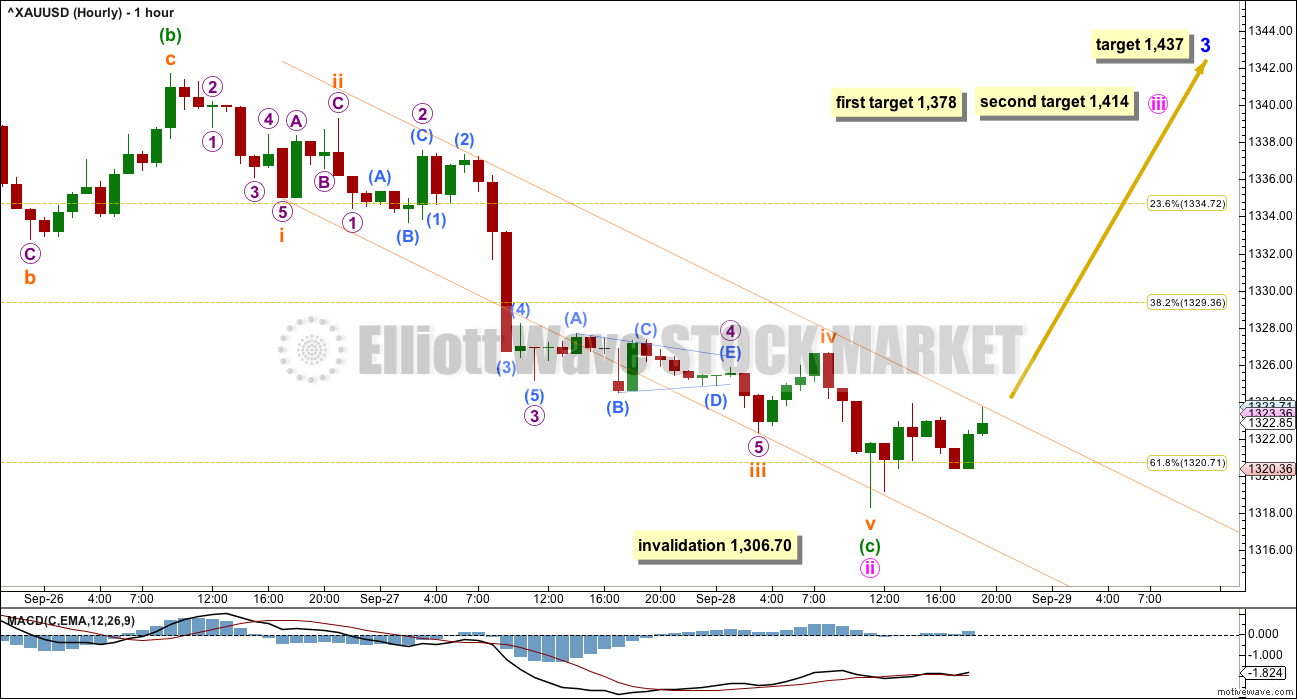
At 1,437 minor wave 3 would reach 2.618 the length of minor wave 1.
Minor wave 3 may only subdivide as an impulse. Within Minor wave 3, minute waves i and now ii both look complete.
The orange channel is a best fit about minuette wave (c). So far price is finding resistance about the upper edge. If price can break above this trend line with clear upwards movement (not sideways), that shall provide a reasonable indication that a low is likely to be in place.
A new high above the start of subminuette wave v at 1,326.67 could not be a second wave correction within subminuette wave v, so at that stage subminuette wave v would have to be over. This would provide some price confidence in a trend change.
Risk must remain at 1,306.70 while price remains within the channel. If minute wave ii continues any lower, it may not move beyond the start of minute wave i below 1,306.70.
If minute wave iii has begun today, then at 1,378 it would reach 1.618 the length of minute wave i. If price gets to the first target and just keeps going up, or if when it gets there the structure is incomplete, then the second target would be used. At 1,414 minute wave iii would reach 2.618 the length of minute wave i.
Minute wave ii shows up clearly on the daily chart lasting four days. Minute wave iv may be more brief and very shallow; if minute wave v is a swift strong extension, it may force minute wave iv to be brief enough to not show up on the daily chart.
ALTERNATE DAILY ELLIOTT WAVE COUNT
Click chart to enlarge.
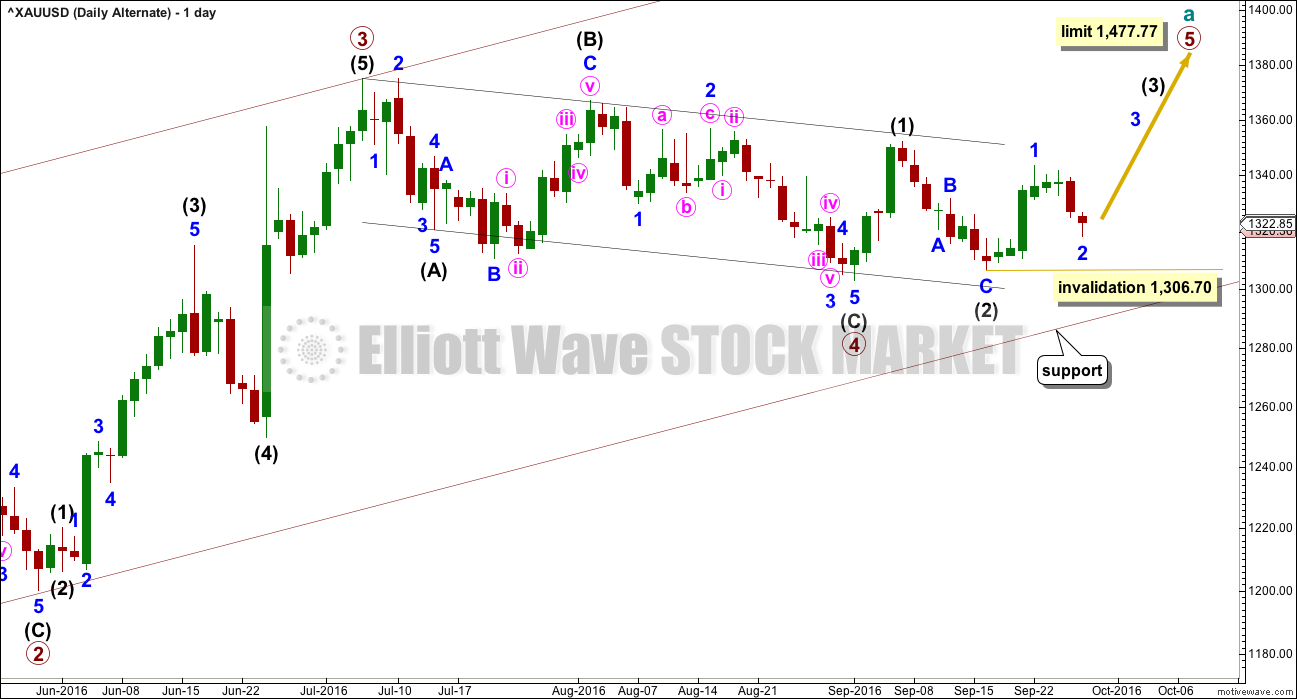
It is possible that primary wave 3 is over and shorter than primary wave 1. Primary wave 3 shows stronger volume than primary wave 1 (see technical analysis weekly chart).
If primary wave 3 is over, then the current consolidation for Gold would be primary wave 4.
Primary wave 2 was a relatively shallow 0.35 expanded flat correction. Primary wave 4 may be a deeper zigzag which would exhibit perfect alternation.
Within primary wave 5, minor wave 2 may move beyond the start of minor wave 1 below 1,306.70.
Primary wave 5 would be limited to no longer than equality in length with primary wave 3, so that the core Elliott wave rule stating a third wave may not be the shortest is met. Primary wave 5 would have a limit at 1,477.77.
The hourly chart would be exactly the same.
TECHNICAL ANALYSIS
WEEKLY CHART
Click chart to enlarge. Chart courtesy of StockCharts.com.
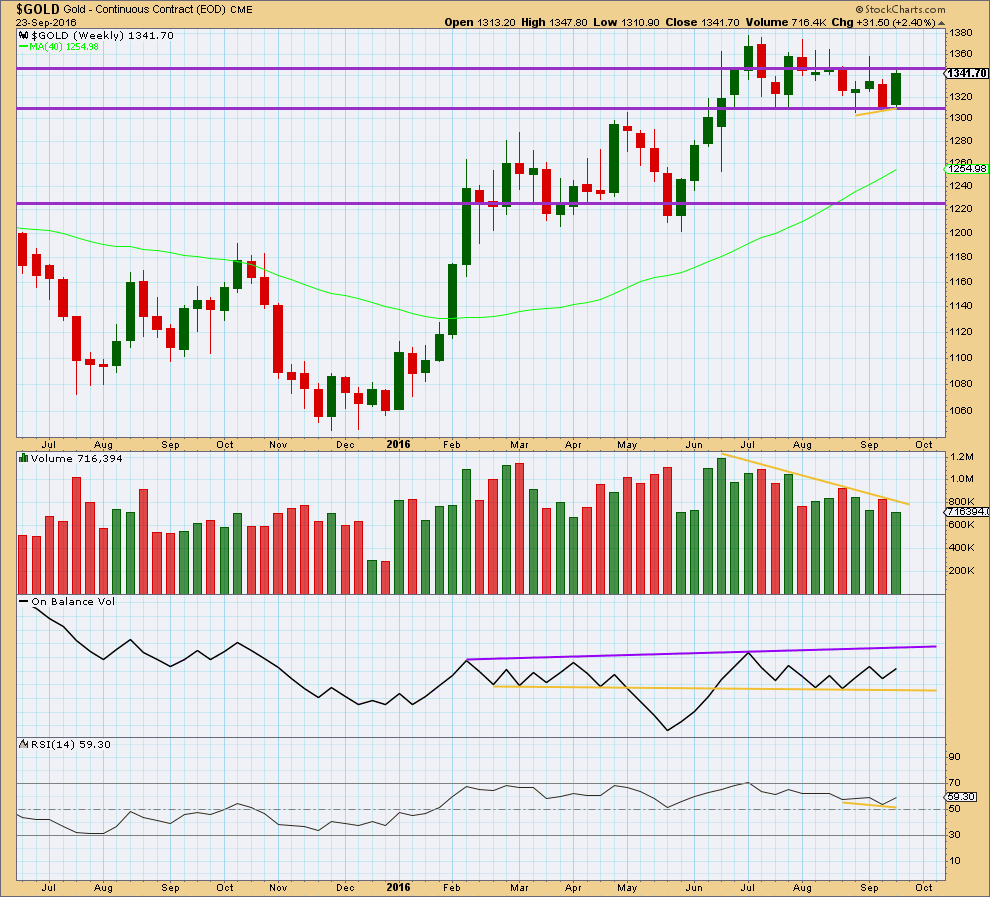
Last week completes a bullish engulfing candlestick pattern, but it is not supported by volume. To see more clearly what is happening for volume last week we’ll look at daily volume.
Price may find some resistance about 1,345.
On Balance Volume is still bullish at the weekly chart level.
At the weekly chart level, RSI is still not extreme. There is room for price to rise or fall. There is no divergence between price and RSI to indicate weakness.
DAILY CHART
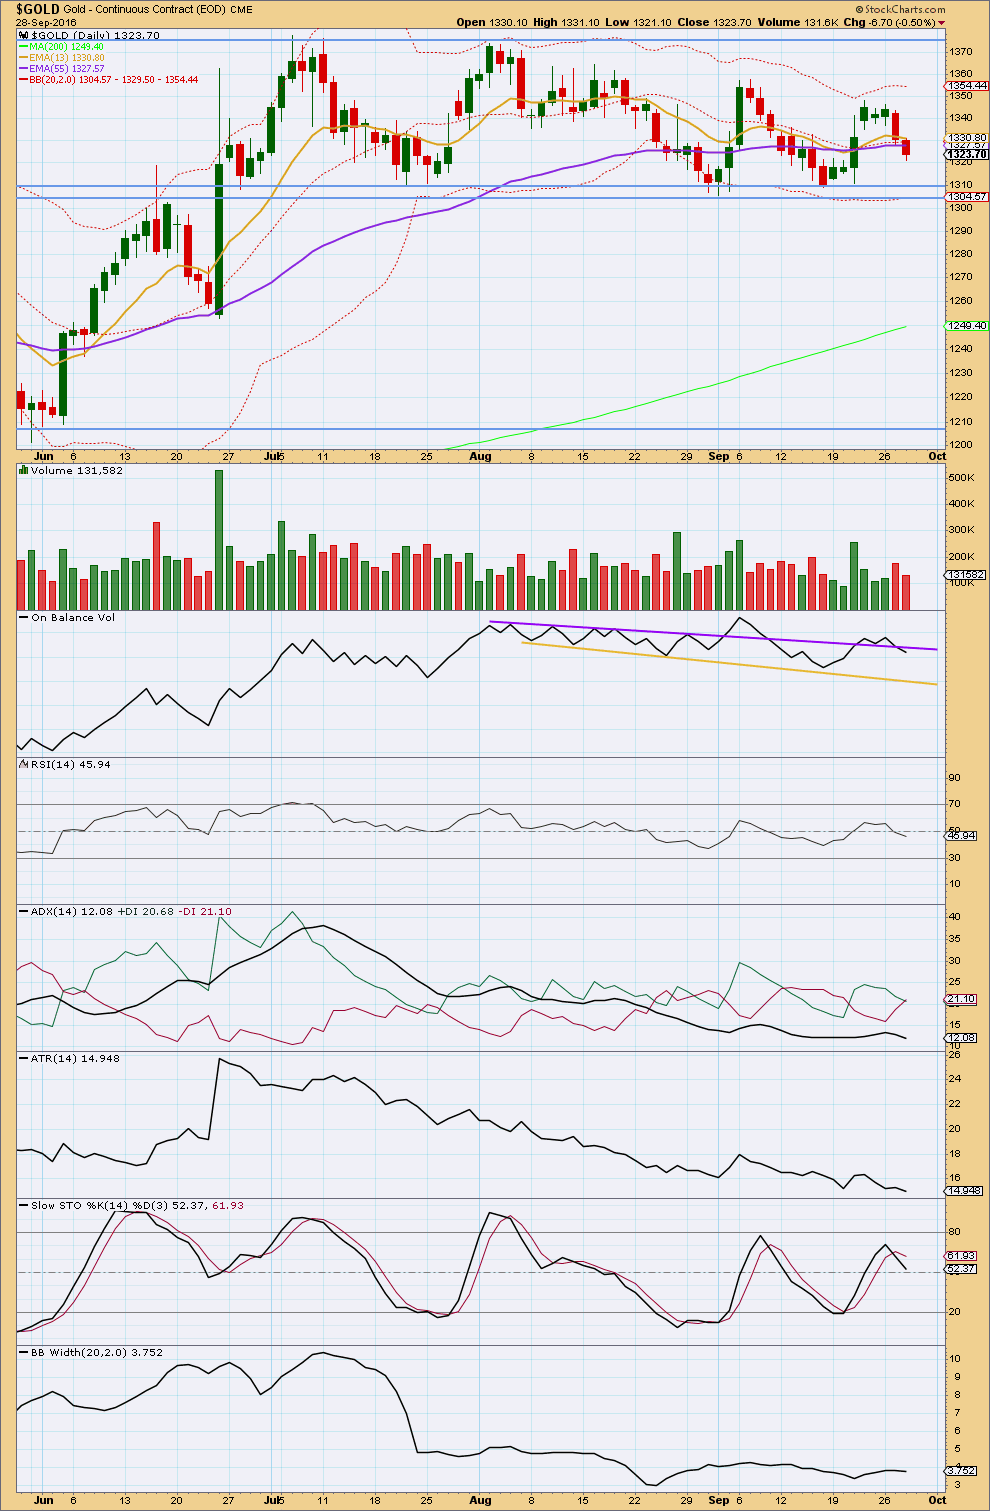
Click chart to enlarge. Chart courtesy of StockCharts.com.
Gold remains range bound with resistance about 1,375 and support about 1,310 – 1,305. During this consolidation, it is four upwards days that have strongest volume suggesting an upwards breakout is more likely than downwards.
Volume for Wednesday’s session is lighter than the prior downwards day. The fall in price is not supported by volume (the bears are tiring). This indicates the next session is most likely to complete a green daily candlestick. This supports the Elliott wave count.
On Balance Volume has broken slightly below the purple trend line, which did not provide support. This is a reasonable bearish signal. This does not support the Elliott wave count. However, the break is small.
RSI is close to neutral. There is room for price to rise, or fall. There is no divergence today between price and RSI to indicate weakness.
ADX is today declining. It is not yet indicating a new upwards trend. The market is still consolidating.
ATR is still overall flat to declining, in agreement with ADX.
Stochastics is nearing overbought but is not quite there yet. A few more days of overall upwards movement may bring it closer, then this upwards swing may be ready to end. Price may find resistance at another point within the consolidation, about 1,355 where the last small upwards swing ended.
Bollinger Bands remain tightly contracted. This market may not yet be trending.
The longer term trend remains up. The 200 day moving average is still pointing up and price is above it. The mid term Fibonacci 55 day moving average is still pointing up and is above the longer term average. The short term Fibonacci 13 day moving average is now moving up from the mid term average, and the short term trend is also up (within the larger consolidation).
This analysis is published @ 08:52 p.m. EST.
Should be a catalyst for something big. I’m amazed at the near silence from mainstream media on DB, and the lack of reaction from the US markets.
DB is crashing. That’s huge!
But then… it’s wave count is different. So… there’s that.
I was waiting for this bank to crash from spring. Now we might see news again from Greece than other friends like Spain Portugal and so on.
This analyst on DB is saying straight that politician’s have been telling lies for last 8 years…wow.
http://www.cnbc.com/2016/09/29/pressure-seen-building-for-germany-to-rescue-deutsche-bank.html
A slight new low adjusts the wave count at the hourly chart level.
For Gold this has to be it. It’s overshot the maroon trend line. That’s okay, so far. That line has been slightly overshot before. But it should not be breached.
Silver is respecting it’s trend line. It has a higher low today.
The orange channel is redrawn using Elliott’s second technique. Price has breached it and is now backtesting for support.
If this holds and price now moves up and away that would add a little confidence.
If that happens and today closes with a hammer candlestick that too would add confidence.
If today has a red candlestick with lighter volume that also would add confidence.
What would reduce confidence would be a proper breach of the maroon trend line on the daily chart tomorrow, and strong volume for a down day today.
Lets see how the session closes and what volume is like.
Small bullish sign today. Gold made new lows and miners did not, so far anyway.
Dreamer, Love the charts presented. Especially @ 10:38 & 10:44. Great snapshots you’ve shared here. Puts things in right perspective. Thank you.
Getting stopped out of entries means the one that’ll stick is right around the corner. 🙂
Thanks, glad you found them useful. Good to see your post. You’ve been MIA for awhile. ?
:). So nice you noticed. You can call off the search party now, I’ll be around. I was able to atleast check in and see all the wonderful posts; making me jealous of everone’s ability to spend time here of course. PS- Where’d you get them shades? ?
Lara: “The orange channel is a best fit about minuette wave (c). So far price is finding resistance about the upper edge. If price can break above this trend line with clear upwards movement (not sideways), that shall provide a reasonable indication that a low is likely to be in place.”
Gold has clear upward momentum breaking the orange trend line.
Lara is spot on. Thanks.
Papudi it looks like the 5th wave down you were looking for yesterday may of ended this morning at 8:32 am low of 1315.74
So Lara will revise the hourly wave count this evening. Nice setup for up move now.
Does anybody see a clear 5-wave structure from the low of 1318.30 to the high of 1325.50? From BarChart, I can only see 3 waves. If I force it a little there is a 5-wave leading diagonal. From TradingView chart, there is a distinct 5-wave.
My contention is that if this is a 3-wave structure, then the fifth wave is not done yet. It had morphed into a WXY combination. On top of that the drop from 1325.50 looks suspiciously like a 5.
If my concern is correct, then I’m afraid we have yet to see a new low! Let’s hope it isn’t.
I agree. I felt yesterday on 5 minute chart that the move off the lows had a 3 wave look.
Unfortunately, I’m right. Minute 2 is a 5-3-5 combination.
Hi Alan,
Do you, by chance, have your own site where members can subscribe? Hahahahaha
Of course, I’m only having some fun here as we all know that Lara is the best in the business.
So do you think the low is already in at 1315 and change or do you see gold going lower. Currently, it’s looking as if it wants to test the low again with a 1321 to 1318 drop in a short amount of time.
Minute 3 begins tomorrow, maybe?
The new low may of happened at 8:32 am at 1315.74 on barchart.com
Richard. Are we looking at the same graph? The (previous) low on mine (GCY00) was at 1316.60 at all time frames.
Alan, I think Lara uses XAUUSD on Barchart
Haha. Stephen, love your joke. It brightens up the gloomy atmosphere that the bulls are facing now.
I think you are right. The low is not in yet. There should be one left, unless there is a truncation. The current drop is now the last wave. Looking at the price, it has dropped below 0.618 of Minute 1. The next target is 0.786, at 1314.55. (Incidentally, I noticed that second waves are somehow now addicted to a Fib ratio higher than 0.618. This has happened consecutively for 2 to 3 weeks already). Hopefully, there is no extension of the drop, otherwise the bulls will go on a stampede.
Went marginally lower to 1316.30 at 10:10 am.
Thanks Alan and also Richard for your responses.
Glad you enjoyed the humor because I was chuckling too. Sounds like we’re almost there and the price action for GDX and NUGT is showing support even when gold continues to drift lower which helps the mood of the bulls.
I do like the look of the bullish reversal candlestick action as gold came back down to touch 1315 and change one more time. Let’s hope it’s signaling a truncation this time. I do appreciate your thoughts so that we’re able to watch and track possible expectations.
Oh yeah… when everyone is thinking that they’ve had a bad day, picture yourself being Stumpf from Wells Fargo being grilled by Congress.
I’m not an expert like you guys in wave theory and starting to learn. But generally looking at the trend I think it has still some possibility of downside. May be today. Do you guys agree? I don’t want to get into a trade unless price shows the direction.
Showing some WEEKLY technical indicators as they seem to more clearly support a continued move up more at this time than the daily:
> RSI remains above 50 (bullish)
>The highest VOLUME weeks since January are on up weeks (bullish)
> OBV has held support, although it remains within a consolidation zone
On the GDX hourly count, even though Gold was down today, GDX bounced at the triangle support line and moved up. It appears that Minute 2 is over. For the main bull count, GDX should breakout from the triangle upwards within the next week. A break below the lower triangle support would be bearish and likely mean that GDX goes down and fills the gap around 22.
Even though I have some concern about GDX breaking it’s uptrend line, the main GDX count is still up.
So we still have gold, miners, USD, Oil, and stocks still coiling. Even oil’s advance for a big up day was stopped at it’s upper “triangle” down trend line.
Still watching for breakouts.
Lara I’m inquiring if this is a typo and 1,467 should be 1,437?
You mention in the summary.
“A mid term target is at 1,467.”
However that is not on any chart.
You mention under the hourly chart.
“At 1,437 minor wave 3 would reach 2.618 the length of minor wave 1.”
Sorry Richard, yes, it’s a typo.
Should read 1,437.
And it should be on the hourly chart, the target for minor wave 3.
Thanks, will fix now.