
A short term move lower to 1,311 – 1,312 was expected before more upwards movement.
Price has moved higher.
Summary: Look out now for surprises to the upside. A small sideways correction may unfold remaining above 1,327.30. The target for the Elliott wave count for a third wave to end is at 1,585.
New updates to this analysis are in bold.
Last weekly charts are here.
Grand SuperCycle analysis is here.
DAILY ELLIOTT WAVE COUNT
Click chart to enlarge.
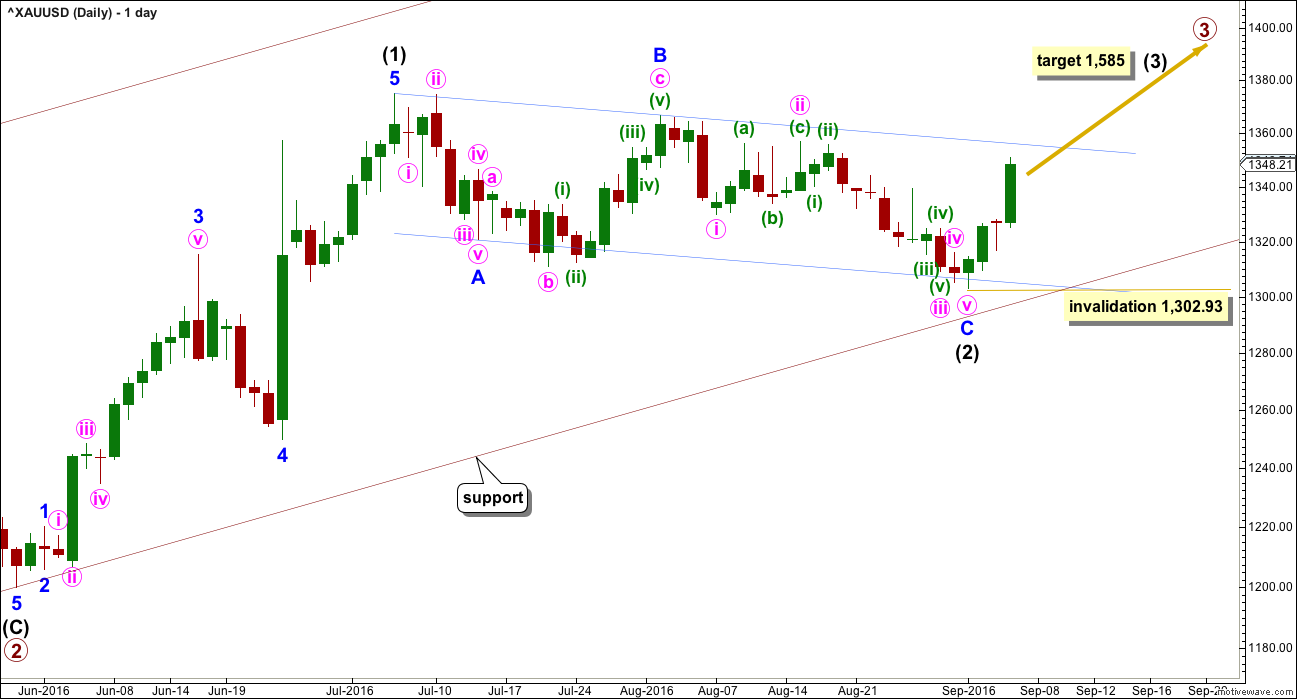
Primary waves 1 and 2 are complete. Thereafter, this wave count differs from the two alternates.
This main wave count will expect primary wave 3 to be longer than primary wave 1. Because this is very common, this is the main wave count. It expects the most common scenario is most likely. At 1,585 intermediate wave (3) would reach 1.618 the length of intermediate wave (1).
Intermediate wave (2) may now be complete ending just below the 0.382 Fibonacci ratio of intermediate wave (1) and lasting 40 days. Within intermediate wave (3), the upcoming correction for minor wave 2 may not move beyond the start of minor wave 1 below 1,302.93.
Draw a channel about intermediate wave (2) using Elliott’s technique for a correction (blue lines). Price may find some resistance on the way up about the upper edge.
With this wave count expecting a third wave at two large degrees to begin, look out for surprises to the upside at this stage.
Intermediate wave (1) lasted 27 days and intermediate wave (2) lasted 40 days. Intermediate wave (3) may be reasonably expected to last longer than intermediate wave (1) in both time and price. A Fibonacci 55 days would be a first expectation.
HOURLY ELLIOTT WAVE COUNT
Click chart to enlarge.
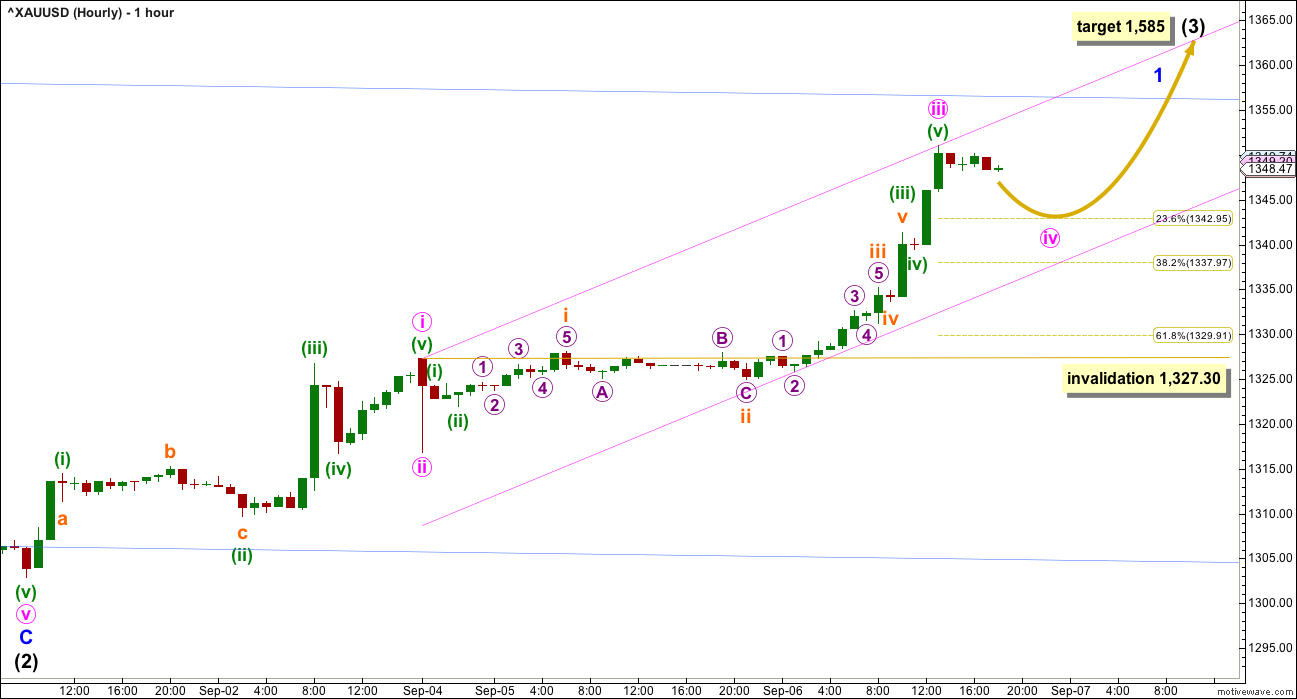
So far for BarChart data minute waves i, ii and now iii may be complete. Minute wave iii shows an increase in momentum and volume beyond that seen for minute wave i.
Minute wave iv may end within the price territory of the fourth wave of one lesser degree. Minuette wave (iv) has its range from 1341.40 to 1,339.50. If this expectation is wrong, it may be too low.
Minute wave ii was a quick relatively shallow zigzag at 0.43 the depth of minute wave i. Minute wave iv may be more shallow, the 0.236 Fibonacci ratio would be a reasonable expectation about 1,343. Minute wave iv is most likely to be a sideways type of structure: a combination, flat or triangle. It may not move into minute wave i price territory below 1,327.30.
When minute wave iv is complete, then a target may be calculated for minute wave v upwards to end. That cannot be done yet as it is not known where it begins.
When minute waves iv and v are complete, then an impulse for minor wave 1 would be complete. Minor wave 2 should follow and should last at least one day. At that stage, the invalidation point would move down to where it is on the daily chart at 1,302.93.
ALTERNATE DAILY ELLIOTT WAVE COUNT
Click chart to enlarge.
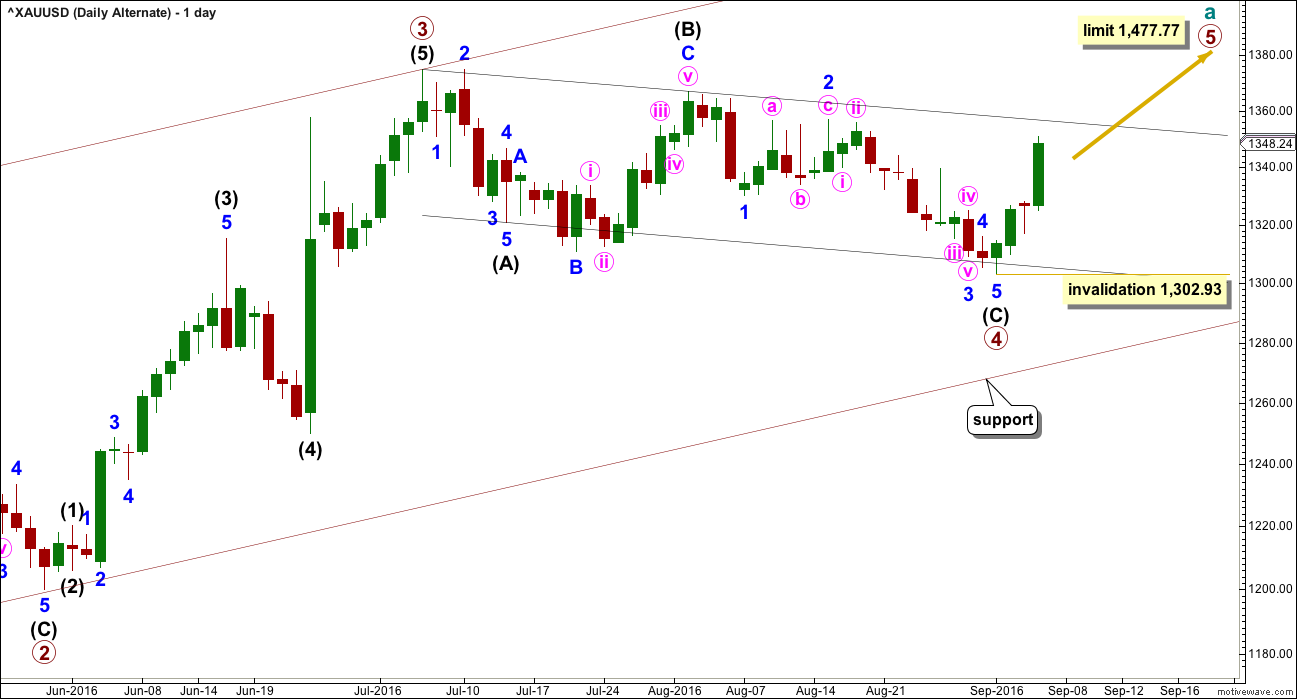
It is possible that primary wave 3 is over and shorter than primary wave 1. Primary wave 3 shows stronger volume than primary wave 1 (see technical analysis weekly chart).
If primary wave 3 is over, then the current consolidation for Gold would be primary wave 4.
Primary wave 2 was a relatively shallow 0.35 expanded flat correction. Primary wave 4 may be unfolding as a deeper zigzag which would exhibit perfect alternation.
Within primary wave 5, no second wave correction may move beyond the start of its first wave below 1,302.93.
Primary wave 5 would be limited to no longer than equality in length with primary wave 3, so that the core Elliott wave rule stating a third wave may not be the shortest is met. Primary wave 5 would have a limit at 1,477.77.
The hourly chart would be exactly the same except for the degree of labelling.
TECHNICAL ANALYSIS
WEEKLY CHART
Click chart to enlarge. Chart courtesy of StockCharts.com.
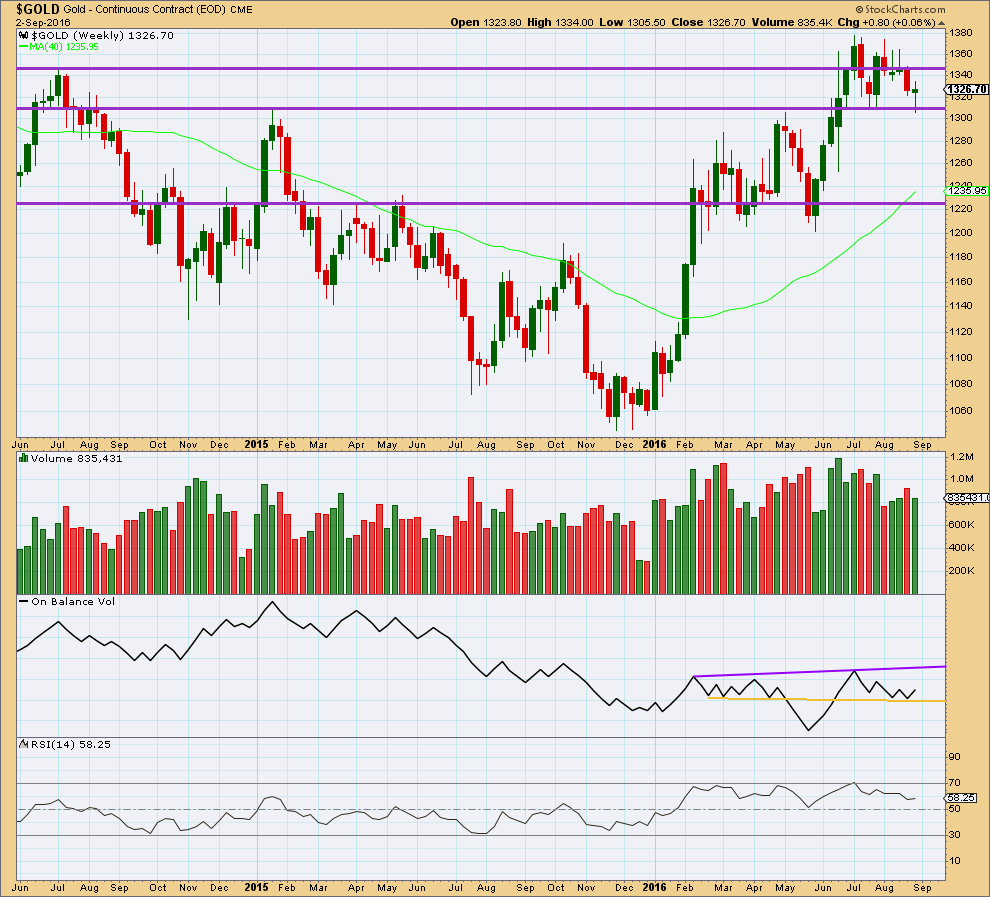
Last week made an important new low, slightly below the prior swing low of 18th of July. Price thereafter bounced up strongly from support about 1,310 – 1,305. Last weekly candlestick comes with lighter volume than the week prior.
To see what is happening here we need to look inside last week at daily volume.
The long lower wick of last weekly candlestick is bullish.
On Balance Volume is giving a bullish signal last week as it found support at the yellow trend line and has moved up and away from that line. OBV may find some resistance at the purple line.
RSI is not extreme. There is still room for price to fall or rise. There is no divergence between price and RSI at the weekly chart level to indicate weakness.
DAILY CHART
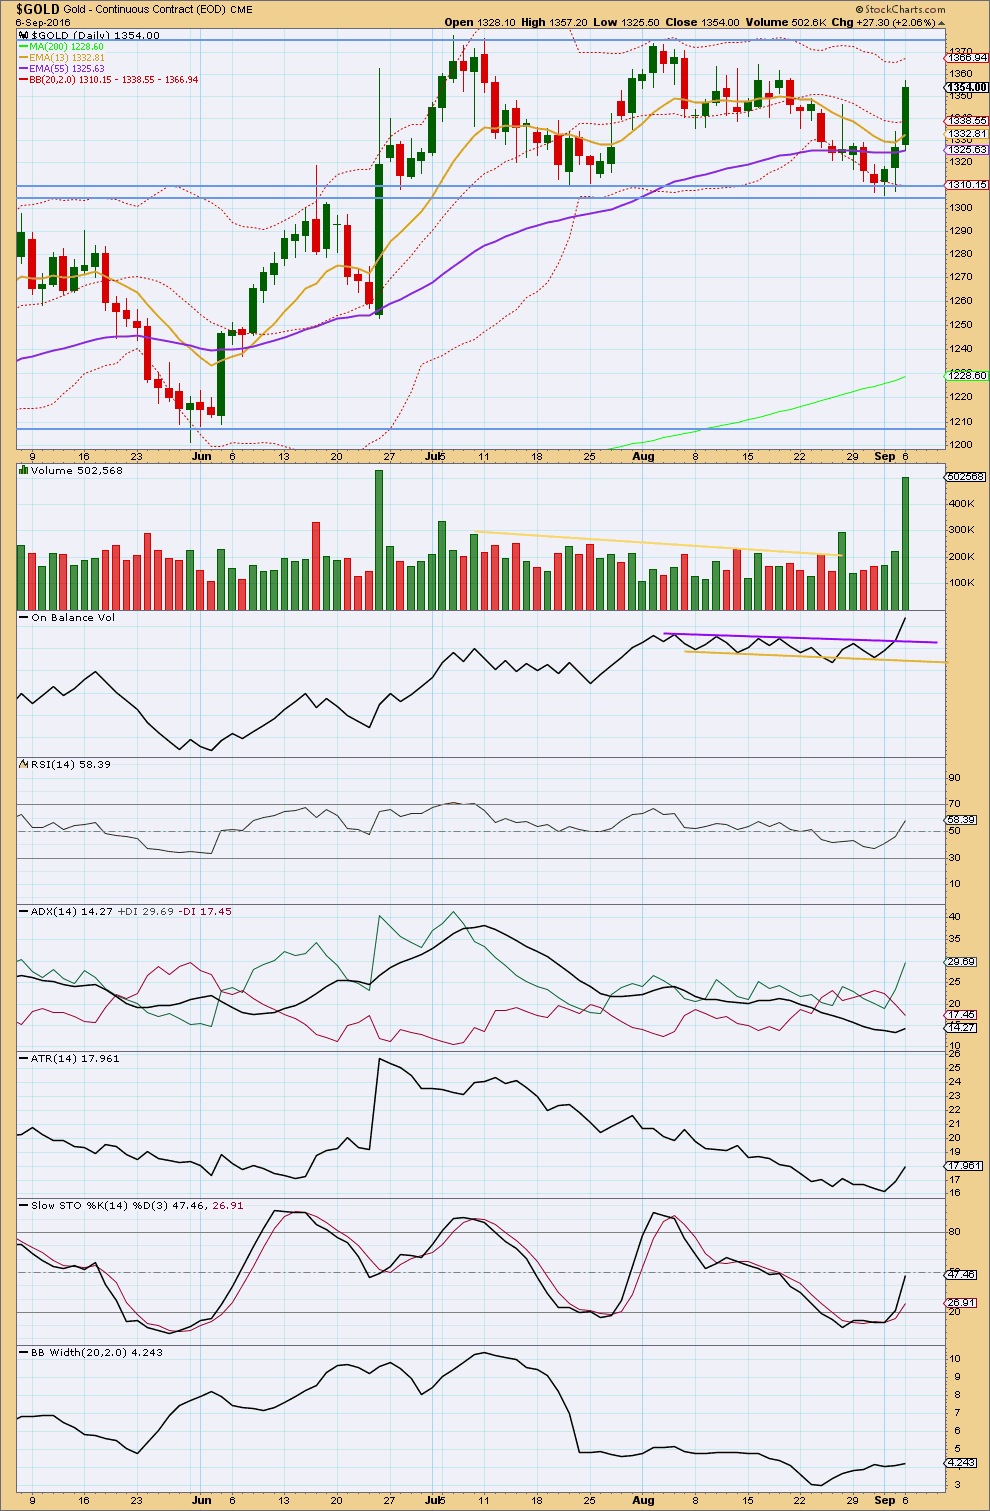
Click chart to enlarge. Chart courtesy of StockCharts.com.
A strong volume spike for 6th of September may yet disappear later today from StockCharts data. For now the volume spike will be read as an increase in volume for a strong upwards day. If StockCharts data is updated, it may not be as strong though.
Price has moved higher on increasing volume for three days in a row. This supports the Elliott wave count.
On Balance Volume is giving a strong bullish signal today with a break above the purple line, which previously provided resistance. This strongly supports the Elliott wave count.
RSI is not extreme. There is room for price to rise. There is no divergence between price and RSI to indicate weakness.
ADX is increasing and the +DX line is above the -DX line. However, ADX is still below 15 and an upwards trend is not yet indicated.
ATR is now more clearly increasing. This indicates a likely trend is returning.
Stochastics is returning from oversold. There is room for price to rise. It should be expected that price will continue higher while Stochastics moves up towards overbought.
Bollinger Bands are showing some increase. Some volatility is returning to the market.
Overall, it looks like a trend is returning and it is upwards. But this is in the very early stages still.
This analysis is published @ 07:33 p.m. EST.
Minute wave iv moving sideways is giving this wave so far a good look in terms of proportion.
The analysis will not change today.
MInute iv is probably not quite over. It may end closer to the 0.382 Fibonacci ratio at 1,338.
Hi Lara, I apologize if this question doesn’t make sense (I’m new to EW), but could the point labeled intermediate (2) in the daily count just be wave A of a larger A-B-C structure for intermediate (2), with lower lows (below 1302.93) coming later this fall? Is there still a valid bearish count that targets 1288 or thereabouts? Thank you, Mark.
The question does make sense and is entirely valid.
Technically yes, that is possible. But there would be two very big problems with the idea of intermediate wave (2) continuing.
Primary wave 2 lasted 56 days. Intermediate wave (2) is over in 40 days with the wave count. If it were to continue further then it would be only about halfway at this stage, and so would be much longer in duration than 56 days at it’s end. The proportion between intermediate wave (2) and primary wave 2 would give the wave count the wrong look.
The second problem is the base channel about primary waves 1 and 2. If intermediate wave (2) were continuing sideways then to end it would have to breach the lower edge of the base channel, probably substantially. Again, that would have the wrong look.
It is much more likely by a substantial margin that intermediate wave (2) is over.
Thank you, Lara. Much appreciated.
Does anyone have a favorite trend indicator that works for them to clarify bottoms of 3 waves big or small or maybe a combination of trend indicators and time frames to assist in day trading NUGT to decode the wild beast’s patterns into clearer Buy and Sell signals of day lows or larger intraday swings?
Richard -I have been using candlesticks (Heiken-Ashi format) combined with trend lines, verified with MACD and/or RSI. Seems to work well so far.
Hi Lara,
In response to your Sept 06, 3:20a.m. post about USdollar analysis, I sent attached response/question to you yesterday. Would you kindly comment on attached….
Thank you
I’m sorry Melanie, I really don’t know how to convert these values. So you will not be able to use this to calculate targets.
It may only be useful in terms of general direction expected.
The USD analysis was provided as a supplement to the Gold analysis, because Gold is valued in USD. It was not provided as a basis for trading USD.
I am limited to the data stream from FXCM because it can be brought into Motive Wave.
Dreamer has helped me with the symbol for USD from BarChart, so I would need now to find that and copy my wave counts over. I haven’t done that yet.
Lara…Thank you for explaining.
When you have time to translate your analysis over to USD per Barchart, I am sure it would be much appreciated by several of us.
When looking at GDX and GLD charts this so far is first red candlestick after 3 consecutive up days plus uptrend lines are broken. Therefore it is a consideration that this could be second wave correction beginning today and there is not a minute 5 to follow. Assessment has been made difficult by different datafeeds..
Amazing how low NUGT dropped to today with a day low at 12:36 pm of $22.68 at 1,343.50 and Tuesday’s low was only 6 cents lower at $22.62 but gold was almost $10 lower at 1,334. It just goes to show how hours of momentum either direction either pumps up or deflates 3X miners ETFs more or less than usual.
I tried to time the bottom with 5 trend indicators but bought 8 minutes early and made a profit.
WEDNESDAY, SEPT. 7
2:00 pm EST US FED. Beige book
Data released Wednesday, however, showed that U.S. job openings jumped in July to an all-time high of 5.87 million. The Fed’s beige book report that collects business feedback from across the central bank’s districts is slated to be released at 2 p.m. Eastern, shortly after gold futures settle for the session.
Is gold now in a C wave of an A-B-C wave down to end minute iv in the 1343 to 1339 area?
I have it as a combination W-X-Y. It is currently in the fifth subwave of subminuette Y, and the first of five subwaves of the fifth.
But, it can also be the third subwave of the fourth, if the fourth is a zigzag.
That was most likely an A-B-C.
I think the combination had just begun, with X wave now in progress. (The A-B-C was the W waves). It seems to be too slow to be the beginning of Minute 5.
Alan thanks for your wave counts.
I noticed that buying the NUGT day lows yesterday at 9:55 am 22.62 and today 12:36 at 22.68 and holding until 3:43 pm today and 3:59 pm yesterday it went up over $2.00. I didn’t do it, wish I had, I’m looking for patterns to try out that might work again and why.