
More downwards movement was expected to 1,333 – 1,330.
Friday’s low was 1,327.67.
Summary: A little downwards movement to a short term target at 1,319 – 1,322 may begin for Monday. Thereafter, price should turn upwards as an upwards trend develops. Range and volatility are then expected to increase. The long term target remains at 1,585. The volume profile remains bullish and supports the Elliott wave count.
New updates to this analysis are in bold.
Last weekly charts are here.
Grand SuperCycle analysis is here.
DAILY ELLIOTT WAVE COUNT
Click chart to enlarge.
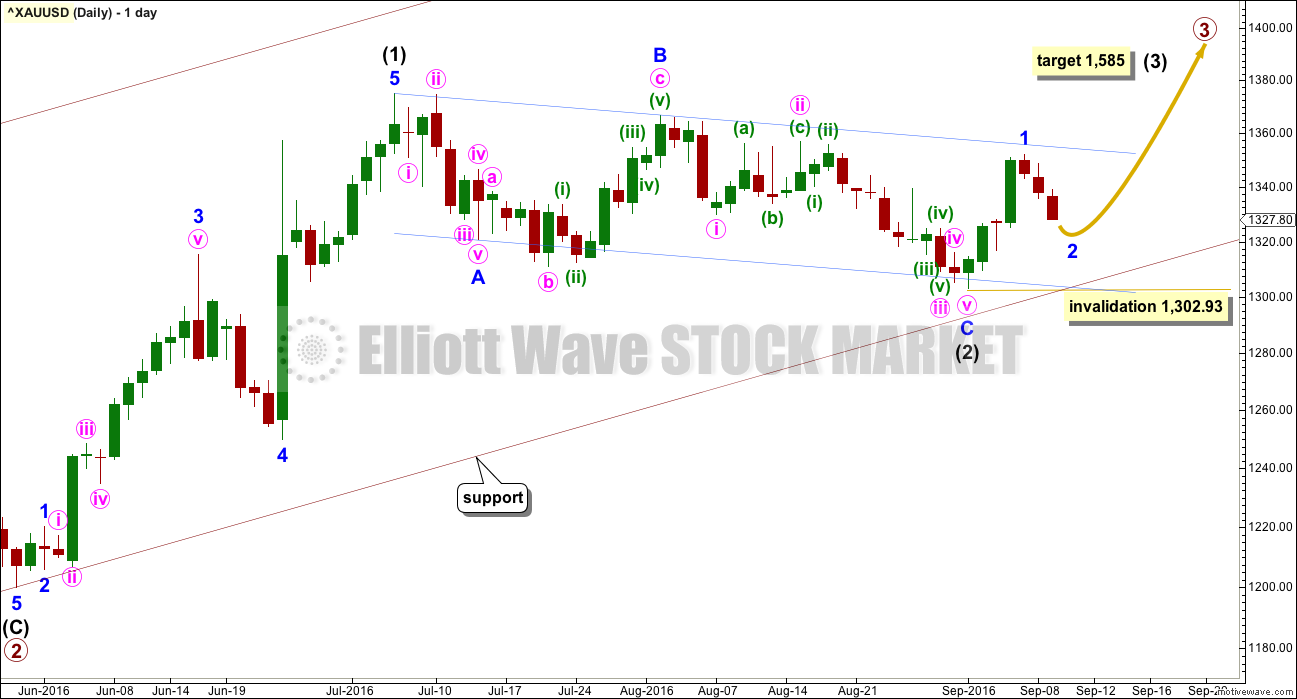
Primary waves 1 and 2 are complete. Thereafter, this wave count differs from the two alternates.
This main wave count will expect primary wave 3 to be longer than primary wave 1. Because this is very common, this is the main wave count. It expects the most common scenario is most likely. At 1,585 intermediate wave (3) would reach 1.618 the length of intermediate wave (1).
Intermediate wave (2) may now be complete ending just below the 0.382 Fibonacci ratio of intermediate wave (1) and lasting 40 days. Within intermediate wave (3), minor wave 2 may not move beyond the start of minor wave 1 below 1,302.93.
Draw a channel about intermediate wave (2) using Elliott’s technique for a correction (blue lines). Price is finding some resistance on the way up about the upper edge. After breaking through resistance at the upper blue line price may then turn down to find support about there.
With this wave count expecting a third wave at two large degrees to begin, look out for surprises to the upside at this stage.
Intermediate wave (1) lasted 27 days and intermediate wave (2) lasted 40 days. Intermediate wave (3) may be reasonably expected to last longer than intermediate wave (1) in both time and price. A Fibonacci 55 days would be a first expectation.
HOURLY ELLIOTT WAVE COUNT
Click chart to enlarge.
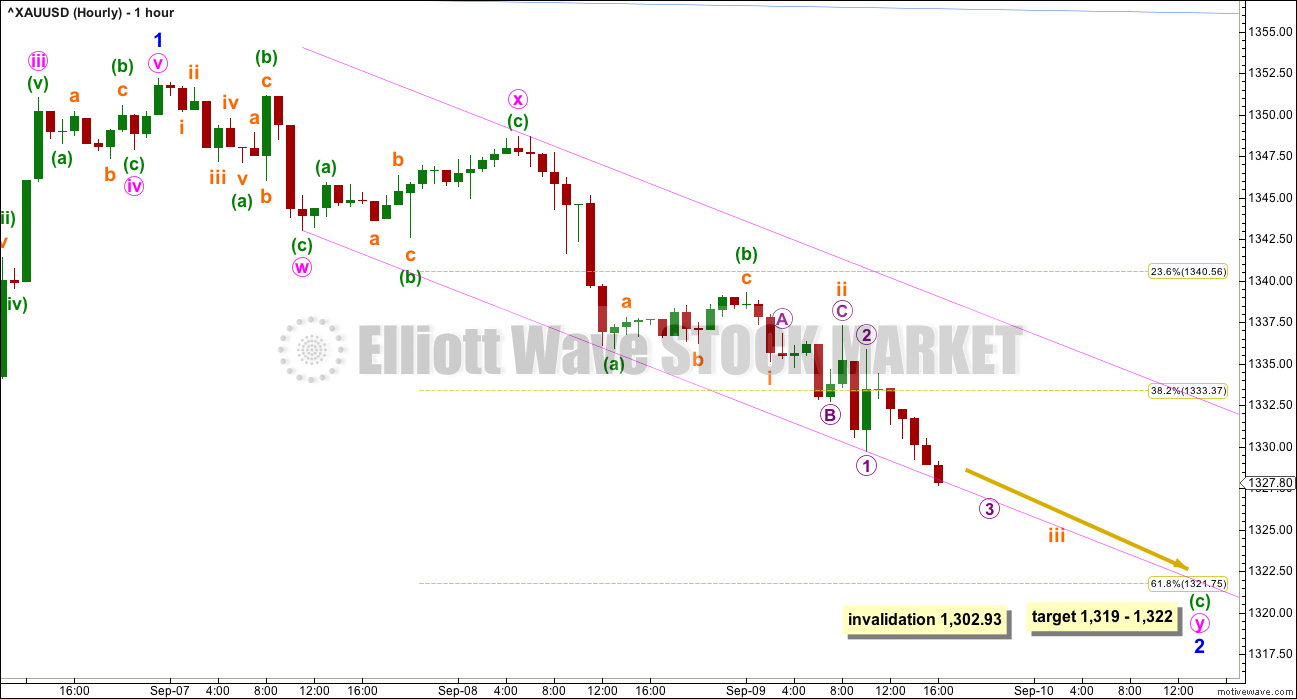
Minor wave 1 was complete and downwards movement is minor wave 2, arriving earlier than expected. The problem with last analysis was in minute wave iv. It will fit perfectly as a completed zigzag, minuette wave (b) within it an expanded flat. This sees minute wave iv having alternation only in depth with minute wave ii, so the structure exhibits no alternation.
Minor wave 2 fits so far as a double zigzag. The first zigzag in the double labelled minute wave w fell short of the 0.236 Fibonacci ratio; it was not deep enough. A second zigzag is deepening the correction.
Within minute wave y, minuette waves (a) and (b) are complete. Minuette wave (c) must complete as a five wave structure. So far it is incomplete.
When the middle of minuette wave (c) is complete then a series of two small fourth wave corrections along the way down should unfold to complete the structure. Minor wave 2 may end close to the 0.618 Fibonacci ratio about 1,322.
At 1,319 minuette wave (c) would reach 1.618 the length of minuette wave (a). This gives a $3 target zone for Monday. If this target is wrong, it may be too low though. The volume profile is quite bullish; bears may be exhausted and may not be able to push price down much further.
The pink channel is a best fit. When it is breached by upwards movement, that shall indicate the correction for minor wave 2 is over and minor wave 3 upwards has then begun.
ALTERNATE DAILY ELLIOTT WAVE COUNT
Click chart to enlarge.
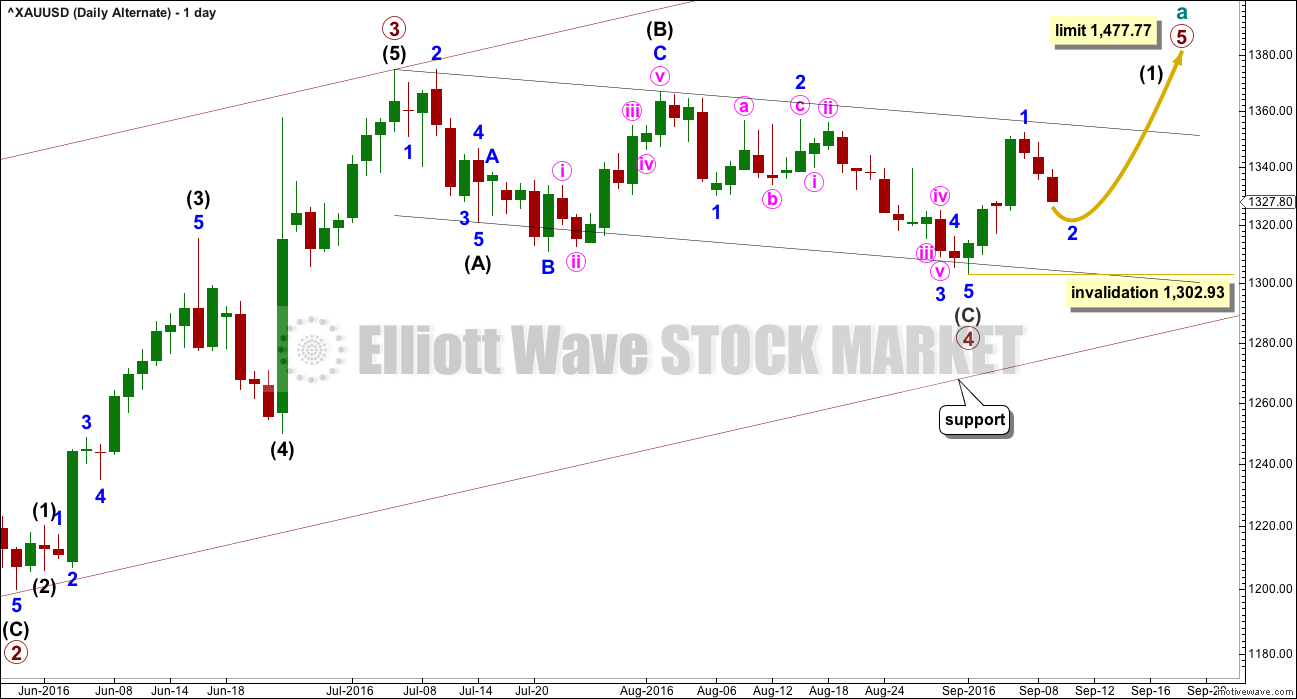
It is possible that primary wave 3 is over and shorter than primary wave 1. Primary wave 3 shows stronger volume than primary wave 1 (see technical analysis weekly chart).
If primary wave 3 is over, then the current consolidation for Gold would be primary wave 4.
Primary wave 2 was a relatively shallow 0.35 expanded flat correction. Primary wave 4 may be a deeper zigzag which would exhibit perfect alternation.
Within primary wave 5, no second wave correction may move beyond the start of its first wave below 1,302.93.
Primary wave 5 would be limited to no longer than equality in length with primary wave 3, so that the core Elliott wave rule stating a third wave may not be the shortest is met. Primary wave 5 would have a limit at 1,477.77.
The hourly chart would be exactly the same.
TECHNICAL ANALYSIS
WEEKLY CHART
Click chart to enlarge. Chart courtesy of StockCharts.com.
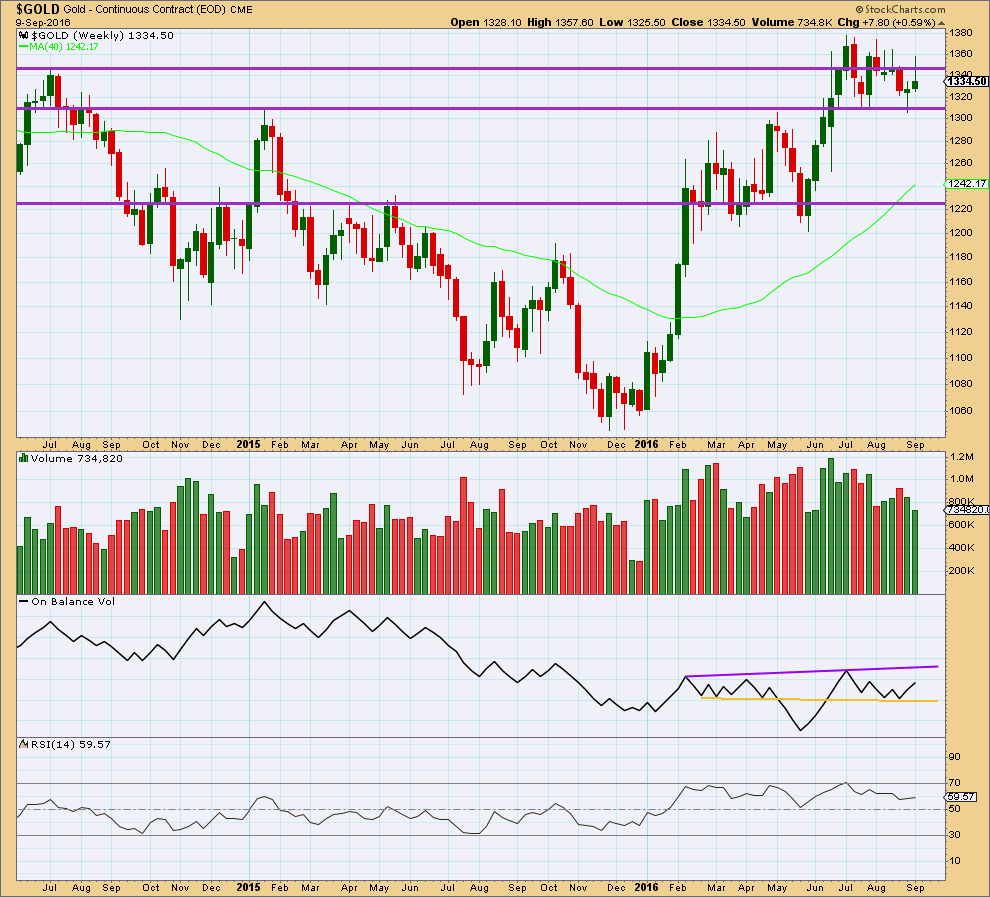
This week moved price reasonably higher, but as yet now a new high above 1st August or 5th July has been made. The green candlestick colour is bullish, but the long upper wick is bearish. The decline in volume for an overall upwards week is bearish, but to understand what is exactly happening in terms of volume it needs to be looked inside at daily volume bars.
On Balance Volume remains bullish with an upwards move further away from the yellow support line.
RSI is still not extreme. There is room for price to rise or fall.
DAILY CHART
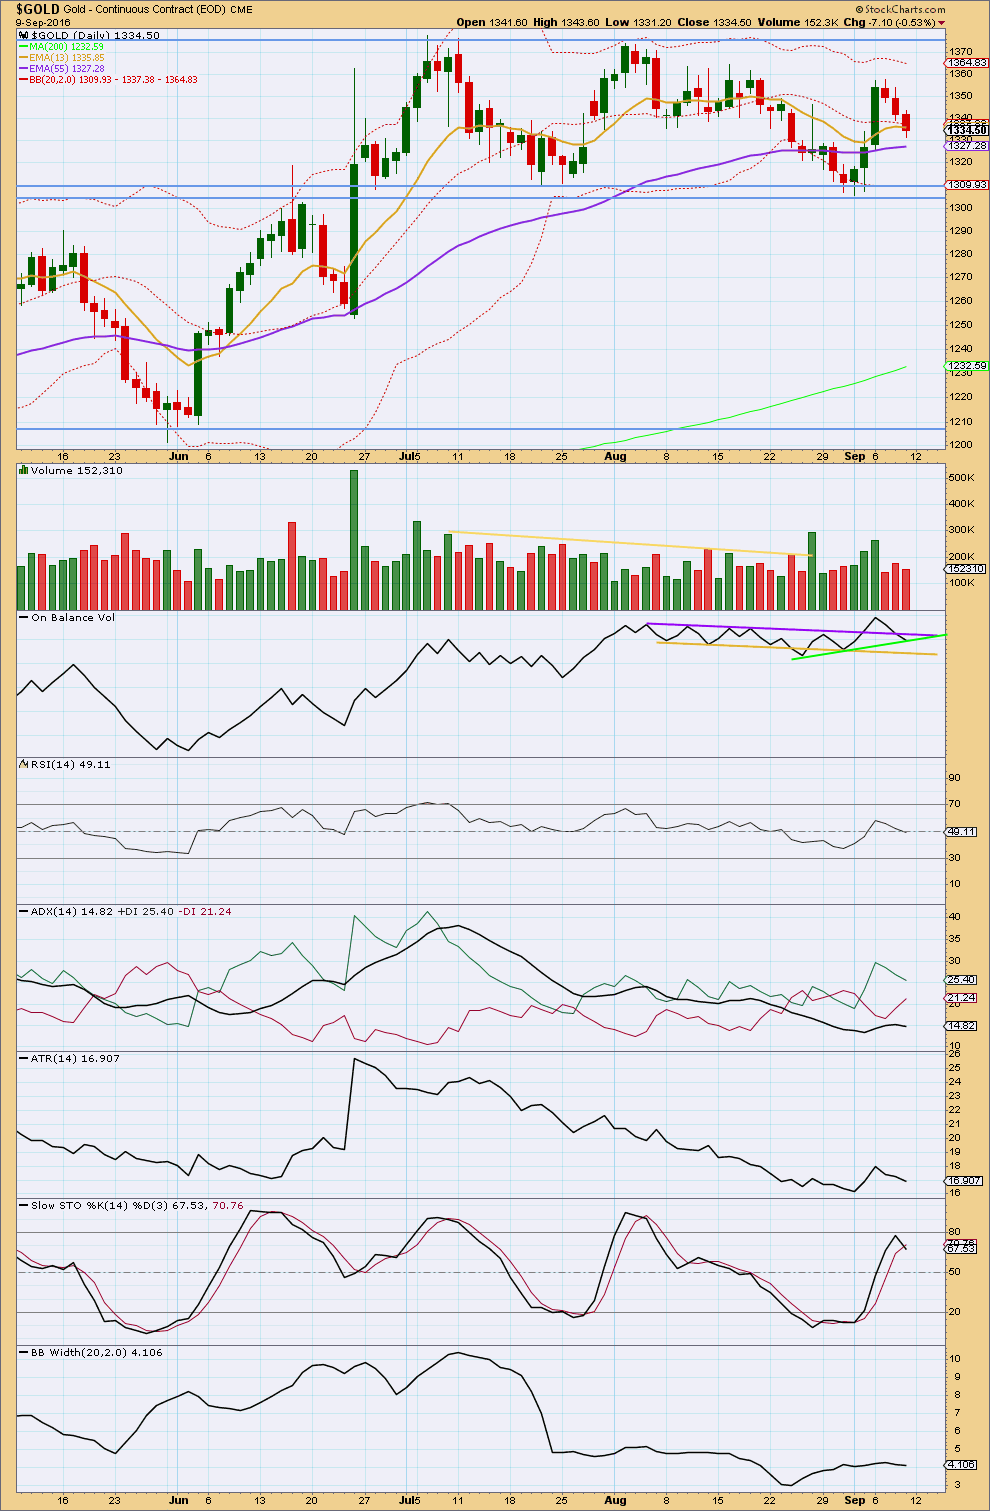
Click chart to enlarge. Chart courtesy of StockCharts.com.
The last three downwards days have seen bears in charge. Yet they have not managed to retrace the prior single upwards day of 6th September, and their efforts are not supported by volume. Volume for the last three downwards days is lighter than the prior two upwards days. The upwards movement from price, which began the week, occurred with increasing and strong volume. The last three downwards days comes on lighter and now declining volume. With Friday’s volume lighter than the day before, it looks like the downwards move is running out of steam.
On Balance Volume gives a bearish signal with a return below the purple line, so this negates the prior bullish signal. A new short term support line is added in green. OBV may find support here.
RSI is neutral and exhibits no divergence with price to indicate weakness.
ADX is declining for Friday, now indicating the market is not trending.
ATR is declining for the last three days, now in agreement short term with ADX. This supports the idea that the last three days downwards movement is more likely a counter trend pullback than the start of a new downwards trend.
Stochastics did not reach overbought at the high this week.
Bollinger Bands remain tightly contracted. They will widen again when a trend develops and volatility returns to the market.
Gold remains range bound with resistance about 1,375 and support at 1,305. Price is still within the range. During this consolidation, it is two upwards days which have strongest volume suggesting an upwards breakout is more likely than downwards. This supports the Elliott wave count. This trick usually works well for Gold.
This analysis is published @ 09:17 p.m. EST on 10th September, 2016.
Gold has behaved pretty much as expected today. The low is right in the target zone, and the structure for minor wave 2 at all degrees is now complete.
I expect there should now be a low in place for Gold and price should move up from here.
I’ll be adding to my long position here. Stop just below 1,302.93 for now.
Was today’s up move minute 1 then minute 2 down has people thinking the 3rd wave won’t come? Gold is really cruel sometimes.
I just read gold may be masculine and silver feminine.
That minute 2 wave down may be more really good discount shopping for miners.
LOL
Pretty sure the metals are gender neutral…. but if I could choose one I’d be Gold not Silver. Silver is too volatile.
I think minute i will take another couple of days yet. I’m expecting to see a nice clear five up on the hourly chart. I would also expect it to move above the end of minor 1 at 1,352.
Dollar weakens after Fed’s Brainard sounds dovish tone
Sept 12, 2016 2:53 p.m. ET
‘Tug of war’ between tightening hopes, risk aversion
http://www.marketwatch.com/story/dollar-steadies-as-investors-await-speech-from-feds-brainard-2016-09-12
NUGT hit low Sept 1st at $17.15 then hit a 2nd wave bottom for buy today at 9:31 am at $18.12 then mid day double bottom at 12:49 and 1:02 for a buy at $18.69 then spiked on FED news at 1:12 and hit $21.21 high at 3:00 pm.
Gold and NUGT 5, 15, 39, 78 minutes started firing bullish at 10 am.
1:12 pm bullish gold FED news spiked up gold
http://www.marketwatch.com/story/dow-futures-slump-more-than-100-points-as-rate-hike-fears-linger-2016-09-12
Lara, would you have any insight into a market hours pattern for many days, which may seem like gold and miners up around the market open then drop from about 10 or 12, so down in afternoon then up after 3 pm EST? Bullish at the open then bearish from the morning high until buying back in at the day low around or after 3 pm.
Sorry Richard, no, I don’t. The math to calculate that one is beyond my abilities.
I know I have an explanation of how to do that in Kaufman, but Kaufman is the one text I find really difficult. There’s a lot of calculus in Kaufman which I just don’t get.
If any members are math wizards and want to have a go at this, then please do so.
Gold just making new lows again at 12:15 pm of 1320.93.
Gold and miners have patterns up in morning down ion afternoon then up at close.
Since last 2months this 3rd wave is testing our patience…im hopefull that this is the last phase and last day of our test.
I’ll believe it when I see it.
Lara has mentioned that before the bigger stronger wave up happens that gold will really test traders patience until they think it isn’t happening then it will move up in the bigger wave.
Maybe when many are ready to give up then bullish sentiment will be at an extreme low ready to the herd to gradually begin a move to bullish.
Exactly.
There will be another second wave correction for minute ii which will convince most that there will be no third wave.
And that’s if I’ve got the wave count right.
Sentiment Speaks: Buy Gold… And Everything Else
Sep. 11, 2016 7:48 AM EST – Avi Gilburt
http://seekingalpha.com/article/4005422-sentiment-speaks-buy-gold-everything-else
JUST A VIEW: IMO Gold price appears top heavy for the week with H 1352 / L 1321. Looks unlikely an upward move will get to take out the weeks high. Sentiment: Initiate shorts (liquidate longs); pullback is expecting. MACD, ROC, Momentum are bearish.
Some of you may want to read Avi Gilburt’s very insightful weekend article.
Here is the string:
http://seekingalpha.com/article/4005422-sentiment-speaks-buy-gold-everything-else?app=1&uprof=51&isDirectRoadblock=false
Jordan Bryne, CMT- The Daily Gold also suggests, the correction is Not over and we may see $22 and $1310 to 1295 or even down to $1250ish in Gold. Corrective bent at least to Sept 20, when Fed decides to raise or not and could extend depending on their commentary.
I am uploading the following excerpt from Jordan.
Thanks for excellent analysis.
On daily chart gold is setting up a very bullish candlesticks chart pattern long Green/white candle followed by three days shakeout (Ted Warren fav from 1950’s) . Expectation is price should dip below and daily chart should produce a large green/white candle on Monday/Tuesday.
Volume analysis is confirming what just going to happen: “The upwards movement from price, which began the week, occurred with increasing and strong volume. The last three downwards days comes on lighter and now declining volume. ”
One can not get any better signal than this!!!!
EW count, chart pattern and volume analysis indicating gold is going higher while street is expecting further downward correction?????
Any chance that with USD strengthening, Gold might retest May 2016 lows?
Monday 1 pm US Dollar weakens after Fed’s Brainard sounds dovish tone