
Last week expected upwards movement for Silver.
Price has turned downwards but remains above the invalidation point.
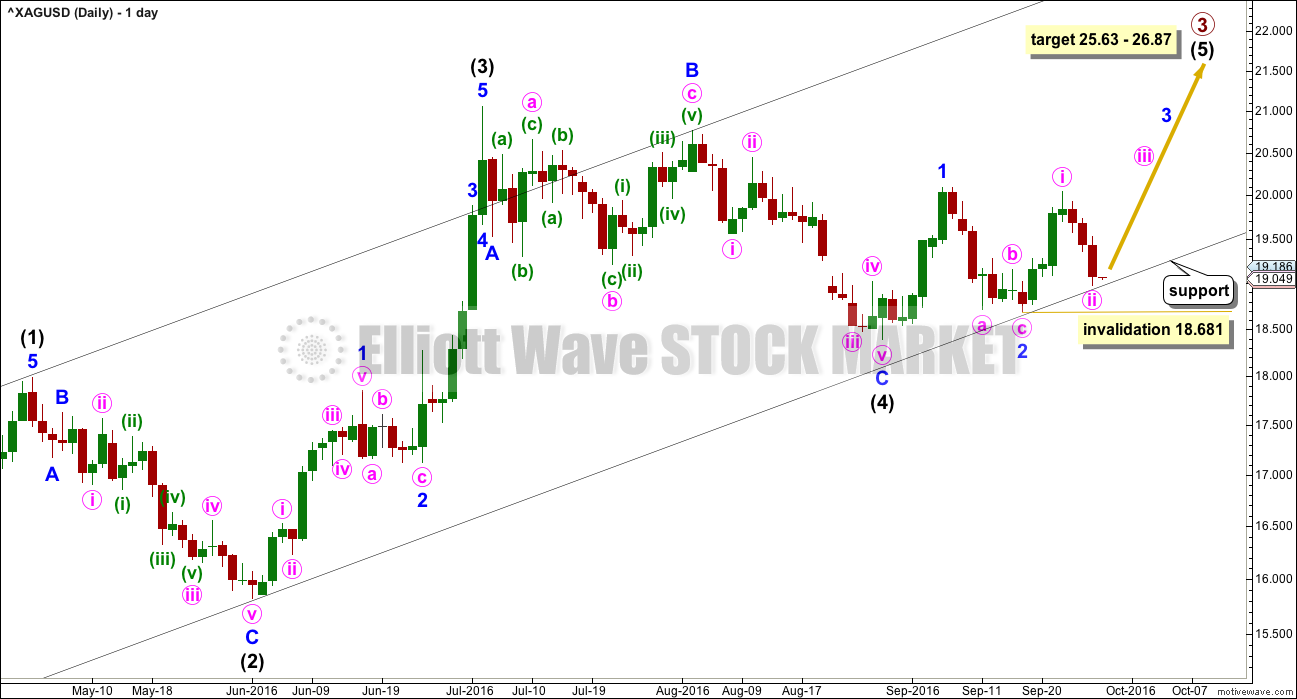
Summary: This market may be offering a low risk high reward opportunity to join the upwards trend. Price has again come down to find support right at the lower trend line. Risk is at 18.681 and the target is at 25.63 – 26.87. Always use stops for all trades and invest no more than 3-5% of equity on any one trade. If price comes up to touch the upper trend line, look for signs of exhaustion to exit long positions.
New updates to this analysis are in bold.
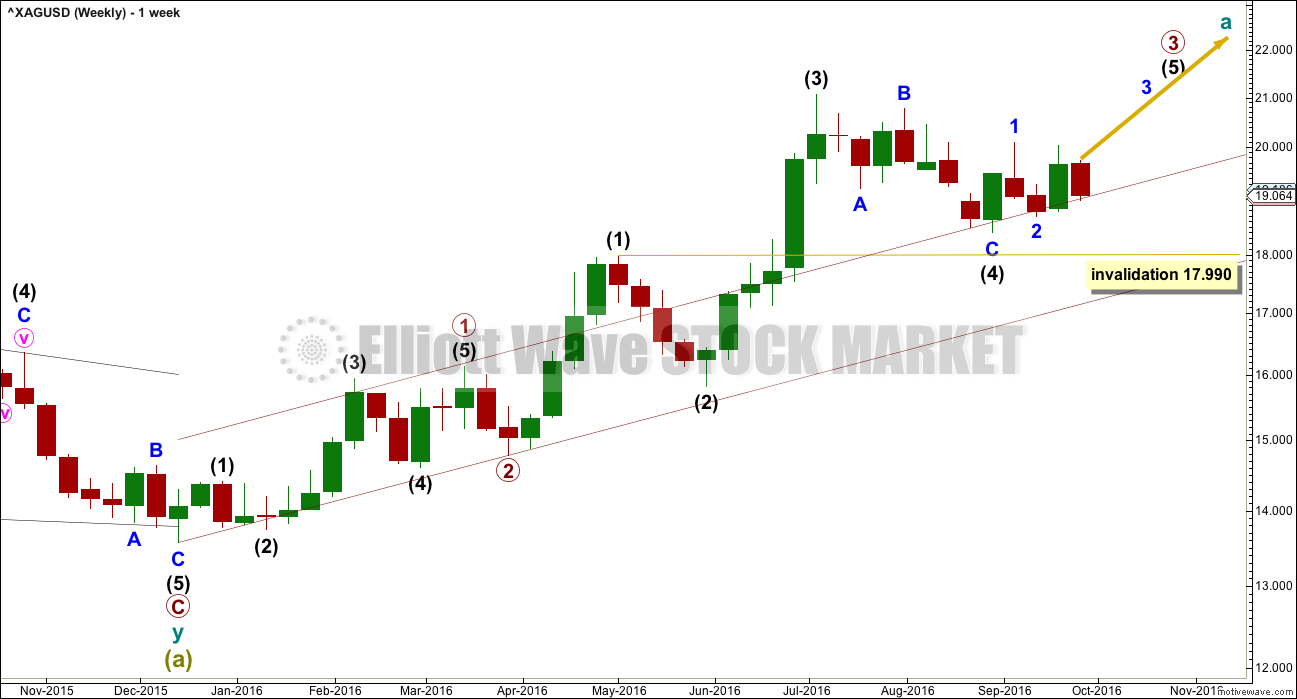
WEEKLY WAVE COUNT
Click chart to enlarge.
Within primary wave 3, intermediate waves (1), (2) and (3) may be complete. Intermediate wave (4) may be unfolding.
Intermediate wave (4) may not move into intermediate wave (1) price territory below 17.990.
Intermediate wave (5) may be a swift sharp extension. It may end with a blowoff top.
A base channel about primary waves 1 and 2 is added this week. Intermediate wave (4) has found support about the upper edge.
DAILY WAVE COUNT
Click chart to enlarge.
The trend channel is a best fit. A daily chart is provided below to illustrate exactly how it should be drawn.
At 25.63 primary wave 3 would reach 4.236 the length of primary wave 1.
At 26.87 intermediate wave (5) would reach 1.618 the length of intermediate wave (3). This gives a 1.24 target zone calculated at two wave degrees.
There is inadequate alternation between intermediate waves (2) and (4) because they are both subdividing as zigzags. There is some alternation so far within the structure: within intermediate wave (2) minor wave B was very brief and within intermediate wave (4) minor wave B is very time consuming. Intermediate wave (2) was a 0.68 correction of intermediate wave (1) and intermediate wave (4) is a 0.51 correction of intermediate wave (3), so there is no reasonable alternation in depth.
Minor waves 1 and now 2 are complete within intermediate wave (5). This wave count now expects to see an increase in upwards momentum as a third wave unfolds.
Within minor wave 3, minute wave i is complete. It looks most likely that minute wave ii is also complete because it should find strong support at the lower edge of the best fit channel. Minute wave ii may not move beyond the start of minute wave i below 18.681.
This wave count now expects a third wave at two low degrees to move price higher. It should show an increase in momentum and should have support from volume.
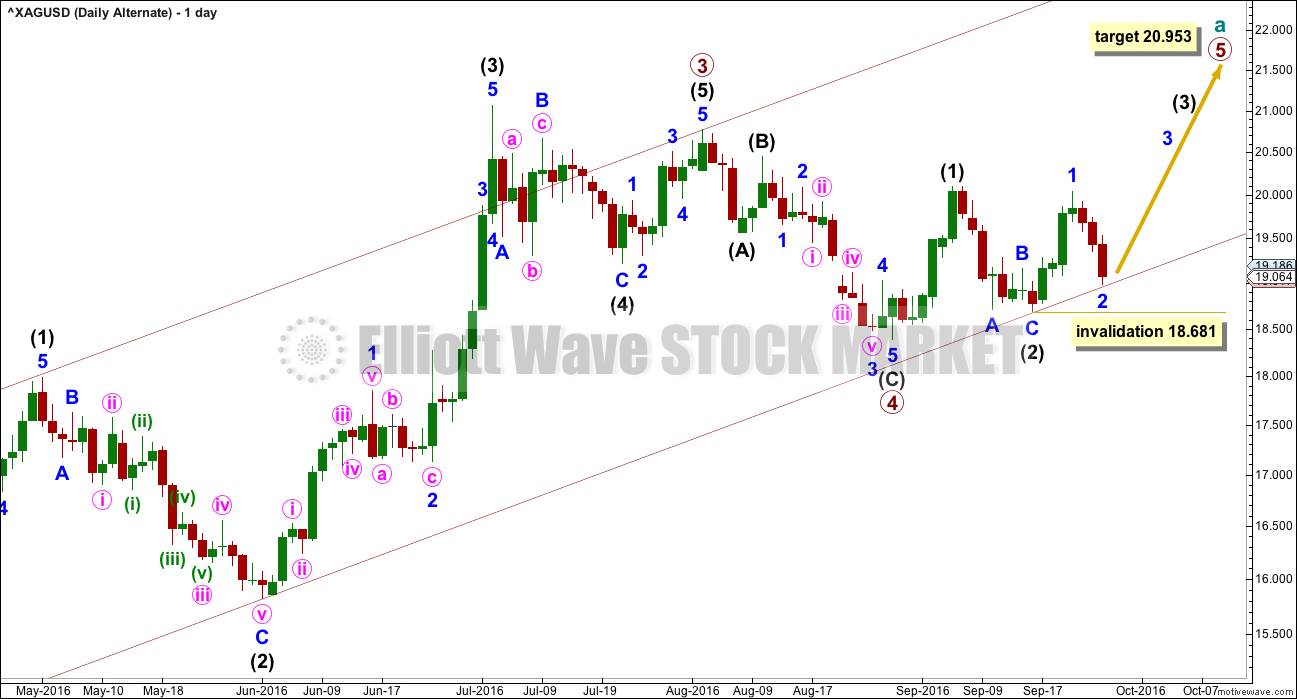
ALTERNATE DAILY WAVE COUNT
Click chart to enlarge.
It is possible that primary wave 3 is already over. Intermediate wave (5) would be truncated by 0.294, which reduces the probability of this alternate.
Primary wave 3 has no adequate Fibonacci ratio to primary wave 1. At 20.953 primary wave 5 would reach equality in length with primary wave 1.
Within primary wave 5, intermediate waves (1) and (2) may now be complete. This wave count now also expects to see an increase in upwards momentum. Within intermediate wave (3), minor wave 1 is complete and minor wave 2 now also looks likely to be complete. Minor wave 2 may not move beyond the start of minor wave 1 below 18.681.
Corrections should find strong support at the lower edge of the channel.
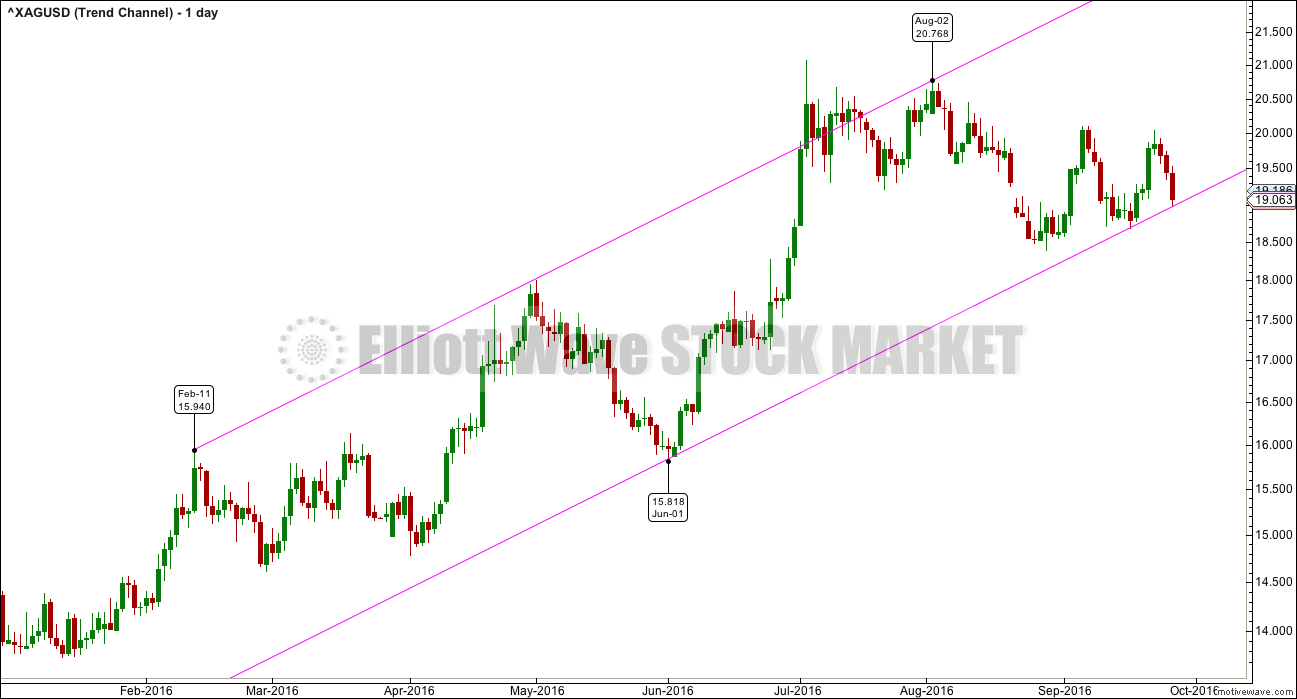
TREND CHANNEL
Click chart to enlarge.
Draw a parallel channel on the daily chart, on a semi-log scale. Draw the first trend line from the high of 11th of February to the high of 2nd of August. Place a parallel copy on the low of 1st of June. This channel perfectly shows where the last pullback ended and where price turned. The upper edge is overshot by a third wave, which typically is very strong and overshoots channels.
This trend channel has a very good look. Expect the larger trend is up while price remains within the channel. Each time price touches the lower edge presents an opportunity to join the trend at a good price. Stops may be set just a little below the trend line. Each time price touches the upper edge look for signals to exit positions.
As always: do not invest more than 3-5% of equity on any one trade and always use a stop for all trades.
TECHNICAL ANALYSIS
WEEKLY CHART
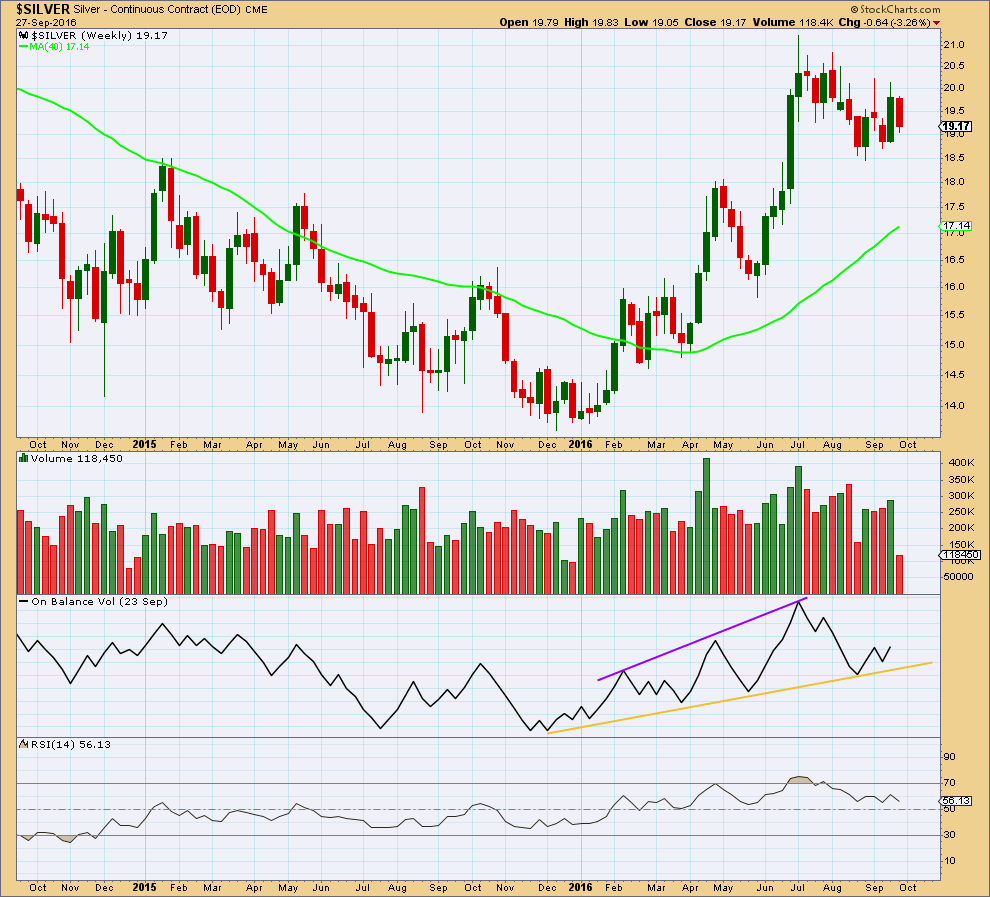
Click chart to enlarge. Chart courtesy of StockCharts.com.
Last week completed a bullish engulfing candlestick pattern. It also completed with stronger volume than the prior two downwards weeks. This strongly supports the Elliott wave counts.
On Balance Volume gave a bullish signal with a move up and away from support at the yellow line.
RSI is not extreme. There is small short term divergence between the last two small swing highs: RSI has made a higher high but price has made a slightly lower high. This indicates some possible weakness in price; it is bearish.
Overall, the picture at the weekly chart level is more bullish than bearish.
DAILY CHART
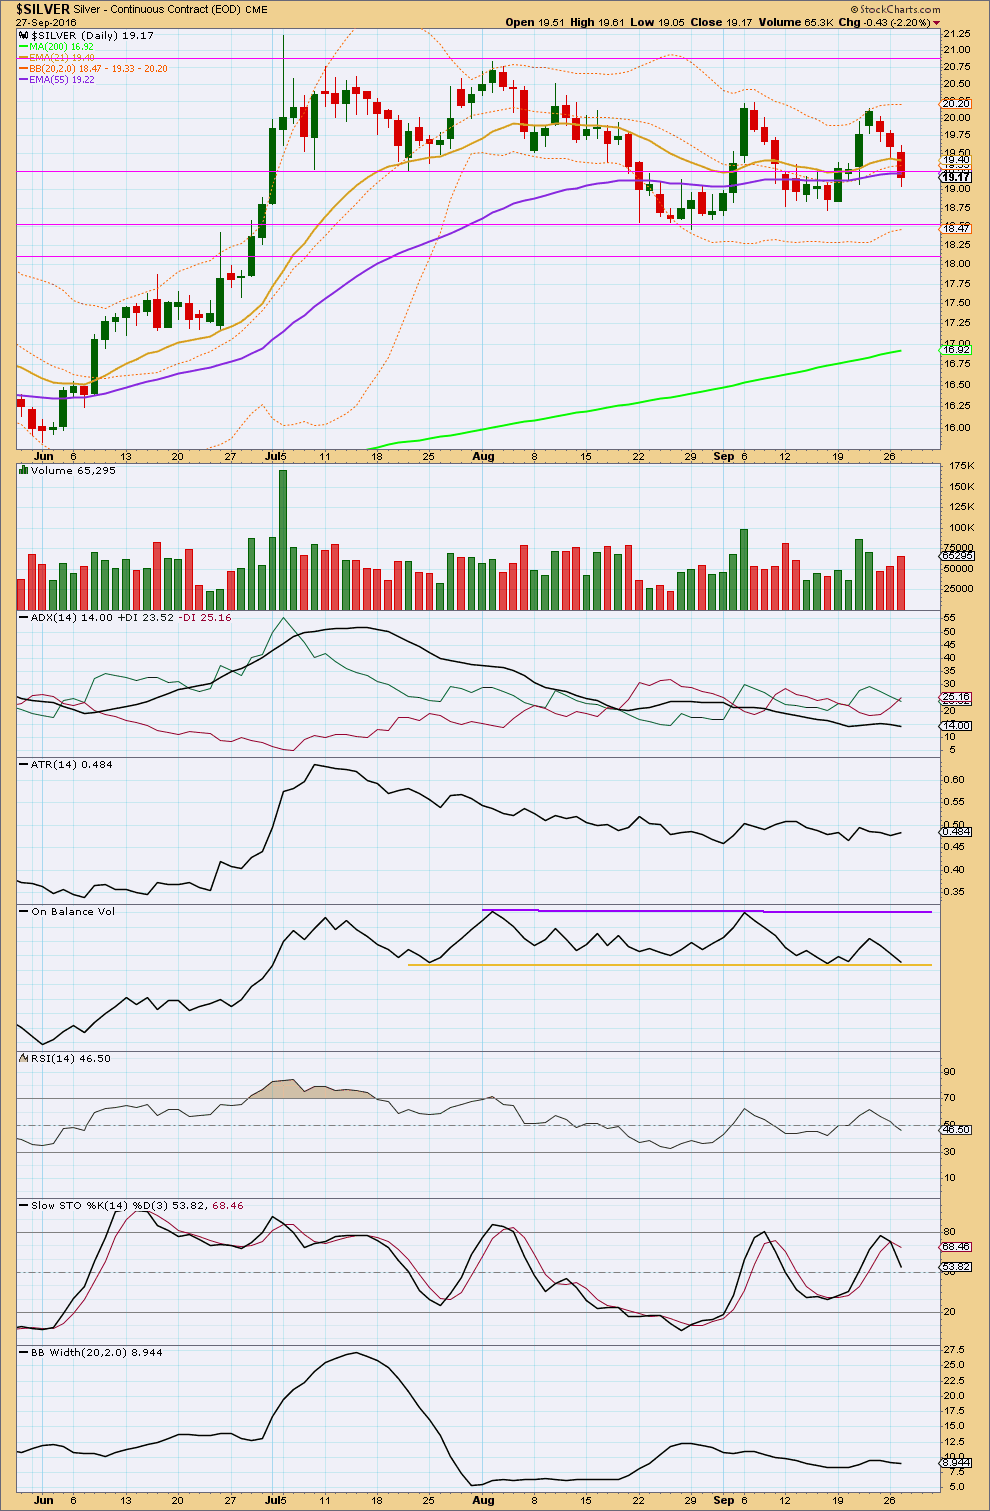
Click chart to enlarge. Chart courtesy of StockCharts.com.
For three days in a row, Silver has moved lower on increasing volume. The fall in price is supported by volume. However, volume for these three days is still lighter than prior upwards days. There is more support for the rise in price than there is for the fall in price.
The next line for support for price is about 18.55.
ADX is declining and below 15 indicating the market is not currently trending. The +DX and -DX lines are whipsawing about each other. ATR is overall flat to declining and Bollinger Bands are contracted. This market is not currently trending.
On Balance Volume has come down today to find support at the yellow line. This line is horizontal and long held but only tested twice. It has some technical significance. It may assist to halt the fall in price here, in conjunction with the trend channel given in the Elliott wave analysis.
RSI is close to neutral. There is plenty of room for price to rise or fall. At the daily chart level, there is no divergence between price and RSI at the last two small swing highs.
With the market consolidating, it should be expected to swing from resistance to support and back again. Currently, Stochastics may be returning from overbought. A continuation of a downwards swing would be expected from this approach to continue until price finds support and Stochastics reaches oversold.
The longer term trend remains up though, so an expectation of a downwards swing should be approached with caution. The long term 200 day moving average is still pointing up, and the mid term Fibonacci 55 day moving average is also still pointing up and remains well above the long term moving average.
This analysis is published @ 12:37 a.m. EST.
Any idea where we are in a new wave count? It looks like we just dropped below the invalidation point.