
Last week’s classic technical analysis diverged from the Elliott wave count. Price has moved mostly sideways.
Summary: This week both Elliott wave counts expect downwards movement for the next week, and volume supports this view.
New updates to this analysis are in bold.
MONTHLY ELLIOTT WAVE COUNT
Click chart to enlarge.
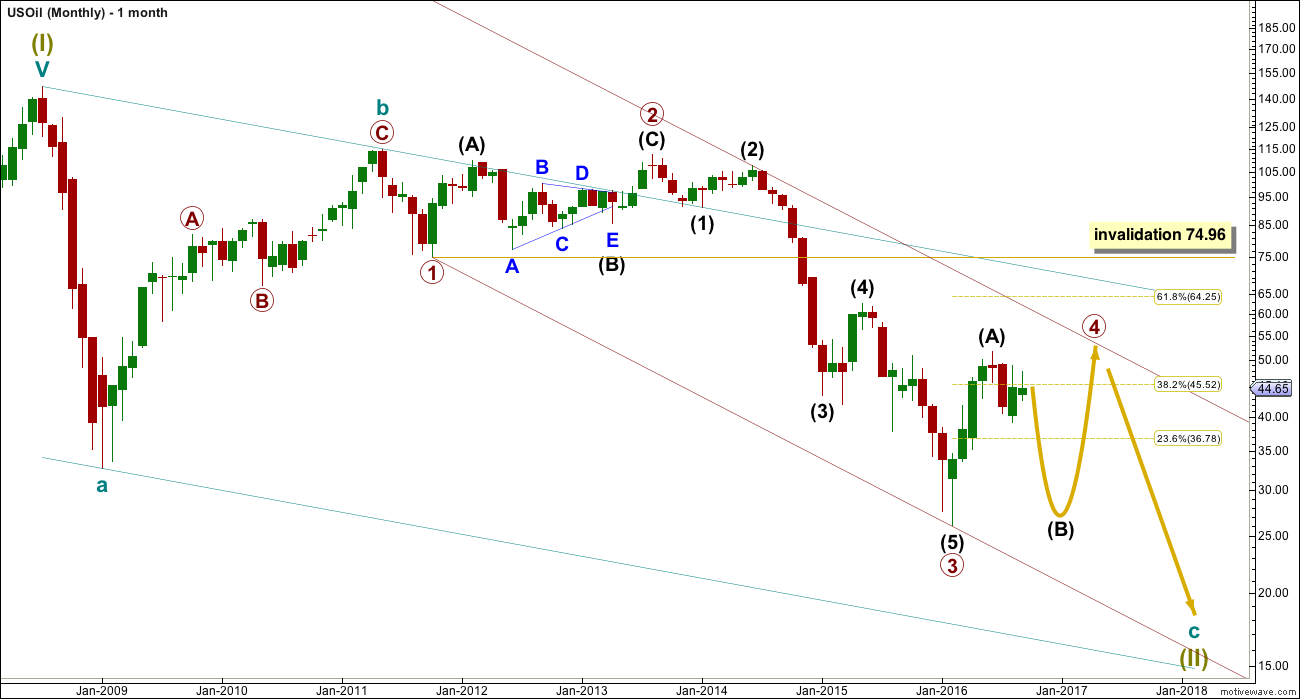
Within the bear market, cycle wave b is seen as ending in May 2011. Thereafter, a five wave structure downwards for cycle wave c begins.
Primary wave 1 is a short impulse lasting five months. Primary wave 2 is a very deep 0.94 zigzag lasting 22 months. Primary wave 3 is a complete impulse with no Fibonacci ratio to primary wave 1. It lasted 30 months.
Primary wave 4 is likely to exhibit alternation with primary wave 2. Primary wave 4 is most likely to be a flat, combination or triangle. Within all of these types of structures, the first movement subdivides as a three.
Primary wave 4 is likely to end within the price territory of the fourth wave of one lesser degree; intermediate wave (4) has its range from 42.03 to 62.58.
Primary wave 4 may end if price comes up to touch the upper edge of the maroon channel. The upper edge of this channel has been pushed up to sit on the end of intermediate wave (2) within primary wave 3.
Primary wave 4 is most likely to be shallow to exhibit alternation in depth with primary wave 2. So far it has passed the 0.382 Fibonacci ratio at 45.52. It may now move mostly sideways in a large range.
Primary wave 4 may not move into primary wave 1 price territory above 74.96.
DAILY ELLIOTT WAVE COUNT
Click chart to enlarge.
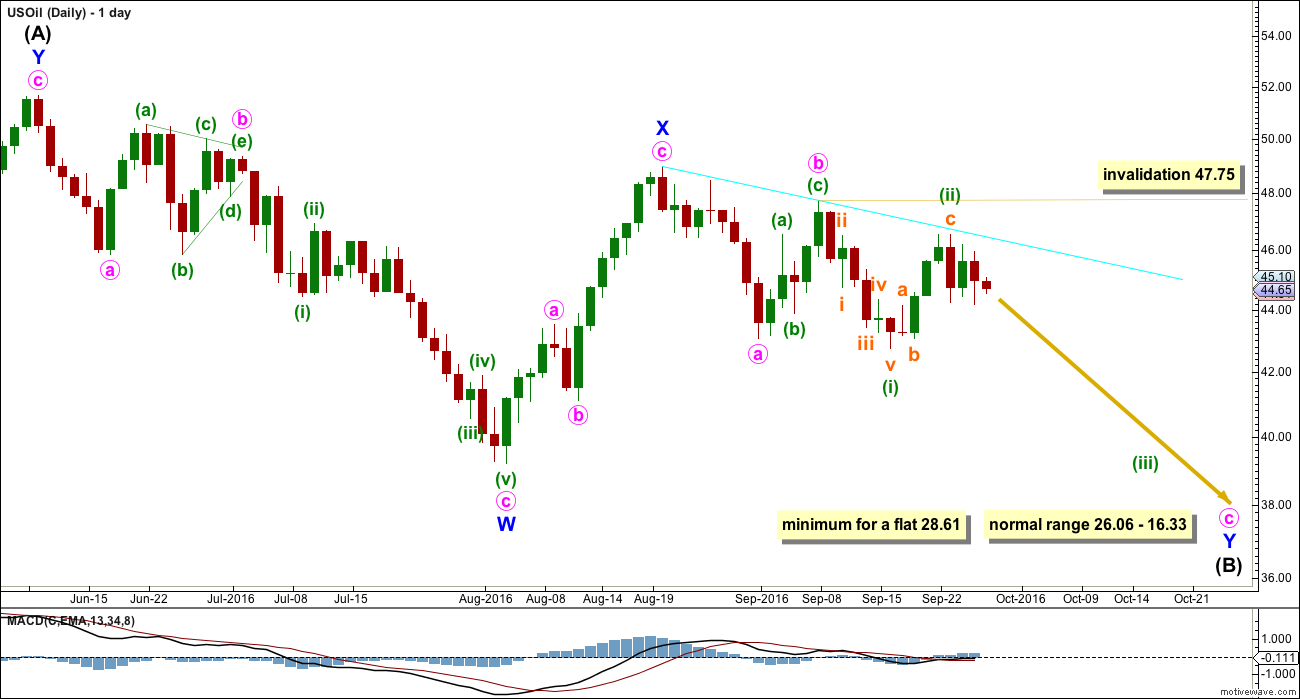
Intermediate wave (A) may be complete as a double zigzag.
If intermediate wave (A) is a three, then intermediate wave (B) is most likely to be a very deep correction. It may make a new low below the start of intermediate wave (A) at 26.06.
If primary wave 4 is to be a flat correction, then intermediate wave (B) must be a minimum 0.9 length of intermediate wave (A) at 28.61. The normal range for intermediate wave (B) would be 1 to 1.38 the length of intermediate wave (A) at 26.06 to 16.33.
If primary wave 4 is to be an expanded flat correction, then intermediate wave (B) should be 1.05 the length of intermediate wave (A) or longer, at 24.78.
If primary wave 4 is to be a triangle, then intermediate wave (B) has no minimum nor maximum. It must only subdivide as a three wave structure. It may make a new low below the start of intermediate wave (A) at 26.06 as in a running triangle. A normal range for intermediate wave (B) within a larger triangle would be 0.8 the length of intermediate wave (A) at 31.18.
A triangle would only be possible at this stage if my labelling of either intermediate waves (A) or (B) as a double zigzag is wrong. Only one sub-wave within a triangle may be a multiple correction. Four of the five sub-waves of a triangle must be simple A-B-C structures.
Primary wave 4 may not move into primary wave 1 price territory above 74.96.
Intermediate wave (B) may be any of more than 23 possible corrective structures. It would most likely be a single or multiple zigzag in order to be a deep correction. It may also be an expanded flat to be deep. It may find support at the lower edge of the maroon channel.
So far intermediate wave (B) looks most likely to be unfolding as a double zigzag.
Within double zigzags, the X wave is most often a brief and relatively shallow zigzag. This main daily wave count sees minor wave X complete at 0.79 the length of minor wave W, and more brief than the alternate. For this reason this main wave count has a higher probability.
This main wave count must see the downwards wave labelled minute wave a as a five, but it looks more like a three. This reduces the probability of this main wave count to about even now with the alternate.
Minor wave Y should unfold as a zigzag and the structure so far is incomplete. Within minor wave Y, minute waves a and b may now be complete. Within minute wave c, minuette wave (ii) may not move beyond the start of minuette wave (i) above 47.75.
The second zigzag in the double would be required to deepen the correction.
The cyan trend line has been tested now three times and so far is holding. If price comes up again to this line, expect a turn and downwards movement again from there.
ALTERNATE DAILY ELLIOTT WAVE COUNT
Click chart to enlarge.
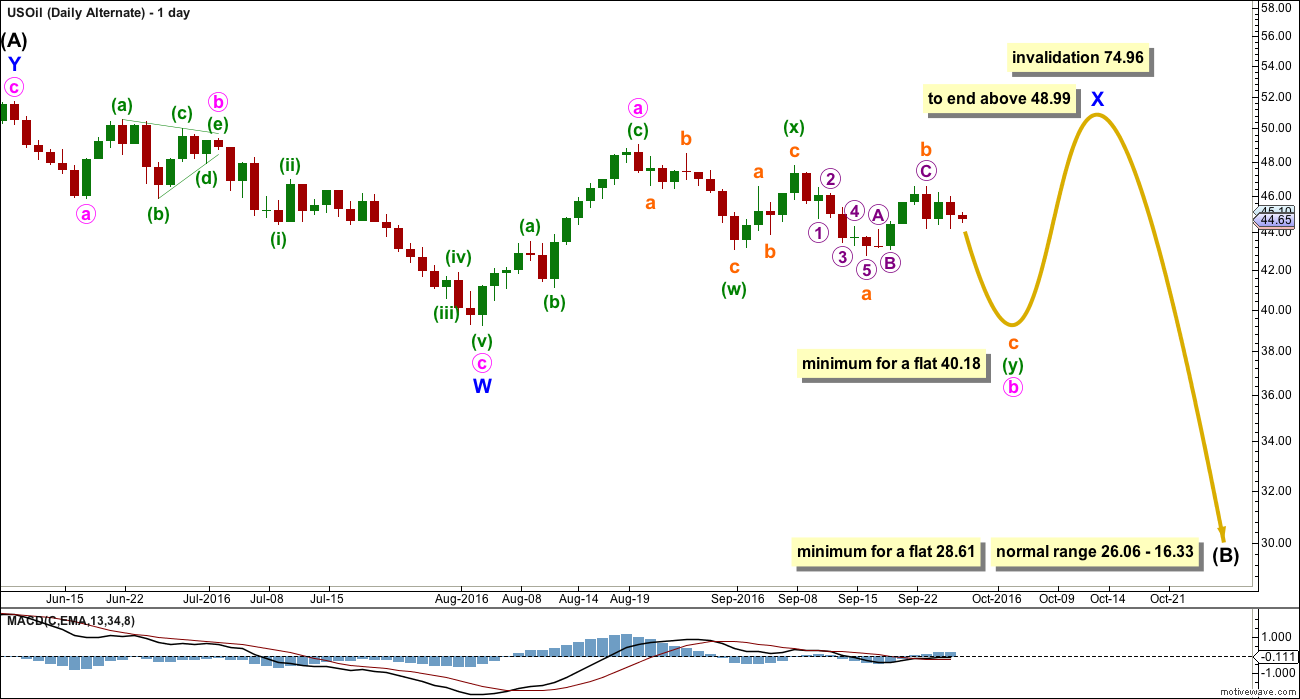
This alternate is identical to the main wave count up to the low labelled minor wave W.
It still sees intermediate wave (A) upwards as a complete three wave structure, a double zigzag.
Thereafter, it also still sees intermediate wave (B) downwards unfolding also as a double zigzag. This is possible if primary wave 4 is unfolding as a flat correction.
This alternate sees minor wave X as incomplete within the double zigzag of intermediate wave (B).
Minor wave X may be any corrective structure. It may be unfolding as a flat correction. This is a common structure, just less common than a simple zigzag.
Within the flat correction of minor wave X, minute wave b must retrace a minimum 0.9 length of minute wave a at 40.18. Minute wave b may be unfolding as a double zigzag. Within the double zigzag, the first zigzag is complete labelled minuette wave (w). The double is joined by a completed three in the opposite direction, a zigzag labelled minuette wave (x). The second zigzag in the double is incomplete.
When minute wave b is complete and has reached the minimum, then a trend change for Oil would be expected for this alternate. Minute wave c upwards would be expected to make at least a slight new high above the end of minute wave a at 48.99 to avoid a truncation.
The longer term expectations for the end of intermediate wave (B) are exactly the same for both wave counts.
TECHNICAL ANALYSIS
DAILY CHART
Click chart to enlarge. Chart courtesy of StockCharts.com.
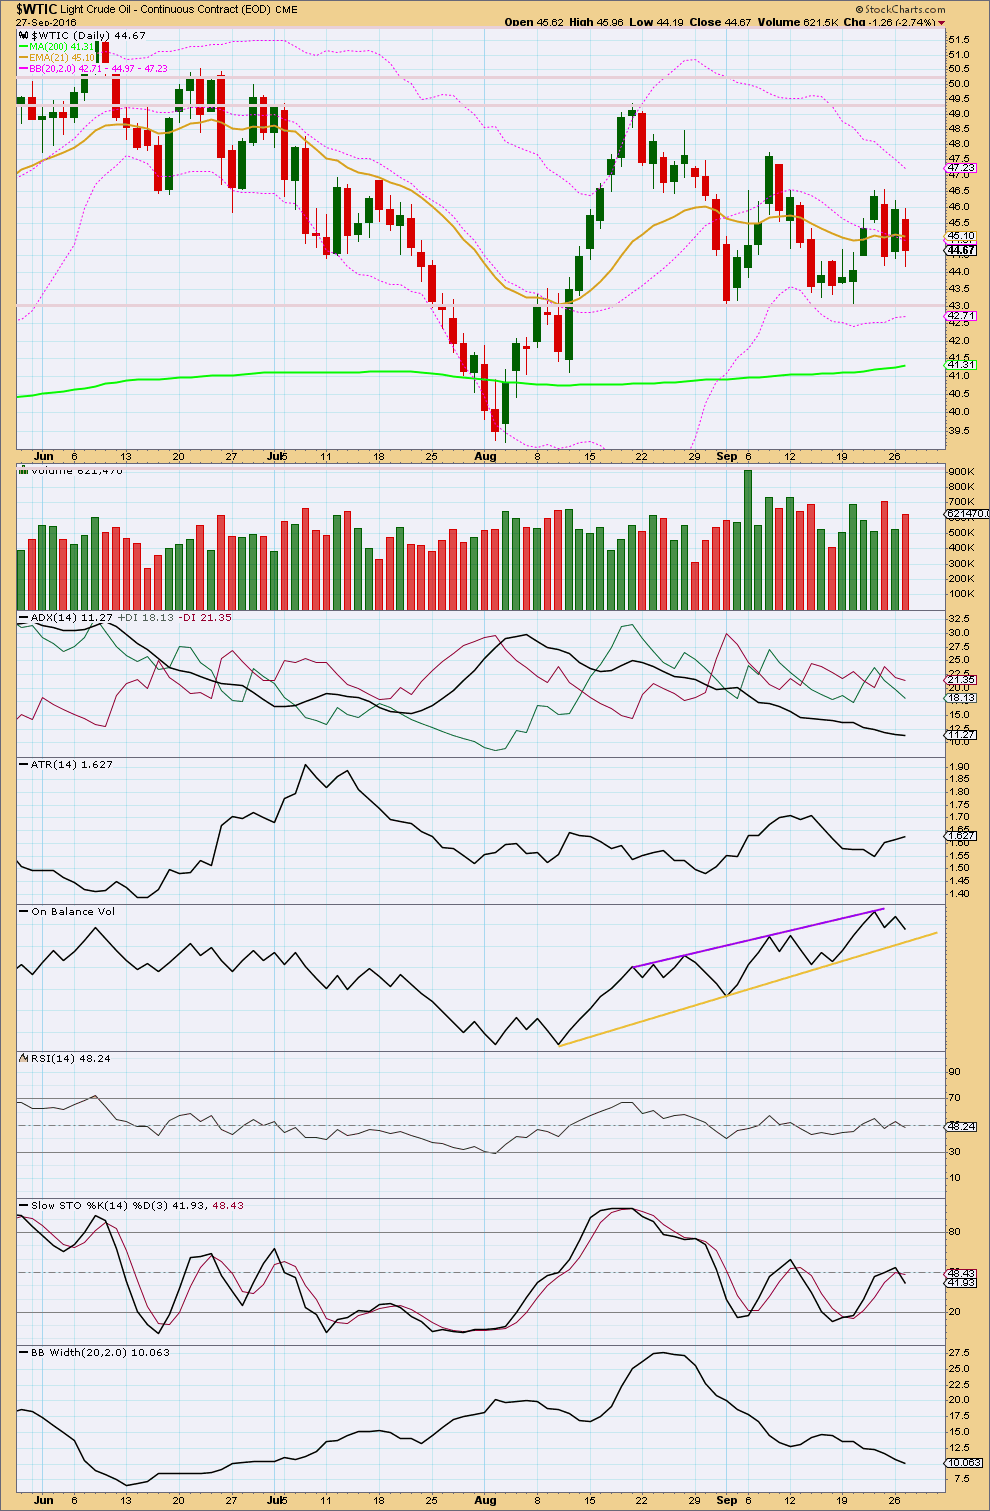
Oil is range bound and this market is not trending. Resistance is about 49.30 and support is about 43.
During this consolidation, so far it is the upwards day of the 6th of September that has strongest volume, suggesting the breakout when it comes is more likely to be upwards than downwards.
In the short term, the last two downwards days have stronger volume than upwards days. There is more support currently for downwards movement than upwards.
ADX is declining and below 15. The +DX and -DX lines are whipsawing about each other. ADX is clear: the market is not trending.
ATR is currently slightly increasing. A short term trend within a larger consolidation may be downwards if volume is taken to suggest direction.
Bollinger Bands are contracting in agreement with ADX. Overall, with ADX and Bollinger Bands in agreement and ATR unclear, it is reasonable to assume this market is not trending.
The longer term 200 day moving average is still pointing up. The mid term Fibonacci 55 day moving average is flat. This consolidation looks like a larger term one.
On Balance Volume gave a bearish signal with a move down and away from the purple resistance line. It should find support at the yellow line. This is some distance away, so it allows for a further fall in price here.
This analysis is published @ 12:16 a.m. EST.
Definitely acting like its going to go up after the OPEC agreement. Also several of the large banks changed there forecast after the opec agreement to 70-80$ this week.
Lara, is it possible that primary wave 4 is a multimonth (around 9 months) triangle that is about to end soon?
Here is the chart.
Thanks
Yes, it is, but I would expect wave B to move lower.
I have found that triangle subwaves are commonly about 0.8 to 0.85 the length of the prior wave. This one would be too shallow, it wouldn’t have a very typical look.
That’s pretty much the main reason I’ve not charted and published the idea.
B of the triangle would be only 0.48 of A. That’s too shallow.
Hi Lara, could you please update Oil? Really interested what your thoughts are. Thanks
opec reached an agreement on restricting production outputs and oil shot up to roughly 47.50 almost invalidating the main count. Thoughts?
It fits the alternate better than the main. Here’s a possible update.
My thoughts on recent Oil movement? It’s consolidating. From a classic TA POV expect sideways movement within the current range, resistance about 49 and support about 39.20. The upwards movement yesterday is still within this range.
From an EW POV it’s either a B wave or an X wave. Horrid, choppy overlapping movement, impossible at this stage to predict what structure it will turn out to be.
A good time to avoid a market is a consolidating B or X wave.
It’s the trades you don’t take which often make a difference between profit and loss.
Thank you!
Hi Lara, looking forward to the update today