
Last GDX analysis on 31st of August expected the downwards trend to be interrupted by a bounce.
Price moved sideways for about four weeks, which fits expectations, and is now moving strongly lower.
Summary: A downwards trend is in place for GDX, but the bears look tired. A bounce should come sooner rather than later. If it remains below 25.86, then a downwards trend may be assumed to remain. But if it moves above 25.86, then expect new highs.
New updates to this analysis are in bold.
MONTHLY ELLIOTT WAVE COUNT
Click chart to enlarge.
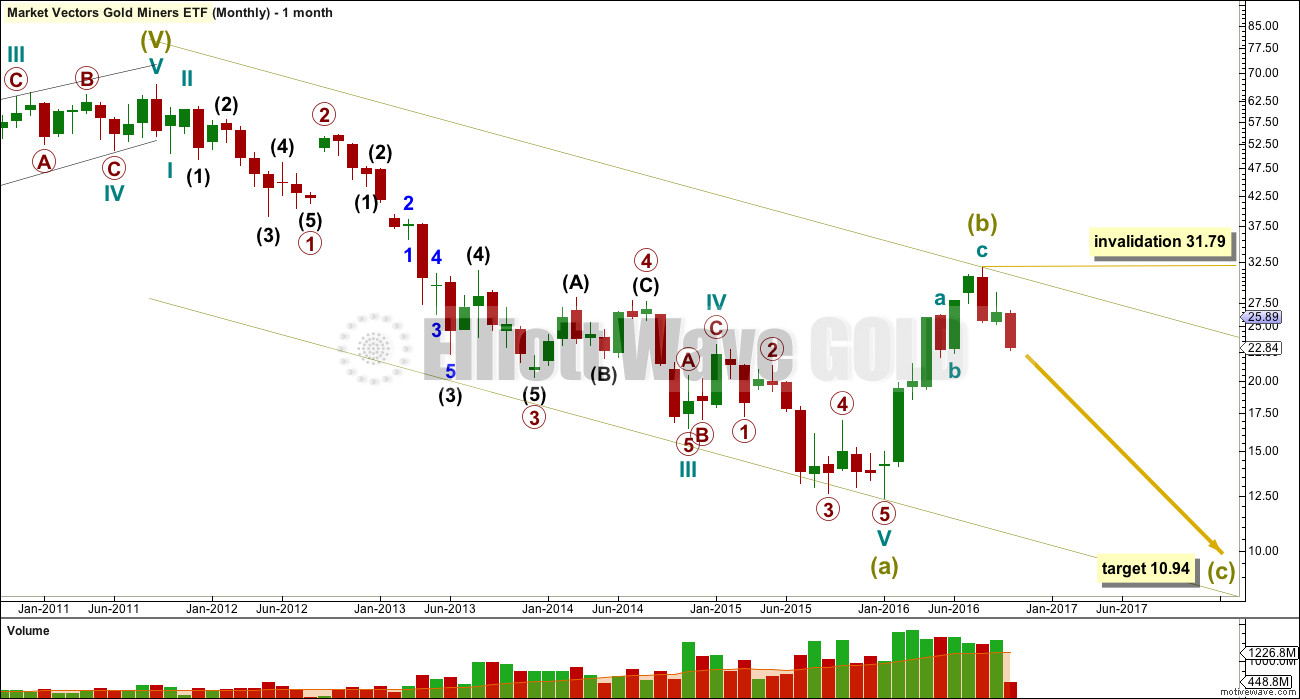
The whole wave down for Super Cycle wave (a) subdivides well as a five wave impulse. However, GDX does not have adequate volume to produce typical looking Elliott wave structures. As always, this wave count comes with the strong caveat that this market is not sufficient in volume for a reliable Elliott wave analysis. It is a rough guide only. The direction expected from the Elliott wave count should be fairly reliable, but targets and invalidation points may not be.
Ratios within Super Cycle wave (a) are: there is no Fibonacci ratio between cycle waves I and III, and cycle wave V is 0.33 short of 0.236 the length of cycle wave III.
Ratios within cycle wave III are: primary wave 3 is 3.48 short of 1.618 the length of primary wave 1, and primary wave 5 has no Fibonacci ratio to primary waves 3 or 1.
Ratios within primary wave 3 are: intermediate wave (3) has no Fibonacci ratio to intermediate wave (1), and intermediate wave (5) is just 0.02 longer than equality in length with intermediate wave (1).
Ratios within intermediate wave (3) are: minor wave 3 is 0.38 longer than equality in length with minor wave 1, and minor wave 5 has no Fibonacci ratio to either of minor waves 3 or 1.
Within cycle wave V, there are no adequate Fibonacci ratios between primary waves 1, 3 and 5.
The black channel is a best fit; this movement does not fit into an Elliott channel. The channel is breached very clearly and price has made a major new swing high above 17.04. A trend change was confirmed in February.
If analysis of downwards movement is correct that Super Cycle wave (a) has subdivided as a five wave structure, then this tells us two things:
1. The bear market for GDX must be incomplete because a five may not be a corrective structure, so this must only be wave A.
2. Super Cycle wave (b) may not make a new high above the start of Super Cycle wave (a) at 66.98.
Super Cycle wave (b) may be any one of 23 possible corrective structures. It may be a swift sharp zigzag, or it may be a sideways structure such as a flat, combination or triangle. It should last one to several years. It is possible that it is over. An alternate at the end of this analysis looks at this possibility.
This wave count looks at the possibility that Super Cycle wave (c) is a complete, swift, sharp zigzag.
The main and alternate wave counts are swapped over today from last analysis, but I do not wish readers to interpret this as indicating one is more likely than the other. For GDX it is safer to let price tell us which wave count is correct. A new low short term below 21.94 would shift probability to this first wave count whereas a new high above 25.86 would shift probability to the alternate wave count.
DAILY ELLIOTT WAVE COUNT
Click chart to enlarge.
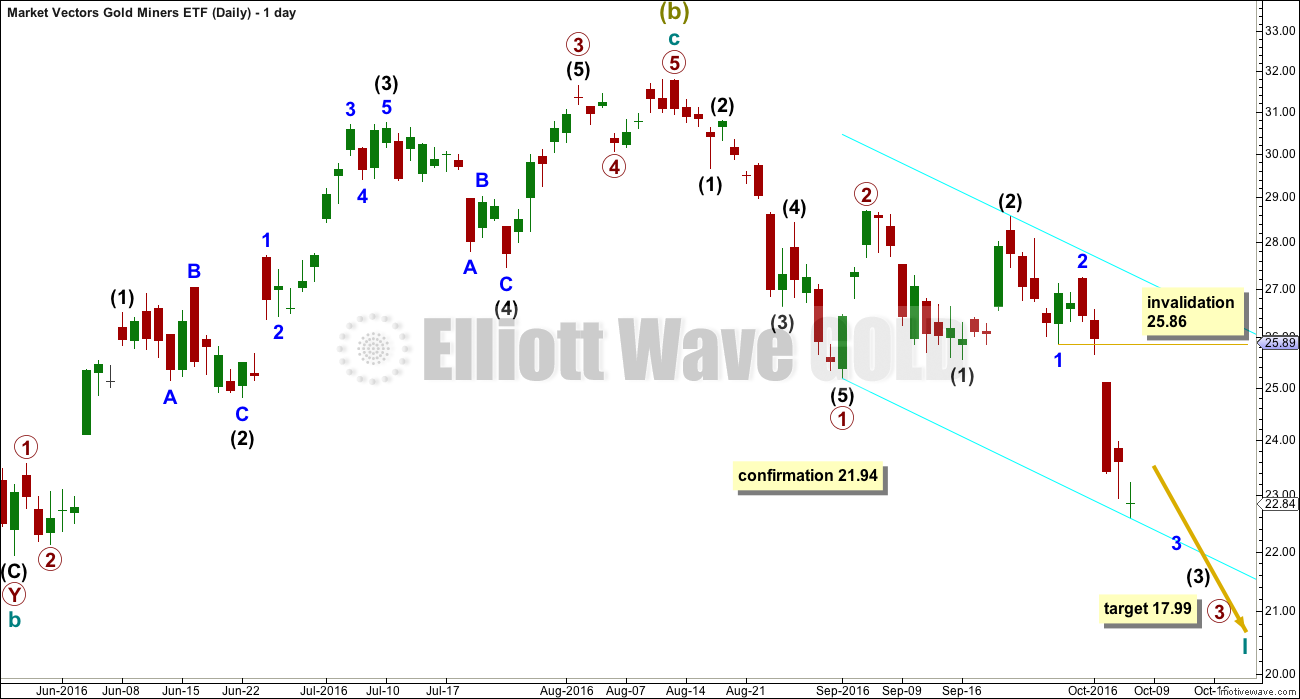
Analysis within cycle wave c is changed today. A large zigzag may have completed at the last high for GDX. Thereafter, downwards movement may be a series of overlapping first and second waves, with a third wave now unfolding.
Within cycle wave I of super cycle wave (c), at 17.99 primary wave 3 would reach 1.618 the length of primary wave 1.
Within intermediate wave (3), the structure may only unfold as an impulse. Minor wave 4 may not move into minor wave 1 price territory above 25.86. At this stage, this wave count would be discarded if price moves above 25.86, which would favour of the alternate below.
ALTERNATE MONTHLY ELLIOTT WAVE COUNT
Click chart to enlarge.
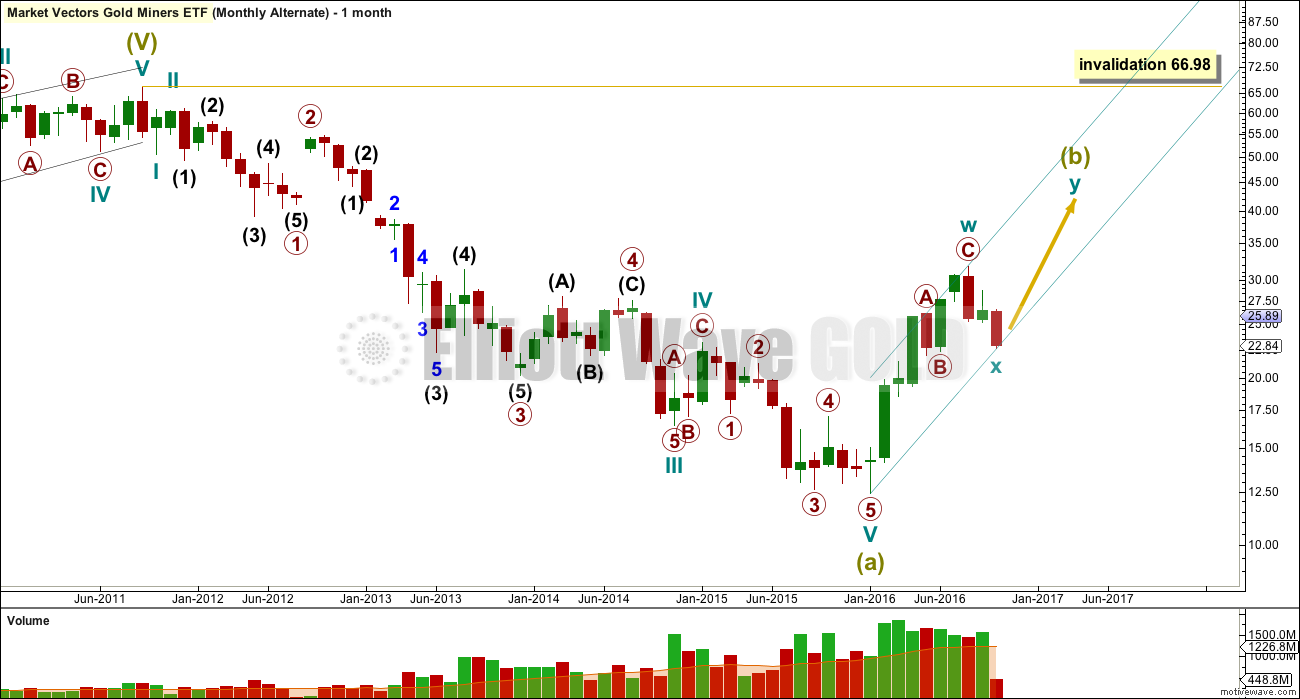
If the degree of labelling from the low for GDX at 12.40 in January 2016 is moved down one degree, the zigzag up from that low may be only the first zigzag in a double zigzag for Super Cycle wave (b). It may also be a zigzag for wave A of a flat correction, or a zigzag for wave A of a triangle, or a zigzag as the first structure for a double combination.
If Super Cycle wave (b) is incomplete and is continuing further, then there are more than 23 possible structures it may be. None of these may be fully eliminated at this stage. Flexibility is required when analysing B waves; they exhibit the greatest variety in form and structure of all Elliott waves.
ALTERNATE DAILY ELLIOTT WAVE COUNT
Click chart to enlarge.
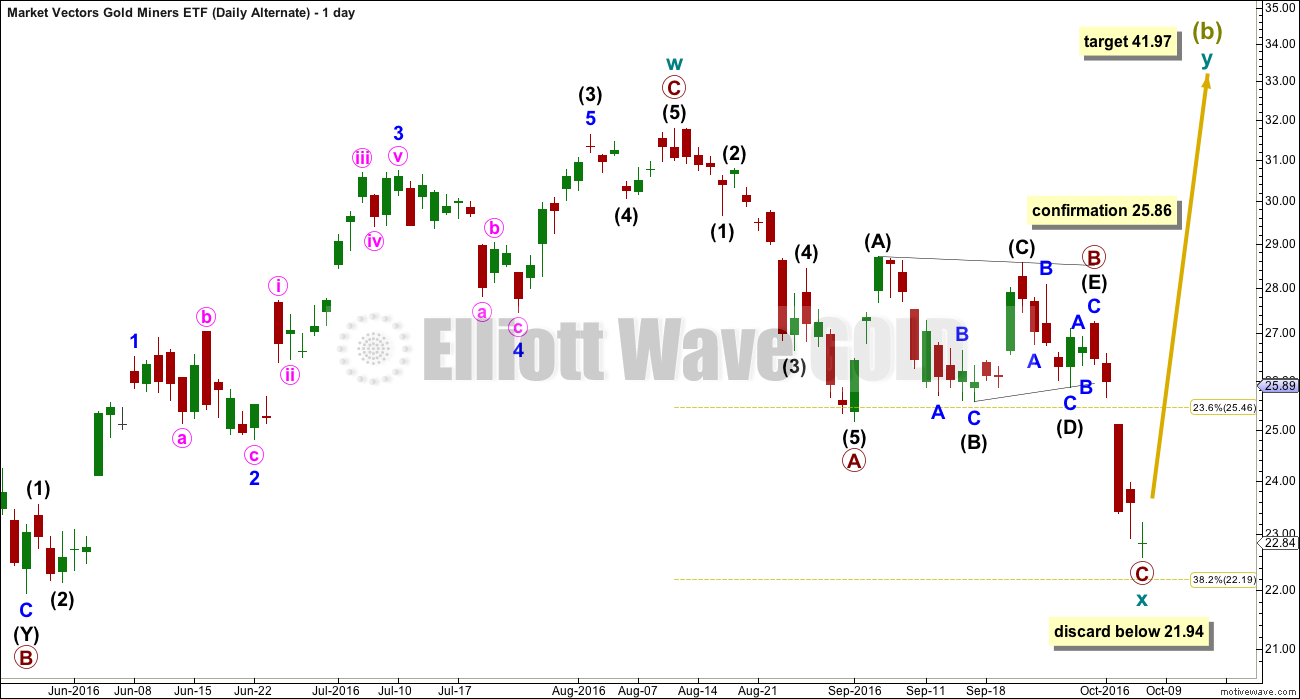
If the first zigzag upwards is not the end of the correction, then the following wave down should be a three and not a five.
For GDX, as well as Silver and Gold, recent sideways movement fits neatly as a contracting triangle. This strongly suggests a three down is unfolding because a second wave may not have its sole corrective structure as a triangle, so this triangle may not be a second wave. If it is accepted that a triangle recently completed, then it may only be a B wave.
A zigzag downwards may be either complete or very close to completion. If it is over here, then a double zigzag is suggested for the larger structure for Super Cycle wave (b).
When the first zigzag does not move price deep enough, then a second zigzag may be required to deepen the correction. Double zigzags have a clear slope exactly as single zigzags. To achieve this look and the purpose of the second zigzag to deepen the correction their X waves are normally brief and should be shallow. So far cycle wave X is shallow. If it were to be much deeper, then primary wave C would be much longer than equality in length than primary wave A. This is possible, but it is more likely that if a zigzag is unfolding downwards that primary wave C would be close to equality in length with primary wave A.
The second zigzag in the double may be about even in length with the first. This gives a target at 41.97. If cycle wave X moves any lower, this target must also move correspondingly lower.
If cycle wave X moves beyond the start of primary wave C within cycle wave W, then the idea of a double zigzag should be discarded.
At that stage, it would still be possible that Super Cycle wave (b) may be continuing further as a flat, triangle or combination, and all of those structures would require cycle wave x or b within it to be much deeper.
TECHNICAL ANALYSIS
DAILY
Click chart to enlarge.
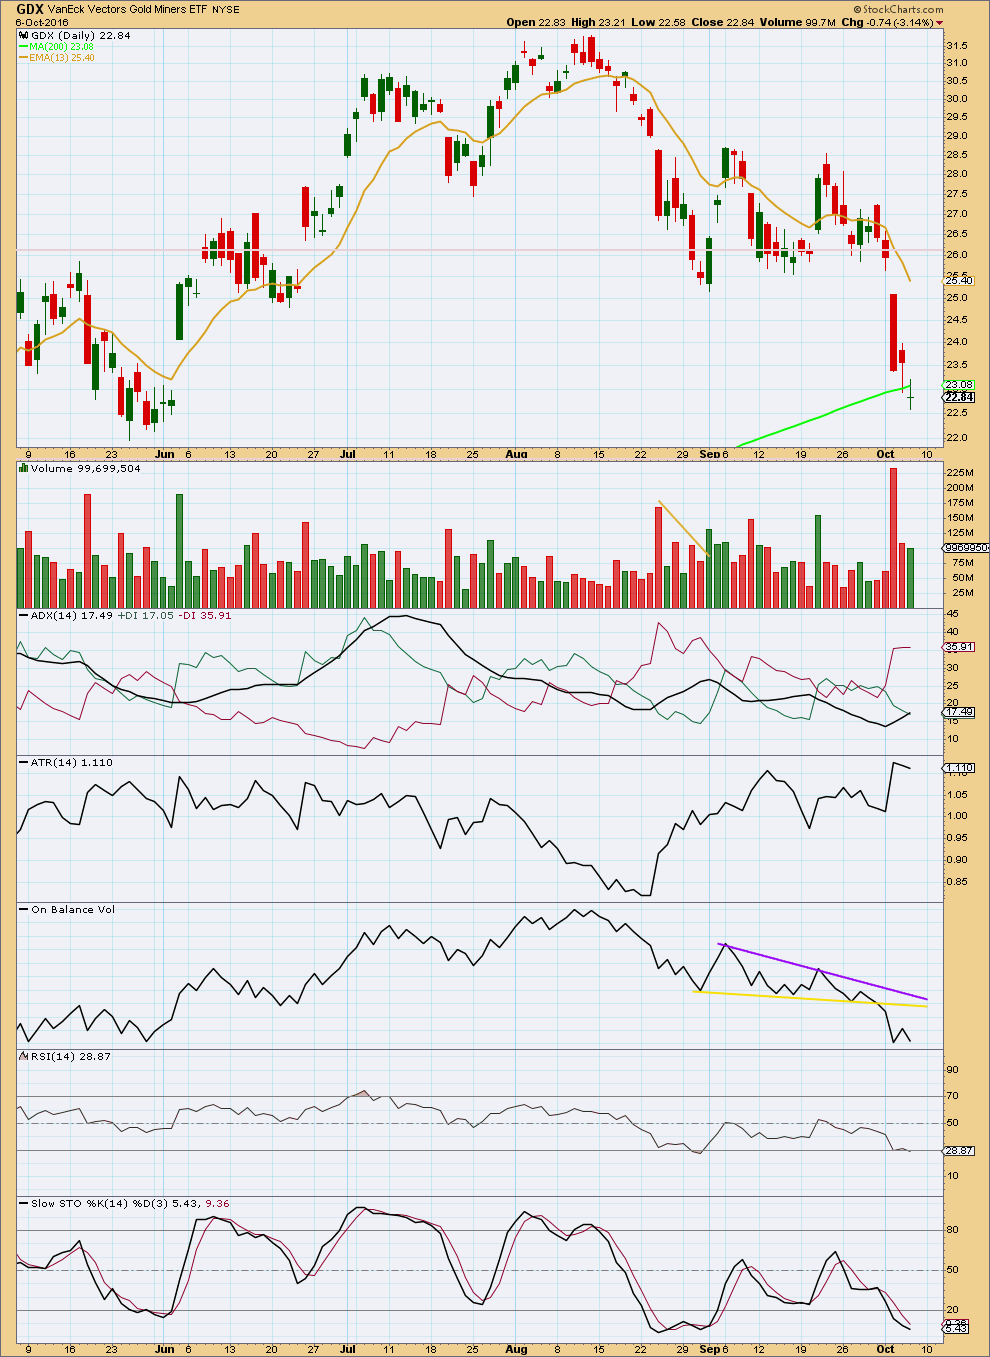
The strong volume spike for the 4th of October indicates a strong support for the fall in price. The following day showed a decline in support for the fall in price, but volume was still reasonable. The small green doji comes with lighter volume and represents a pause and not necessarily a trend change. It has been followed by another downwards day for the 7th of October, so no candlestick reversal pattern is yet evident.
ADX is increasing and the -DX line is above the +DX line. A downwards trend is indicated.
ATR is increasing in agreement with ADX. Bollinger Bands are widening as volatility increases. It is reasonable to conclude at this stage that GDX is in a downwards trend and not a counter trend pullback.
On the 3rd of October, On Balance Volume broke below the yellow support line delineating the last small consolidation for OBV. This was the only warning of what happened next: the strong fall of price the following day for the 4th of October.
As OBV develops a new consolidation new trend lines should be drawn about it. Once that can be done, then careful attention to support and resistance by OBV may indicate the next movement for price.
RSI is entering oversold. This downwards trend may be interrupted by a bounce soon to relieve extreme levels.
This analysis is published @ 04:10 a.m. EST.
Lara, thanks for the GDX update. Much appreciated.
One thought that has crossed my mind regarding the GDX. It seem to be some sort of leading indicator of gold sometimes. I.e. the Brexit gains were erased some time ago while the same just recently happened in gold.
Miners did not throw in a lower low today although gold did.
We got a close above the blue trendline, and since this is the end of the week; a bullish close.
Notice how that price breached the trendline which often happens during ICL. I guess also this is a part of the process; to get everyone bearish so that the trade get some momentum to the upside when it reverses. Notice that price exactly hit the “max” fib retracement today from its previous ICL.
The USD had its 3rd attempt to break the longer trendline. It failed to close above it. Looking at its previous cycle, it went down into its ICL after trying the 3rd time. It succeeded the 4th time though. This movement in the dollar support upward movement in gold for the coming period in my opinion.
I realized I posted this at the wrong page, it was meant for the gold, not the GDX forum