
Upwards movement was expected from both the main and alternate Elliott wave counts in yesterday’s analysis.
The two Elliott wave counts now diverge. Invalidation and confirmation points will be used to let price tell us which one is correct. And classic technical analysis, particularly volume analysis, will be used to judge the probability of each Elliott wave count.
Summary: A new low below 1,258.38 would confirm the main wave count. The target is at 1,227. If this target is wrong, it may not be low enough. It is possible that a swift strong extended fifth wave may unfold lower. If price moves above 1,306.70, the alternate bullish wave count would be confirmed, so look out for a swift strong third wave to end upwards.
New updates to this analysis are in bold.
Grand SuperCycle analysis is here.
The last published monthly chart may be seen here.
To fit daily charts into the bigger picture see last analysis of weekly charts here.
DAILY ELLIOTT WAVE COUNT
Click chart to enlarge.
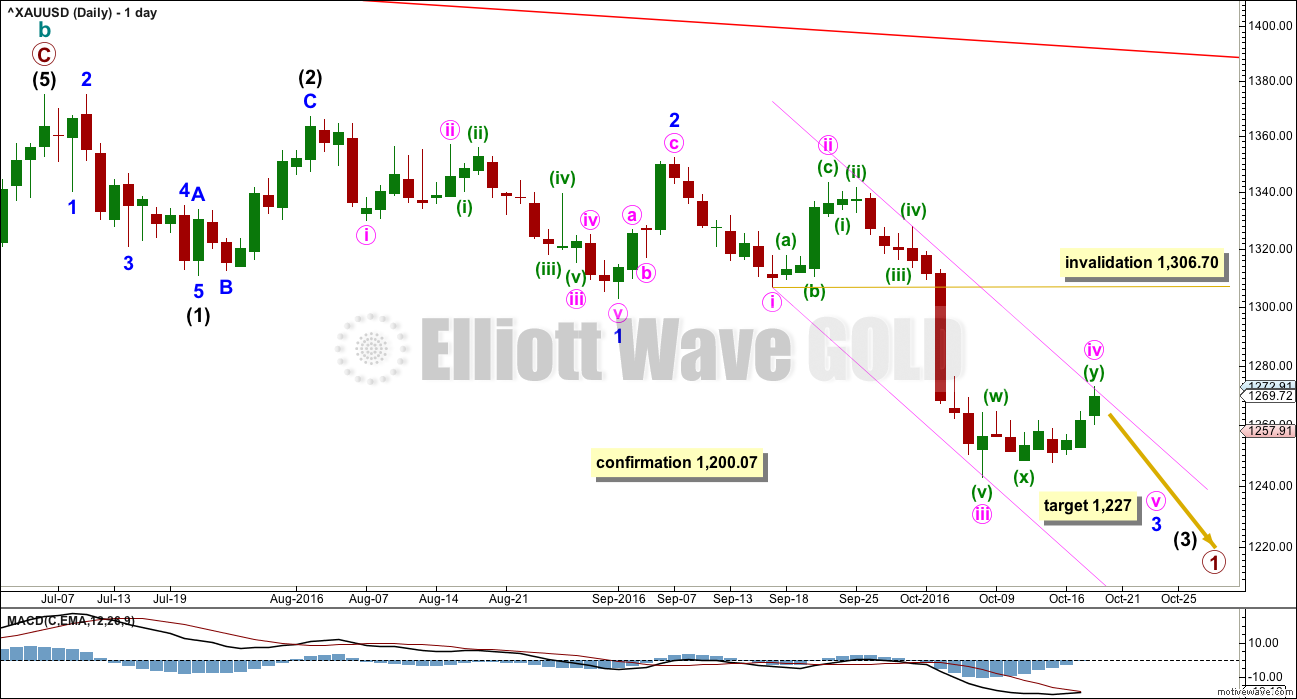
The movement up from the low of 1,046 on the 3rd of December, 2015, subdivides 5-3-5. Current downwards movement is too deep to reasonably be considered a second wave correction (that idea has been discarded based upon an exceptionally low probability), so the movement up from 1,046 is seen as a complete zigzag. This may be either the entirety of a correction, or it may be the first zigzag in a double zigzag. This main wave count looks at it as an entire correction.
If there has been a trend change at a large degree at the last high, then what looks like a rather obvious triangle must be ignored. It is possible that a series of three overlapping first and second wave corrections has unfolded, but this does look less likely than a triangle.
The triangle may not be labelled as a second wave because second waves do not take the form of triangles.
This wave count is reverted to see minor wave 3 incomplete and minute wave iv within it now unfolding. There is no Fibonacci ratio between minute waves i and iii.
Minute wave iv may not move into minute wave i price territory above 1,306.70.
Minute wave ii was a deep 0.81 zigzag lasting four days. Minute wave iv is least likely to be a zigzag to exhibit alternation and most likely to be a sideways flat, combination or triangle. It may last a bit longer than minute wave ii as sideways structures tend to be longer lasting than zigzags. If it exhibits a Fibonacci duration of eight days, then it should be over now.
The pink channel is a best fit. Minute wave iv may have ended a little higher than expected, finding strong resistance at the upper edge of this channel.
HOURLY ELLIOTT WAVE COUNT
Click chart to enlarge.
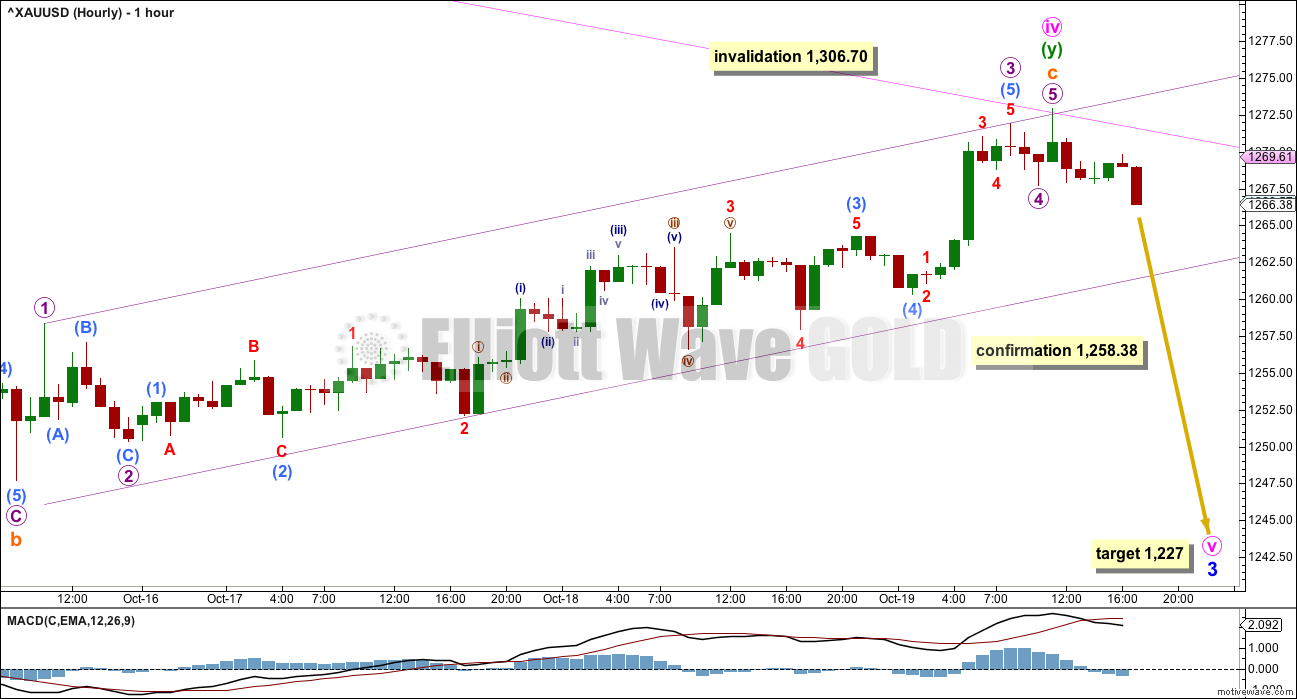
If minute wave iv is unfolding as a combination, then the first structure in the double combination may have been a quick zigzag labelled minuette wave (w) (seen on the daily chart today).
The double may be joined by a three in the opposite direction labelled minuette wave (x).
X waves within multiples may subdivide as any corrective structure, including a multiple. The rule stating the maximum number of corrective structures in a multiple refers to W, Y and Z. It does not include the X waves which move in the opposite direction and join the structures in the multiple (otherwise the maximum would not be three and would be five).
Within corrective structures of multiples labelled W, Y and Z, they may only be simple corrective structures labelled A-B-C (or A-B-C-D-E in the case of triangles). They may not be labelled themselves as multiples W-X-Y (X-Z) because to do so would increase the maximum beyond three and violate the rule.
The second structure in this possible double combination is labelled minuette wave (y) and may be unfolding as a regular flat correction. Within minuette wave (y), subminuette wave a is a three wave structure and subminuette wave b is also a three wave structure, at 1.02 length of subminuette wave a, indicating a regular flat.
The structure of subminuette wave c is now complete as a five wave impulse. Subminuette wave c exhibits no Fibonacci ratio to subminuette wave a. Subminuette wave c is longer than C waves of regular flats normally are; it is slightly longer than 1.618 the length of subminuette wave a.
Minuette wave (y) has moved reasonably above the end of minuette wave (w). Overall, minute wave iv has mostly a sideways look, but the depth of minuette wave (y) does give this combination a slightly atypical look. No Elliott wave rules are broken, but the guideline of a sideways movement is not strictly met. Sometimes combinations are not perfect.
Minute wave v should now have begun. A target of equality in length with minute wave i is used in this instance because Stochastics is still so close to oversold. However, if this target is wrong, it is possible that it may be too high. It is still possible that minute wave v downwards to end minor wave 3 could be a swift strong extended wave, typical of commodities. It is possible for this main wave count that we could see a strong surprise to the downside in the next one or two days.
Minute wave iv may not move into minute wave i price territory above 1,306.70.
ALTERNATE II DAILY ELLIOTT WAVE COUNT
Click chart to enlarge.
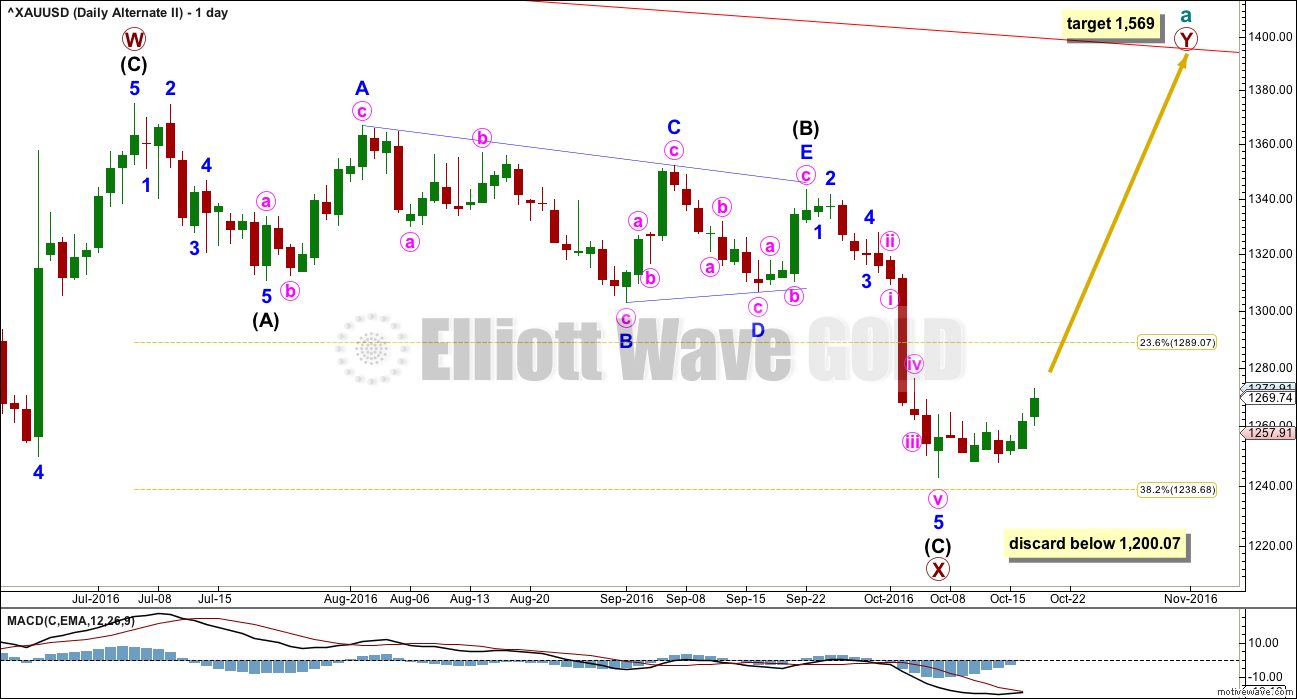
What if the zigzag upwards from the low of 1,046 on the 3rd of December, 2015, is only the first zigzag in a double?
There is no rule stating a limit for X waves within double zigzags or double combinations. To achieve the purpose of a double zigzag, which is to deepen a correction, their X waves should be relatively brief and shallow. It would be highly unusual and defeat the purpose if primary wave X moved beyond the start of intermediate wave (C) of primary wave W below 1,200.07. This wave count should be discarded below that point.
Primary wave X is seen as a zigzag. Within primary wave X, intermediate wave (B) fits neatly as a triangle. This is supported by MACD hovering about zero as it unfolded. Any wave count which sees a triangle in this position should have a higher probability than a wave count which does not.
The zigzag downwards for primary wave X may again be complete, at all time frames. A target for primary wave Y upwards would be about 1,569 where primary wave Y would be about even in length with primary wave W.
ALTERNATE II HOURLY ELLIOTT WAVE COUNT
Click chart to enlarge.
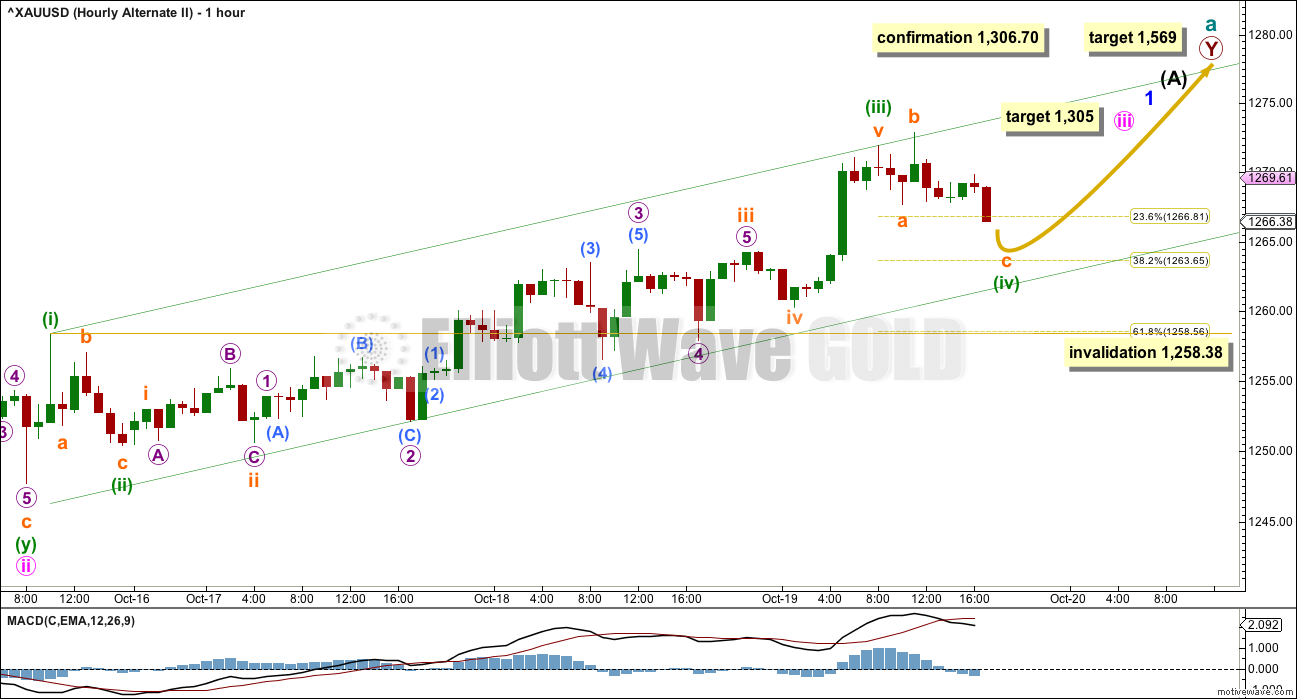
Minute wave iii must move beyond the end of minute wave i above 1,264.72. It must move far enough above that point to allow room for a subsequent correction for minute wave iv to unfold and remain above minute wave i price territory. It has not done that yet.
The conclusion is that more upwards movement is most likely to see minute wave iii come to an end.
Within minute wave iii, subdivisions of this upwards wave are seen mostly the same as the main hourly wave count. The key difference today is the correction for minuette wave (iv). This alternate sees it as incomplete.
Minuette wave (ii) was a deep 0.75 zigzag. Given the guideline of alternation, minuette wave (iv) may be expected to most likely be a sideways and shallow flat, combination or triangle. At this stage, it looks like it may be unfolding as an expanded flat.
Minuette wave (iv) may end about the 0.382 Fibonacci ratio at 1,264. This would see it end within the price territory of the fourth wave of one lesser degree: subminuette wave iv’s territory is from 1,264.22 to 1,260.28.
When minuette wave (iv) is complete, then minuette wave (v) upwards should begin.
Minuette wave (v) is a fifth wave to end a third wave impulse. For Gold these are often very swift and strong. Minuette wave (v) may end with a blowoff top. Look out for a surprise to the upside for this wave count in the next one or two days.
At 1,305 minute wave iii would reach 2.618 the length of minute wave i. If price keeps rising through this first target, then the next target would be at 1,340 where minute wave iii would reach 4.236 the length of minute wave i. This higher target is possible if minuette wave (v) is a long strong extension, and because minute wave i was relatively short.
At 1,569 primary wave Y would reach equality in length with primary wave W.
TECHNICAL ANALYSIS
WEEKLY CHART
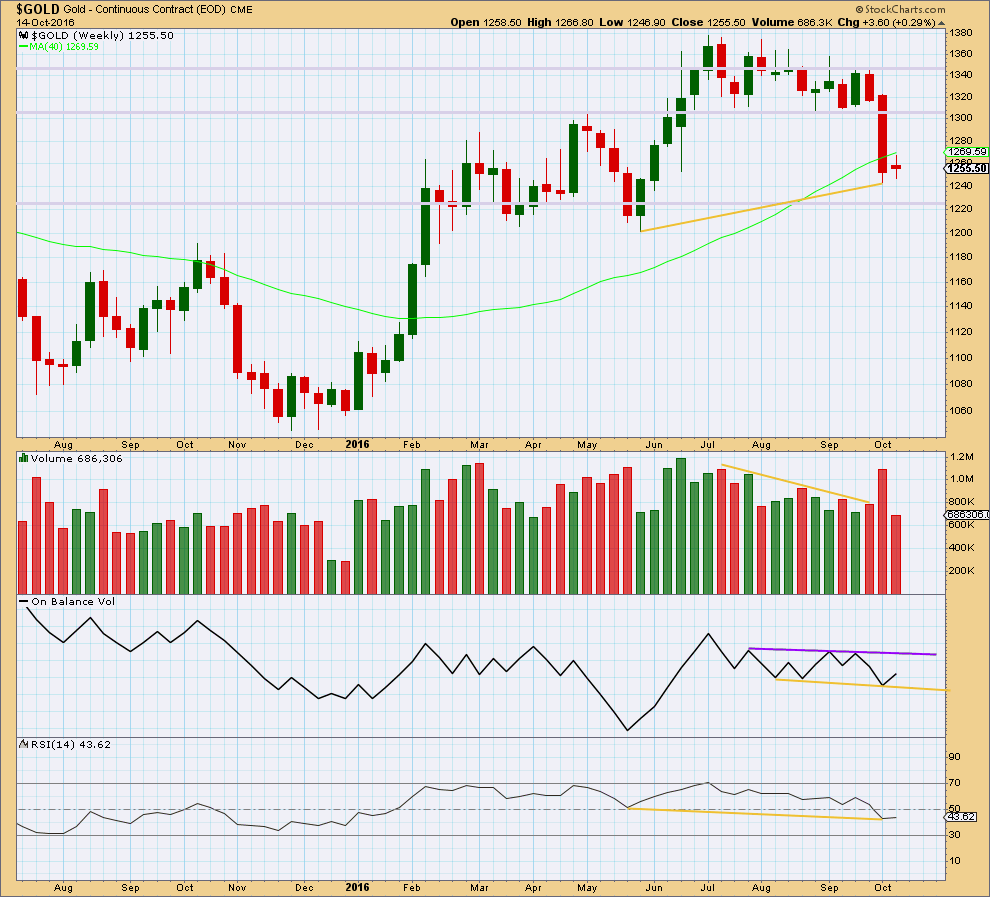
Click chart to enlarge. Chart courtesy of StockCharts.com.
A small range week with light volume indicates a pause within a new downwards trend.
On Balance Volume remains constrained within support and resistance lines. These lines are slightly redrawn this week.
There is still mid term divergence between price and RSI: price has made a higher low, but RSI has made a lower low (yellow lines).
DAILY CHART
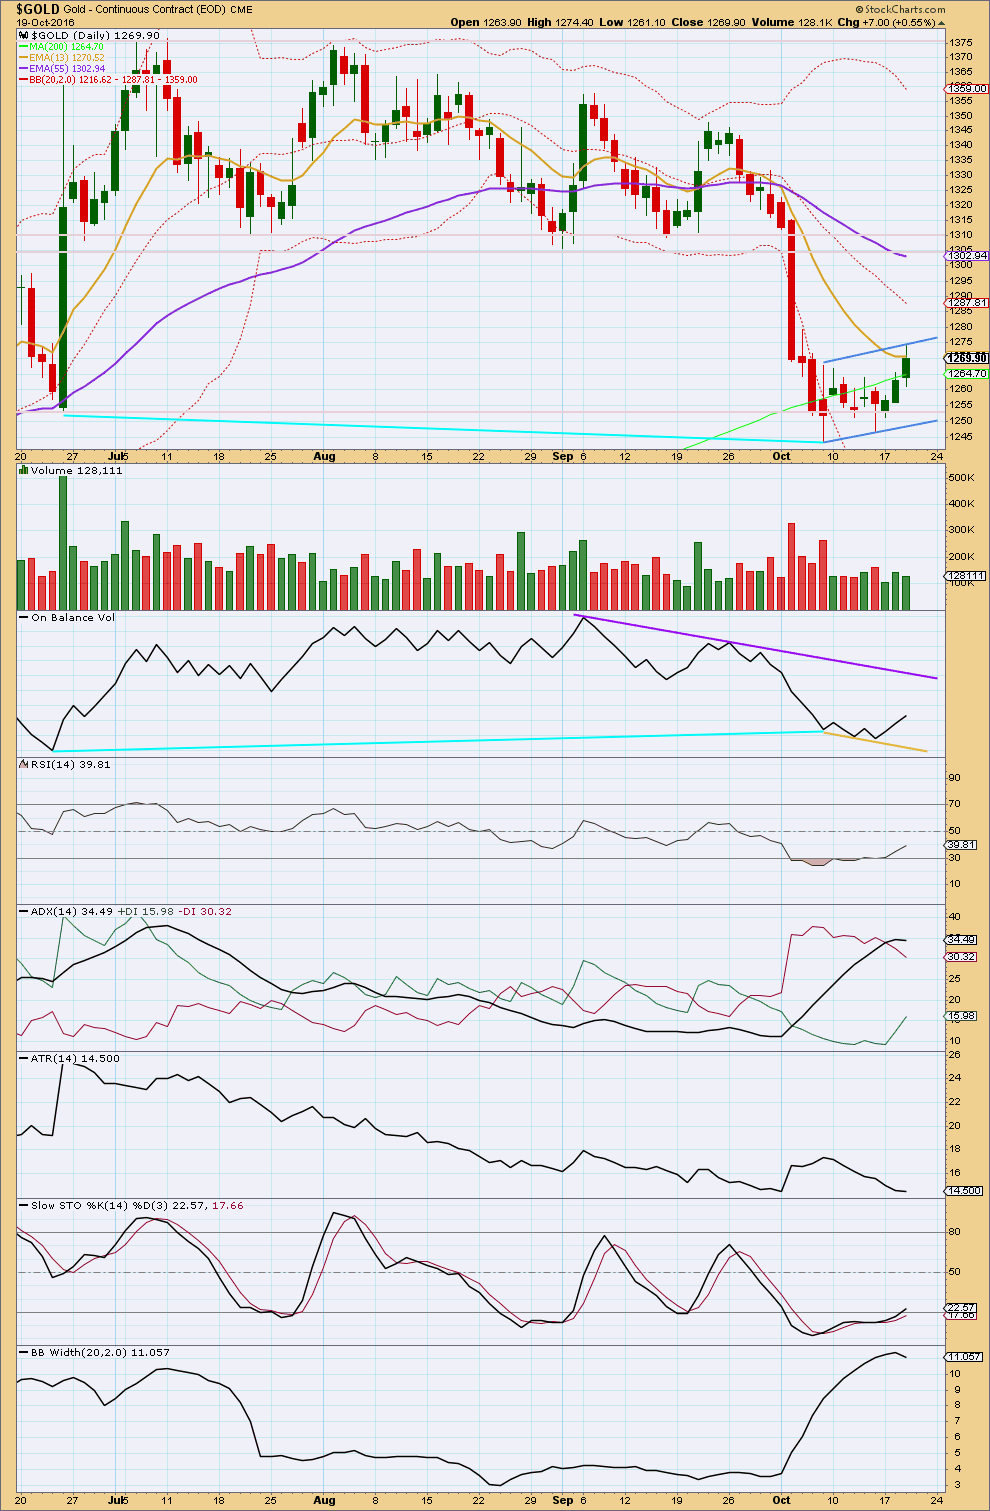
Click chart to enlarge. Chart courtesy of StockCharts.com.
Upwards movement today very importantly comes with lighter volume. The rise in price is not supported by volume, so this does not look like an upwards breakout from the pattern that was considered an unfolding pennant in yesterday
s technical analysis.
The trend lines on this small consolidation are redrawn today. A small bear flag may be completing. So far, within this movement, volume is steady to slightly declining.
Flags and pennants are the most reliable of continuation patterns. Flags normally slope against the main trend, and they should be characterised by light and declining volume. When they are, then the probability of a continuation is higher. That is the case with this potential flag pattern.
The trend lines on On Balance Volume are redrawn again today. The short trend lines drawn yesterday have served their purpose, but were too brief for reasonable technical significance. I cannot find another resistance line close by, so the conclusion is there may not be resistance at this time for OBV.
The last few days have brought RSI back up more into normal territory. There is again room for price to fall.
Stochastics is almost into normal territory. This oscillator may remain extreme for reasonable periods of time during a trending market though.
ADX is flat today indicating the market may not be trending. It has not indicated a trend change though because the -DX line is still above the +DX line. ATR is still flat to declining, and today Bollinger Bands contracted.
All three of these indicators (ADX, ATR, BBs) point to a consolidating market. With price moving overall sideways and now slightly higher for one session, it is reasonable to conclude that a small consolidation is concluding and will be followed by more downwards movement.
This classic technical analysis supports the main bearish wave count over the alternate bullish wave count today.
This analysis is published @ 06:37 p.m. EST.
Main hourly chart updated:
A slight overshoot of the best fit pink channel is not very concerning at this stage. Fourth waves don’t always fit neatly within channels. If price starts to move strongly higher, and in fact, at this point if we get another green daily candlestick, then this main wave count is going to really reduce in probability.
If we can see even one day with upwards movement having good support from volume then this wave count would really decrease in probability
Conversely, a red daily candlestick with an increase in volume would increase probability.
What happens tomorrow may give us information to start to make judgements as to whether this wave count or the alternate should be traded. Right now, this main wave count still has more support from volume, in that the rise in price has no support and so should be considered a counter trend movement until proven otherwise.
That is the evidence in hand up to yesterday’s daily candlestick.
Alternate hourly updated:
It still needs a strong extended fifth wave to take the impulse of minute wave iii far enough above the end of minute wave i to allow room for the next correction of minute iv to unfold.
In short, it’s gotta go higher and we should see an increase in strength. Stronger momentum, stronger RSI, support from volume. Maybe a blowoff top.
The invalidation point is still the same. If price moves below 1,258.38 this wave count is invalid and the bearish / main wave count is confirmed.
This is how I see the bullish hourly count with approximate path shown. The next few days should be interesting. The bears still have a chance, but I like the bull count at this point.
Dreamer, thank you very much for sharing your work. I am sure members appreciate your generosity as much as I do 🙂
The small inverted H&S pattern had a clean break to the upside and then back-tested the neckline intraday.
GDX has had a strong rebound the last few days and looks pretty bullish. Lets see if it can lead gold up.
> PRICE had a clean breakout to the upside and negated the potential bear flag
> VOLUME has increased the last two days, supporting the move up
> RSI has broken through down-sloping resistance and is now just under 50
> MACD signal line is positive and the histogram has turned positive
> OBV has broken above down-sloping and horizontal resistance
> Slow Stochastics has moved above 20
I agree, it looks bullish.
For GDX I’d give a fair amount of weight to that trend line breach by On Balance Volume. That’s often (not always) a pretty good signal.
I notice ADX has indicated a trend change too for GDX.
Two causes for concern today:
1. Bollinger Bands showed a reasonable contraction. That’s not good if this trend is healthy. But then, only one day of data is not enough to draw a firm conclusion.
2. While price is rising ATR is declining. If this is a new upwards trend then it’s not very healthy. But, that could change.
Lara, thanks for adding your thoughts on GDX. They are always very helpful for those of us that trade the miners.