
Both Elliott wave counts remain viable.
Classic technical analysis continues to support the main Elliott wave count.
Summary: A new low below 1,258.38 would confirm the main wave count. The target is at 1,227. If this target is wrong, it may not be low enough. It is possible that a swift strong extended fifth wave may unfold lower. If price moves above 1,306.70, the alternate bullish wave count would be confirmed, so look out for a swift strong third wave to end upwards. Classic technical analysis still supports a bearish outlook.
New updates to this analysis are in bold.
Grand SuperCycle analysis is here.
The last published monthly chart may be seen here.
To fit daily charts into the bigger picture see last analysis of weekly charts here.
DAILY ELLIOTT WAVE COUNT
Click chart to enlarge.
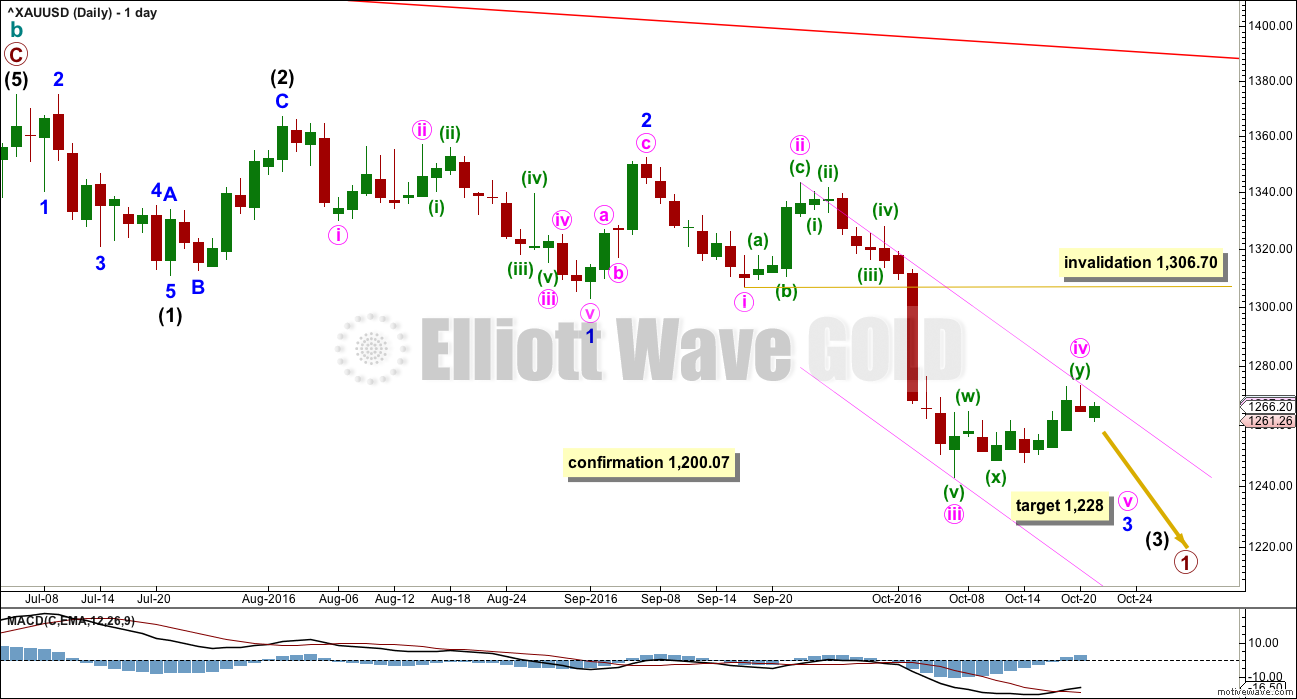
The movement up from the low of 1,046 on the 3rd of December, 2015, subdivides 5-3-5. Current downwards movement is too deep to reasonably be considered a second wave correction (that idea has been discarded based upon an exceptionally low probability), so the movement up from 1,046 is seen as a complete zigzag. This may be either the entirety of a correction, or it may be the first zigzag in a double zigzag. This main wave count looks at it as an entire correction.
If there has been a trend change at a large degree at the last high, then what looks like a rather obvious triangle must be ignored. It is possible that a series of three overlapping first and second wave corrections has unfolded, but this does look less likely than a triangle.
The triangle may not be labelled as a second wave because second waves do not take the form of triangles.
This wave count is reverted to see minor wave 3 incomplete and minute wave iv within it now unfolding. There is no Fibonacci ratio between minute waves i and iii.
Minute wave iv may not move into minute wave i price territory above 1,306.70.
Minute wave ii was a deep 0.81 zigzag lasting four days. Minute wave iv is least likely to be a zigzag to exhibit alternation and most likely to be a sideways flat, combination or triangle. It may last a bit longer than minute wave ii as sideways structures tend to be longer lasting than zigzags. It may now be a complete double combination lasting nine days and not exhibiting a Fibonacci duration.
The pink channel is redrawn today using Elliott’s second technique. Draw the first trend line from the ends of minute waves ii to iv, then place a parallel copy on the end of minute wave iii. Minute wave v may find some support about the lower edge.
HOURLY ELLIOTT WAVE COUNT
Click chart to enlarge.
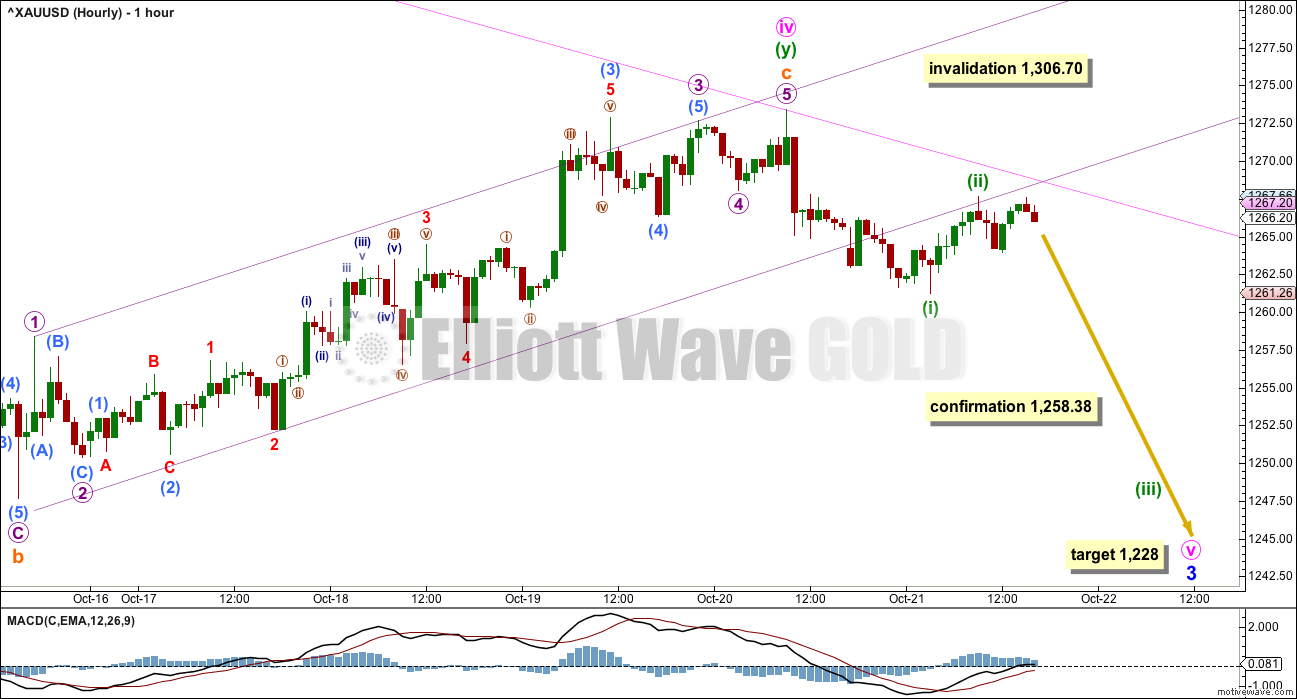
Minute wave iv fits still as a double combination. The first structure in the double was a relatively quick zigzag labelled minuette wave (w). The second structure in the double fits as a regular flat correction labelled minuette wave (y).
Minuette wave (y) was expected to end about the same level as minuette wave (w) at 1,264.72, so that the combination had a sideways look to it, which would be typical. However, minuette wave (y) has ended somewhat above minuette wave (w); so far it is 8.69 above. This gives the combination an upwards slope against the prior trend. This wave count is still valid, combinations do not always look perfect, but the slope must necessarily reduce the probability a little.
There is alternation between the relatively quick deep 0.81 zigzag of minute wave ii and the more time consuming shallow 0.30 combination of minute wave iv.
The pink channel is copied over from the daily chart. If this wave count is correct, then the upper edge may now provide resistance.
The violet upwards sloping channel is a best fit about subminuette wave c. This channel is now breached by downwards movement offering a very early indication of a possible trend change. If the lower edge continues to provide resistance, then this wave count would increase in probability.
A new low below 1,258.38 would invalidate the alternate below and provide reasonable price confirmation of this main wave count.
At 1,228 minuete wave v would reach equality in length with minute wave i.
Minute wave iv may not move into minute wave i price territory above 1,306.70.
ALTERNATE II DAILY ELLIOTT WAVE COUNT
Click chart to enlarge.
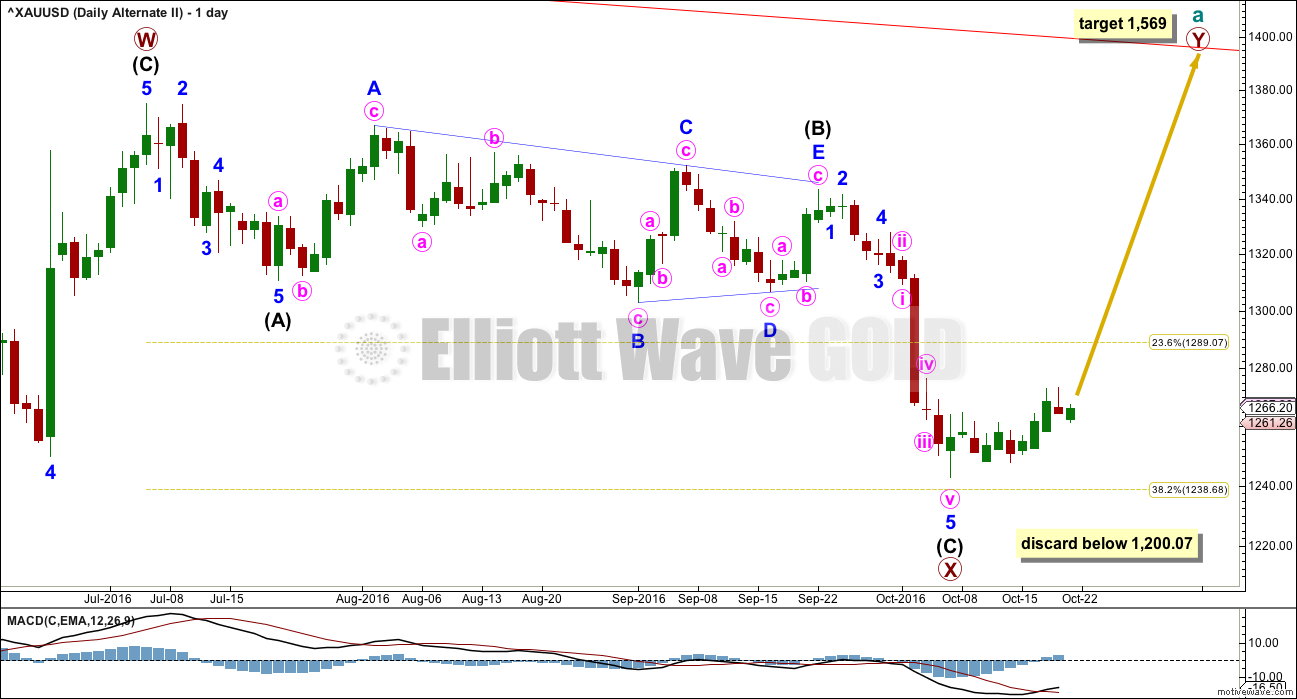
What if the zigzag upwards from the low of 1,046 on the 3rd of December, 2015, is only the first zigzag in a double?
There is no rule stating a limit for X waves within double zigzags or double combinations. To achieve the purpose of a double zigzag, which is to deepen a correction, their X waves should be relatively brief and shallow. It would be highly unusual and defeat the purpose if primary wave X moved beyond the start of intermediate wave (C) of primary wave W below 1,200.07. This wave count should be discarded below that point.
Primary wave X is seen as a zigzag. Within primary wave X, intermediate wave (B) fits neatly as a triangle. This is supported by MACD hovering about zero as it unfolded. Any wave count which sees a triangle in this position should have a higher probability than a wave count which does not.
The zigzag downwards for primary wave X may again be complete, at all time frames. A target for primary wave Y upwards would be about 1,569 where primary wave Y would be about even in length with primary wave W.
ALTERNATE II HOURLY ELLIOTT WAVE COUNT
Click chart to enlarge.
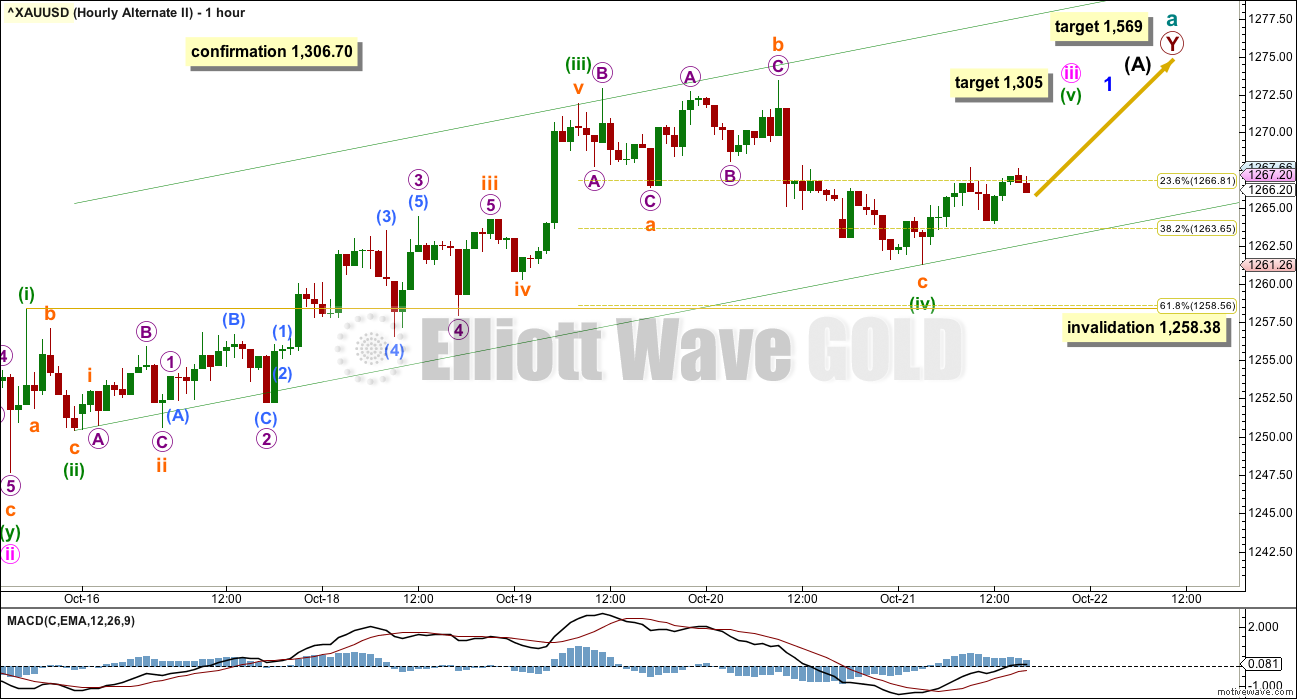
Minute wave iii must move beyond the end of minute wave i above 1,264.72. It must move far enough above that point to allow room for a subsequent correction for minute wave iv to unfold and remain above minute wave i price territory. It still has not done that yet.
The conclusion is that more upwards movement is most likely to see minute wave iii come to an end.
Downwards movement for Friday’s session may have been a continuation of minuette wave (iv) as an expanded flat correction. Minuette wave (iv) may have ended close to the 0.382 Fibonacci ratio of minuette wave (iii) and within the price territory of the fourth wave of one lesser degree.
With minuette wave (iv) moving lower, the green channel for this alternate wave count is redrawn using Elliott’s second technique. If this wave count is correct, then the lower edge should now provide support. Minuette wave (iv) should be over for this wave count because it is already longer in duration to minuette wave (ii). If it were to continue further, it would start to be disproportionate to minuette wave (ii) giving the wave count the wrong look.
Minuette wave (v) is a fifth wave to end a third wave impulse. For Gold these are often very swift and strong. Minuette wave (v) may end with a blowoff top. Look out for a surprise to the upside for this wave count in the next one or two days.
At 1,305 minute wave iii would reach 2.618 the length of minute wave i. If price keeps rising through this first target, then the next target would be at 1,340 where minute wave iii would reach 4.236 the length of minute wave i. This higher target is possible if minuette wave (v) is a long strong extension, and because minute wave i was relatively short.
At 1,569 primary wave Y would reach equality in length with primary wave W.
TECHNICAL ANALYSIS
WEEKLY CHART
Click chart to enlarge. Chart courtesy of StockCharts.com.
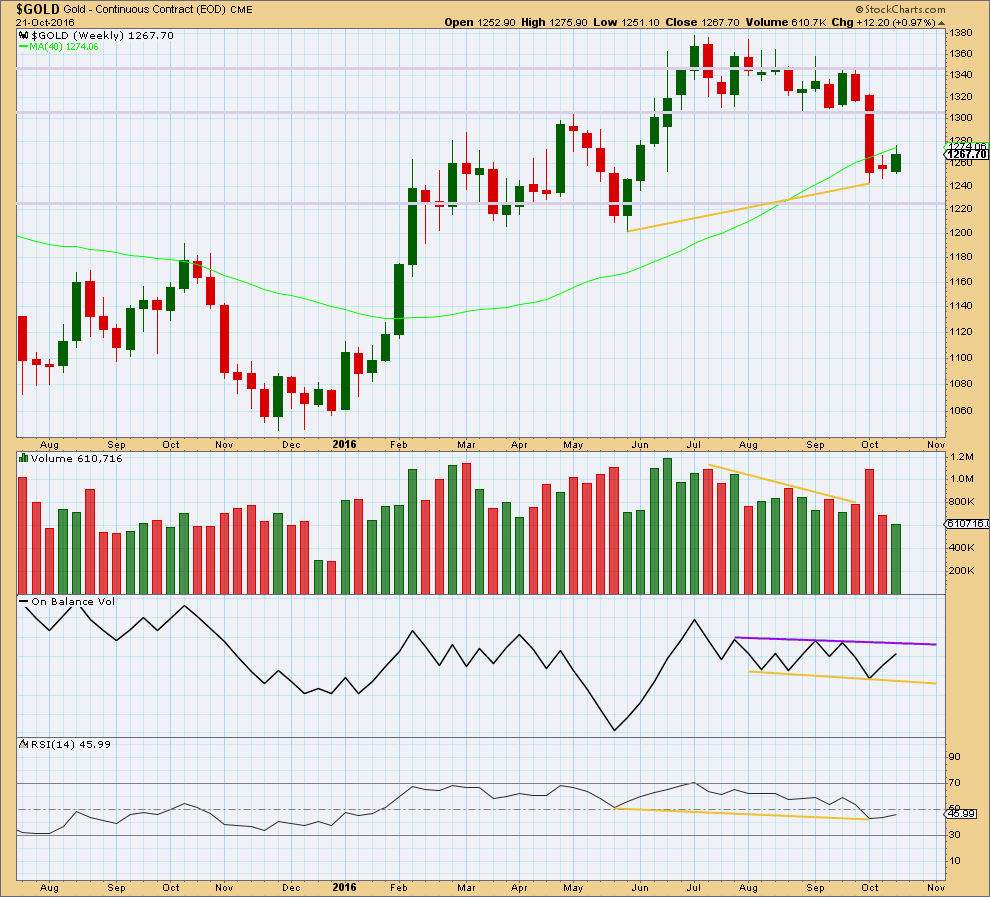
An upwards week shows a further decline in volume. This supports the main bearish Elliott wave count.
Two small range weeks in a row have moved price sideways and slightly higher. This looks like a small consolidation at this stage and not necessarily a new upwards trend.
On Balance Volume remains constrained within support and resistance lines.
The divergence noted with yellow lines between price and RSI at the last two swing lows is bullish. It indicates weakness in price. This supports the alternate Elliott wave count.
DAILY CHART
Click chart to enlarge. Chart courtesy of StockCharts.com.
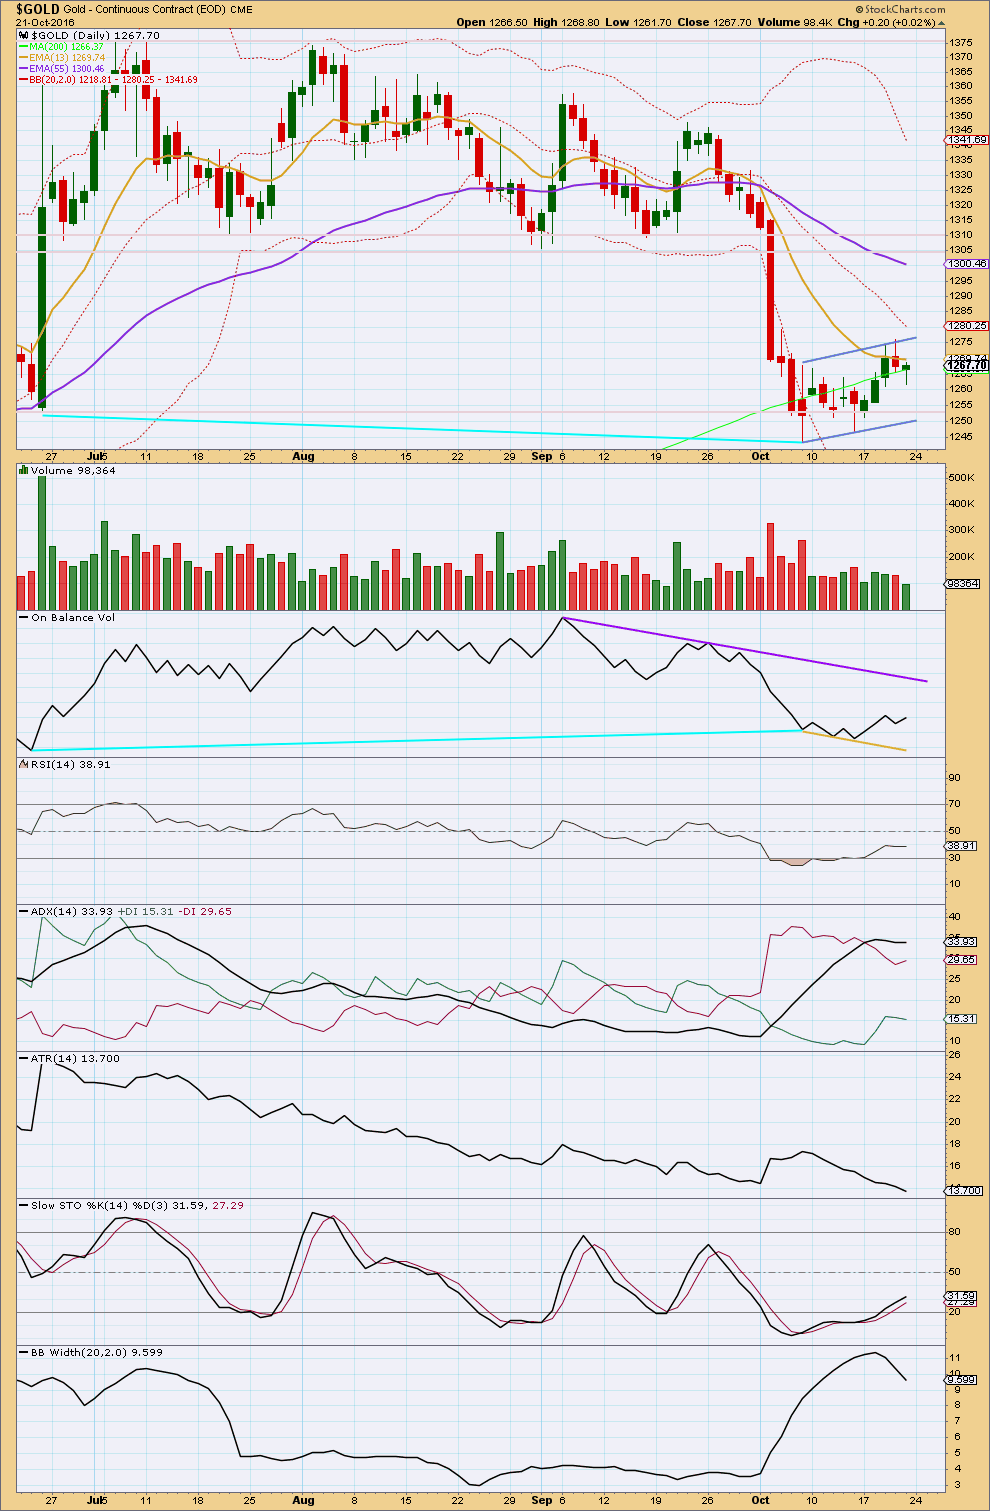
Volume shows a further decline for Friday with another small range day that completed a hanging man. However, this pattern comes after only a very small rise in price and essentially within a consolidation. So it should not be read as a reversal signal.
It sill looks like a small bear flag pattern is forming.
Flags and pennants are the most reliable of continuation patterns. Flags normally slope against the main trend, and they should be characterised by light and declining volume. When they are, then the probability of a continuation is higher. That is the case with this potential flag pattern.
On Balance Volume still has some distance to go before it finds resistance. The yellow line should provide some support.
The last few days have brought RSI back up more into normal territory. There is again room for price to fall.
Stochastics is now within normal territory. This oscillator may remain extreme for reasonable periods of time during a trending market though.
ADX is slightly declining, indicating the market may not be trending. It has not indicated a trend change though because the -DX line is still above the +DX line. ATR is still declining, and today Bollinger Bands contracted further.
All three of these indicators (ADX, ATR, BBs) point to a consolidating market. With price moving overall sideways and now slightly higher, it is reasonable to conclude that a small consolidation is concluding and will be followed by more downwards movement.
This classic technical analysis still supports the main bearish wave count over the alternate bullish wave count today.
This analysis is published @ 02:34 a.m. EST on 22nd October, 2016.
For the main bearish wave count: today’s spike may have been the end of a second wave correction. A third wave down may now be beginning.
The target is the same. The confirmation point is changed, now it is 1,247.67
I am adjusting the bullish alternate today. This movement is too large to be a continuation of a fourth wave within an impulse unfolding upwards, the impulse looks complete. This looks like another wave.
So I’ll see another first wave complete up, and this movement may be a second wave.
If it remains within it’s small channel it may end about the 0.618 Fibonacci ratio at 1,259.
Unfortunately this means the lower confirmation / invalidation point must now move down to 1,247.67. Minuette wave (ii) may not move beyond the start of minuette wave (i).
GDX failed to make a new high today before turning lower which likely means it goes below 22.5 before finding a bottom
Or… It was backtesting 10 DMA @ 50 % FIB retracement from the bottom to its current top 🙂 It held.
It is above 200 DMA.
Miners have led gold before and I think they will do it again.
My view is that gold has a date still with 1268 which is a transition that was not tested in its fall today.
I am getting bullish in all this bearism!
Very funny line but it makes sense.
“I am getting bullish in all this bearism!”
When sentiment is at a bearish high it starts turning bullish.
A picture says more than 1000 words 😀
GDX close 🙂
Yes, I like the cup and handle. Just wondering with the false break up today if we go lower first?
We could make another trip to the bottom trend line of the handle, but a confirmed break above the handle would be bullish.
Any wave counts?
What is with the $9 sudden spike in gold at 6:52 am from 1,262.31 up to 1,271.53 at 8:06 am EST?
I thought a bearish drop was preferred?
I don’t see any major news at about 8:00 am that may of been part of or timing of the Elliott Wave move up then?
Lara’s weekend analysis mentioned if the bearish move played out that most likely a drop Monday or else Tuesday.
Sorry but the spike was from 7:52 am at 1262.31 up to 1271.53 at 9:06 am, Barchart doesn’t use EST and is unable to adjust the time zone on it’s XAUUSD live feed, just one of Barchart limitations.
Sentiment Speaks: Is Clinton Or Trump Better For Gold?
Avi Gilburt EW – Oct. 21, 2016 1:11 PM ET
http://seekingalpha.com/article/4013899-sentiment-speaks-clinton-trump-better-gold
Gold To Bottom Out At $775 Says Financial Astrologer
By Sarah Benali of Kitco News
Friday October 21, 2016 12:25
http://www.kitco.com/news/2016-10-21/Gold-Needs-to-Drop-To-775-Before-Bull-Market-Resumes-Financial-Astrologer.html
GUNNER24 Gold – Days of Thunder 10/23/2016
http://www.gunner24.com/newsletter/nl-102316/
Here’s the hourly look. It appears that a small 4th wave triangle may be forming. After a short move up, I expect a second wave correction that may be the last good buying opportunity before a strong move up. Let’s see if GDX likes my proposed path….or not….
just an observation:
Look at the charts of miners IAG and ABX , both charts look as if the upper confirmation has happened. These miners usually run a few days ahead of GDX
Yes, good idea to look at ABX. Looks stronger than GDX since the gap has filled and it is up against the trend line resistance, but I don’t see a channel breach to the upside yet.
GDX seems to be contained within the downtrend channel from the August top and the uptrend channel since January. I think it’s going to take another 2 weeks until we get a clear breakout. As you can see, at this point, I think the breakout when it comes will be to the upside.
Major Bottom in gold coming in mid november. That is what I see with my “third eye”.
Hi. IMO It appears that Gold price is finding support at 1261-60 around 38.2% of weeks H 1275 / L 1250 (just above Lara’s confirmation/invalidation 1258.38) possibly only down to 1255 for bottoming with indications for a rally to most likely ride through resistance clusters in 1270’s and see Gold price reach for 1285-1290. Shorts will probably be better off taking to the sidelines this week. Lets see how this pans out. Just got to play the hand that’s dealt! lol
Steven, what factors did help you decide the bottom is near mid Nov? I’m curious…:)