
Yesterday’s main Elliott wave count expected downwards movement, but this has not happened.
Classic technical analysis will be used today to judge the probability of the main vs. alternate Elliott wave counts.
Summary: A lack of support from volume today is very concerning for any bullish outlook. While this could change quickly, the evidence today is still more bearish than bullish. A bear flag pattern still looks like it is finishing. In the short term, an Elliott wave target for upwards movement to end is at 1,281 – 1,283. Thereafter, a downwards trend is expected to resume. The next wave down is expected to be a fifth wave, and these can be swift and strong for Gold. A new high above 1,306.70 would confirm the alternate Elliott wave count.
New updates to this analysis are in bold.
Grand SuperCycle analysis is here.
The last published monthly chart may be seen here.
To fit daily charts into the bigger picture see last analysis of weekly charts here.
DAILY ELLIOTT WAVE COUNT
Click chart to enlarge.
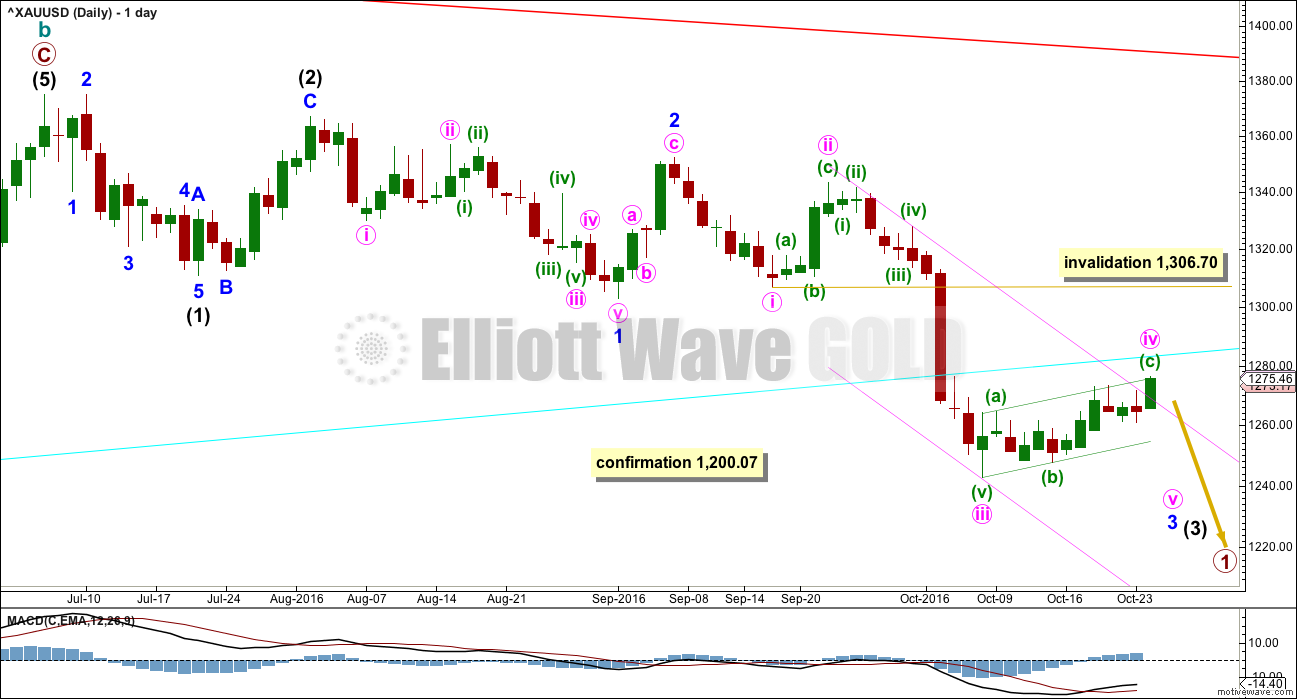
The movement up from the low of 1,046 on the 3rd of December, 2015, subdivides 5-3-5. Current downwards movement is too deep to reasonably be considered a second wave correction (that idea has been discarded based upon an exceptionally low probability), so the movement up from 1,046 is seen as a complete zigzag. This may be either the entirety of a correction, or it may be the first zigzag in a double zigzag. This main wave count looks at it as an entire correction.
If there has been a trend change at a large degree at the last high, then what looks like a rather obvious triangle must be ignored. It is possible that a series of three overlapping first and second wave corrections has unfolded, but this does look less likely than a triangle.
The triangle may not be labelled as a second wave because second waves do not take the form of triangles.
This wave count is reverted to see minor wave 3 incomplete and minute wave iv within it now unfolding. There is no Fibonacci ratio between minute waves i and iii.
Minute wave iv may not move into minute wave i price territory above 1,306.70.
Minute wave ii was a deep 0.81 zigzag lasting four days. At this stage, minute wave iv may be seen as either a regular flat correction or a zigzag, depending upon how the structure of minuette wave (a) is seen. Minuette wave (a) fits best and looks like a five, so minute wave iv may be unfolding as a zigzag. The probability of this wave count is slightly reduced because a zigzag would be the least likely structure for this correction to be. It remains viable because alternation is a guideline not a rule. Minute wave iv still exhibits alternation in depth.
The pink channel is removed today because this fourth wave is not contained within it. A small channel is drawn about minute wave iv using Elliott’s technique for a correction. Price is finding resistance about the upper edge. If price breaks through the lower edge, then the correction for minute wave iv would most likely finally be over.
HOURLY ELLIOTT WAVE COUNT
Click chart to enlarge.
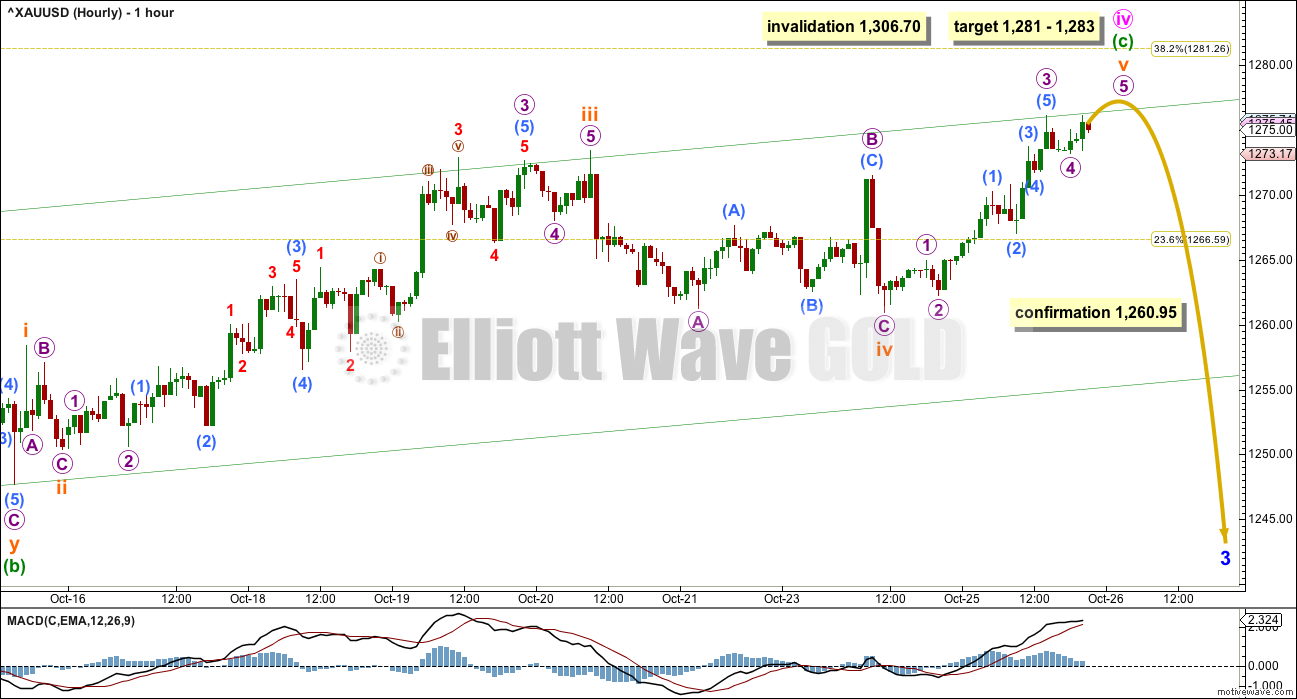
The structure of minute wave iv is today relabelled. This movement now fits best as a zigzag. So far it is 0.33 the length of minute wave iii. It may end closer to the 0.382 Fibonacci ratio at 1,281. At 1,283 minuette wave (c) would reach 1.618 the length of minuette wave (a). This gives a $2 target zone with a reasonable probability.
At any stage, a new low now below 1,260.95 would invalidate the alternate at the hourly chart level and provide some confidence in this main wave count.
Minute wave iv may not move into minute wave i price territory above 1,306.70.
ALTERNATE II DAILY ELLIOTT WAVE COUNT
Click chart to enlarge.
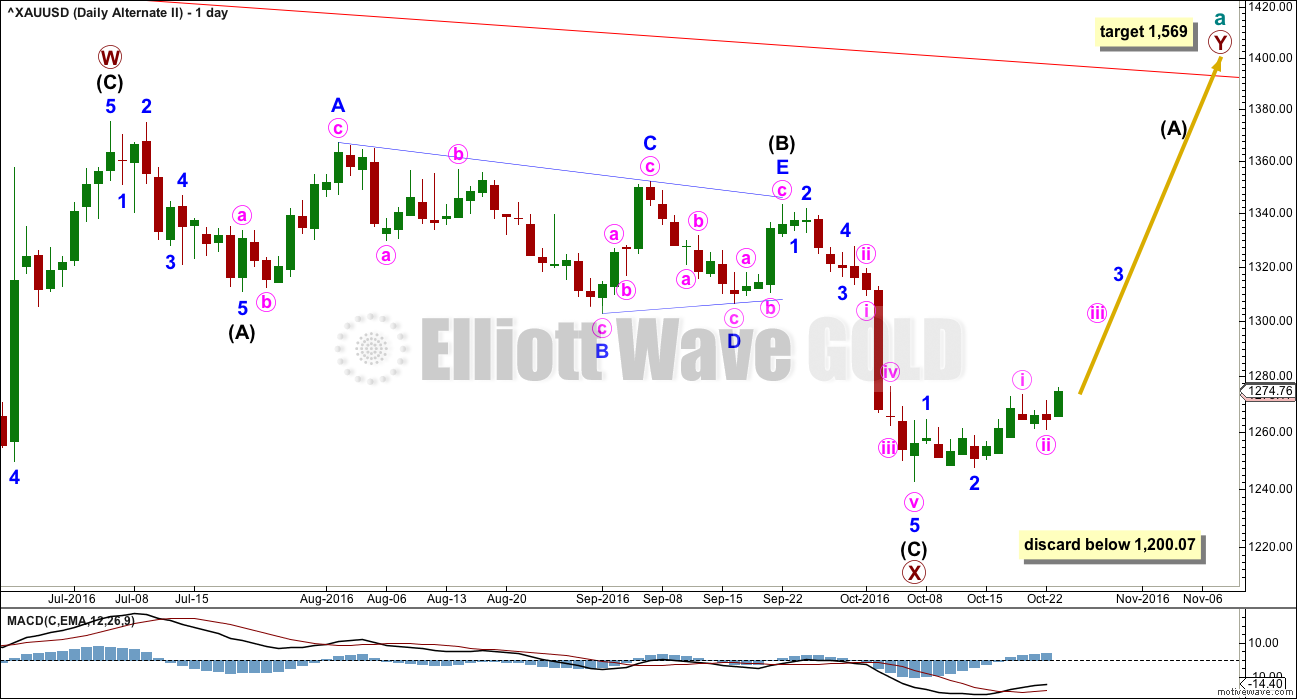
What if the zigzag upwards from the low of 1,046 on the 3rd of December, 2015, is only the first zigzag in a double?
There is no rule stating a limit for X waves within double zigzags or double combinations. To achieve the purpose of a double zigzag, which is to deepen a correction, their X waves should be relatively brief and shallow. It would be highly unusual and defeat the purpose if primary wave X moved beyond the start of intermediate wave (C) of primary wave W below 1,200.07. This wave count should be discarded below that point.
Primary wave X is seen as a zigzag. Within primary wave X, intermediate wave (B) fits neatly as a triangle. This is supported by MACD hovering about zero as it unfolded. Any wave count which sees a triangle in this position should have a higher probability than a wave count which does not.
The zigzag downwards for primary wave X may be complete, at all time frames. A target for primary wave Y upwards would be about 1,569 where primary wave Y would be about even in length with primary wave W.
So far, within the five up for intermediate wave (A), minor waves 1 and 2 may be complete. Within minor wave 3, minute waves i and now ii may also be complete.
ALTERNATE II HOURLY ELLIOTT WAVE COUNT
Click chart to enlarge.
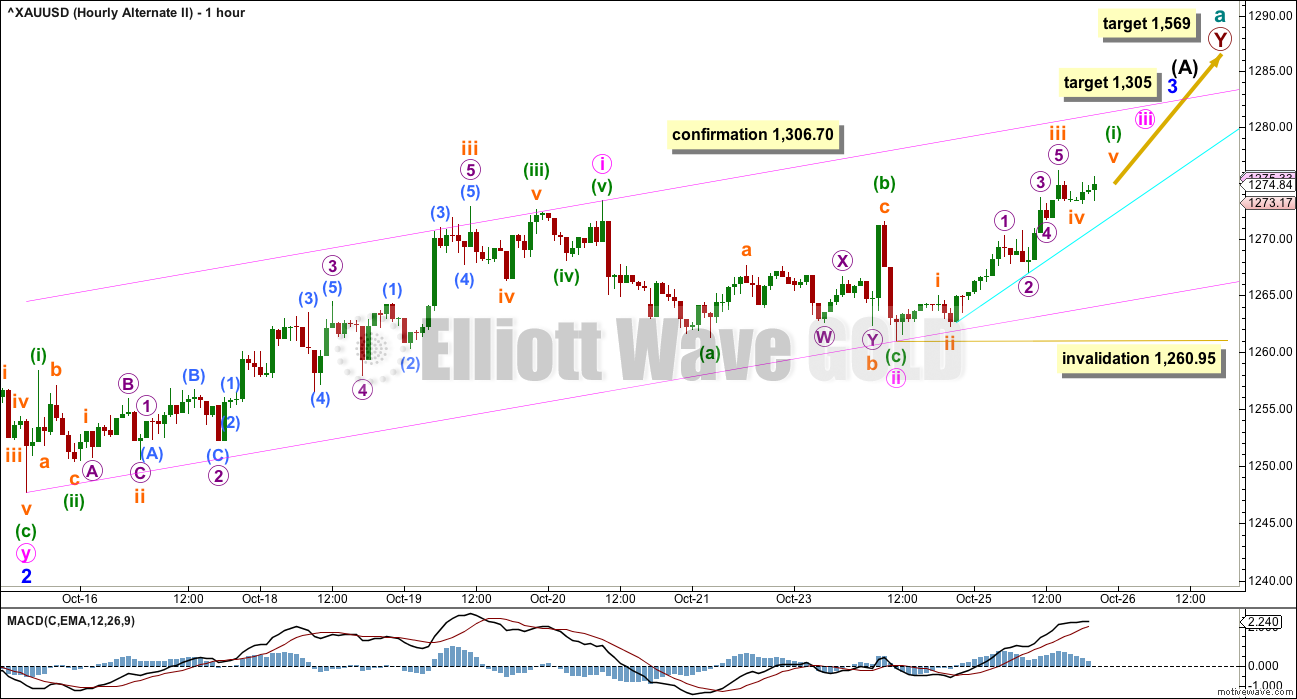
Minor wave 3 must move far enough above the end of minor wave 1 at 1,264.72 to allow room for a subsequent fourth wave correction to unfold and remain above first wave price territory. It still has not done that. The conclusion for this alternate wave count must still be that minor wave 3 is incomplete.
So far, within minor wave 1, a five wave impulse upwards is complete and this is labelled minute wave i.
Now a following three wave structure downwards looks to be also complete, falling just short of the 0.618 Fibonacci ratio at 1,259. This may be a zigzag for minute wave ii.
At 1,305 minor wave 3 would reach 1.618 the length of minor wave 1.
Within minute wave iii, the first wave up of minuette wave (i) is close to completion. When minuette wave (i) is done, then minuette wave (ii) may not move beyond the start of minuette wave (i) below 1,260.95.
At 1,569 primary wave Y would reach equality in length with primary wave W.
TECHNICAL ANALYSIS
WEEKLY CHART
Click chart to enlarge. Chart courtesy of StockCharts.com.
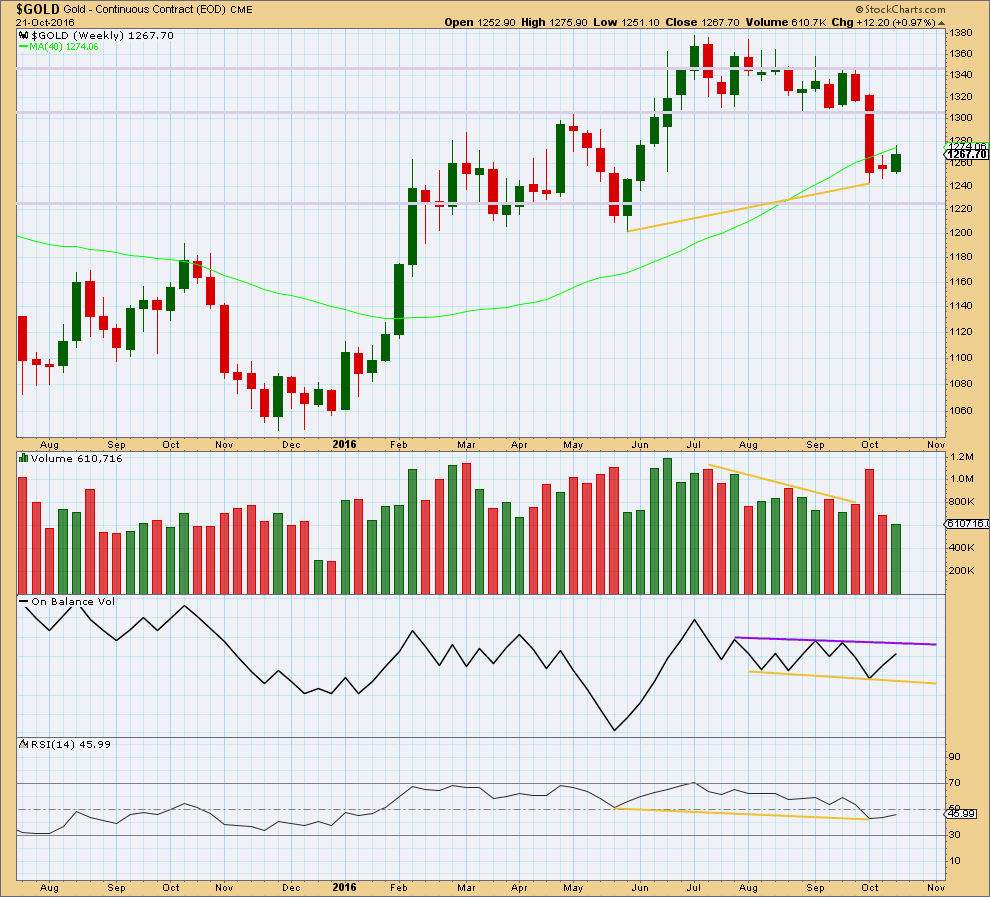
An upwards week shows a further decline in volume. This supports the main bearish Elliott wave count.
Two small range weeks in a row have moved price sideways and slightly higher. This looks like a small consolidation at this stage and not necessarily a new upwards trend.
On Balance Volume remains constrained within support and resistance lines.
The divergence noted with yellow lines between price and RSI at the last two swing lows is bullish. It indicates weakness in price. This supports the alternate Elliott wave count.
DAILY CHART
Click chart to enlarge. Chart courtesy of StockCharts.com.
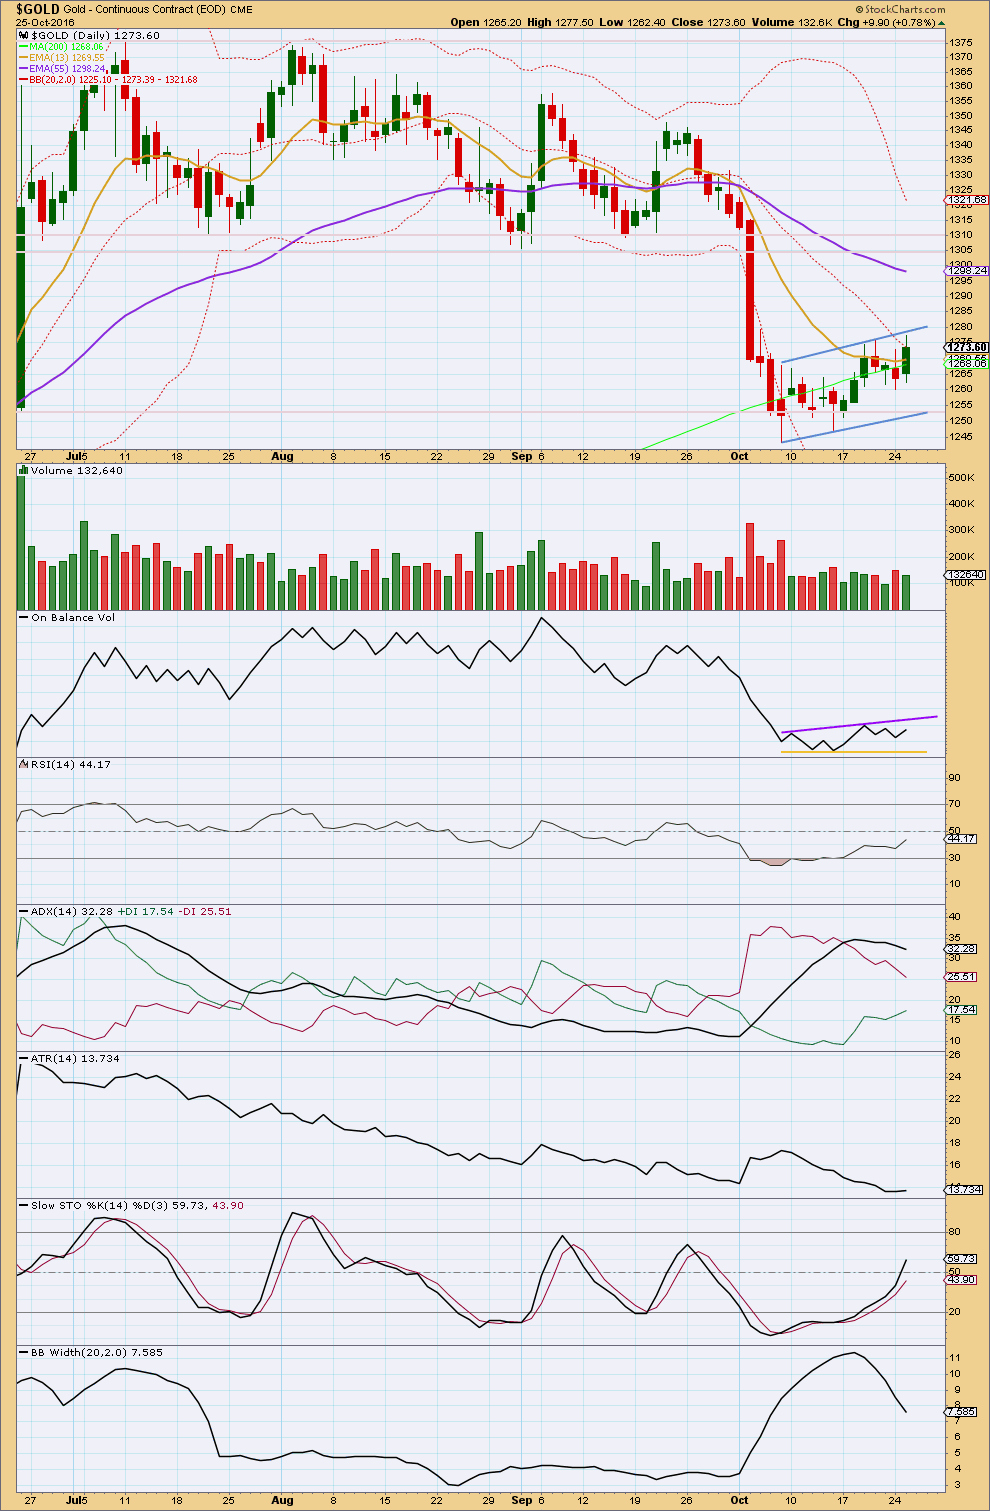
It is very concerning for any bullish outlook that the reasonable upwards movement from price is not supported by volume today. For an upwards trend to be healthy and sustainable it requires active buyers to push price up. So far this is not happening.
This could change if we see an upwards day with stronger volume, but so far that has not happened. We can only make a judgement on the evidence that is available, not on what we think might happen.
Price has found resistance today at the upper flag trend line. With volume still light and declining, it still looks like this choppy movement of the last 12 sessions is a consolidation, and it still looks like a bear flag pattern. During this pattern, it is still two downwards days which have strongest volume.
On Balance Volume is still constrained within resistance and support.
ADX is declining, indicating the market is not trending. ATR is still overall declining; although it slightly increased today, one day is not enough to indicate a trend. Bollinger Bands are still sharply contracting. This upwards movement still does not look like a normal healthy trend.
This consolidation is bringing RSI back closer to neutral. Stochastics is also moving through neutral. There is again plenty of room for price to fall.
The longer term 200 day moving average still is increasing. The larger trend may still be up.
The mid term Fibonacci 55 day moving average is still declining, and the shorter Fibonacci 13 day average is below it. The mid term trend may still be down.
This analysis is published @ 10:13 p.m. EST.
Hi all. I lurk a lot, post only sometimes. It sure does seem like a clear short from here, however, I note the following:
-it isn’t usually that easy 🙂
-volume even lower than yesterday (per GLD at least)
-this wave 4 is taking a little too much time and i would have though it would have broken down a few days ago if it were going to head down (although shallow wave 4’s do often have a tendancy to do that )
-i’m not seeing the momentum divergence you would normally see on this little higher high we’ve had in price before a big breakdown. I think that’s an important point
-COT data has definitely improved for longs, and has done so very quickly in the last few weeks. I don’t expect it to get to the levels of last year’s low if we’re in the process of a bull market, since that was supposed to be the beginning of a bull market
Just factors to take into account, and a huge plunge on high volume tomorrow or next day or so could confirm the bear.
I think I had my analysis of subminuette v wrong yesterday. I was waiting / expecting a final high to the target, for a final small fifth wave. That’s not happened.
I think that this is correct labelling now of that last wave up.
It ended perfectly at the upper edge of the Elliott channel. Now to see if it can break the lower support line.
If it does then look for a throwback to resistance. I’ll be looking to enter short there (if it does it while I’m awake that is! ugh. this market often makes it’s moves while I’m fast asleep in New Zealand).
Daily chart updated. Now minute iv may again be over a target may be calculated for minute v. To equal minute i in length at 1,231.
If this target is wrong it may be too high. I’ll be calculating lower targets, the next 1,203 would be minute v = 1.618 X minute i. This is close to the round number pivot of 1,200 so has a reasonable probability. Minute v may end with a selling climax; a strong downwards day with a volume spike.
But first (really important) we need to see price break below the support line of this bear flag, a classic breakout to confirm the next direction.
While price is still below resistance and above support it’s constrained, and may continue sideways. Very annoying and hard to profit from a consolidating market.
Great analysis lara.
My personal view on gold is that Mr Donald will light the cracker to burst and Ms clinton will pour water on the burning cracker.
News are domimating Counts here. I know many dont digest this fact but in my opinion Historic political news like Fed and Elections are actually meant to design the foundation of the wave count. Counts directly or indirectly depends on News flows. I dont have book knowledge of EW but i have learnt this in last two years of practical lessons in market
Im a fan of lara since im following her from more than a year and half. And i found that since its a corrective phase for gold of a supercycle degree its impossible to judge the market near term trend before it starts. So i felt that Elliot Wave theory is a superb tool for a trending market and for a long term targets. Traders must apply other technical tools to trade in short term to get successful result.
Hats off for lara as she always provide a long vision for huge profits
I have to agree. I can’t even call myself a novice when it comes to this and have only been following Lara a few months. A lot of her calls have blown my mind in a good way and I learn more everyday. However, I can tell it is difficult when a non voting fed member can get on TV, mutter a few words and send price violently in one direction or another. From my understanding EW ignores all of this noise but the markets seem to only react to the noise these days.
From what I read, yesterday’s action was due to a headline about increased demand out of India which was unexpected which led the shorts to run for the hills hence the lack of volume on such a strong move up.
Thank you very much William 🙂
I ignore the noise so much so that I don’t read many news sites. The little I do read tends to be very locally focused on New Zealand. I read the Guardian sometimes, the english version of Spiegel, Al Jazeera and very occasionally the Independent. But I’m glossing over them really, just trying to get a feel for social mood.
So when there is a news release that moves the market I’m often unaware of it.
Thank you very much Jimmy, that’s put a huge smile on my face 🙂 So glad to hear when members appreciate my efforts.
This is how I view the “news” in relation to markets:
Yes, when the FED speaks or some other big talking head speaks it does move the market. My theory which fits Elliott wave theory is the direction the market will move in is determined by which structure is unfolding, in other words by the wave count. The violent moves tend to be third waves, or for Gold and other commodities fifth waves. Especially fifth waves to end Gold’s third waves, blowoff tops and selling climaxes.
That’s what happened for Brexit. A blowoff top.
So if my wave count is right then we should be on the right side of those violent moves.
As you all know… sometimes I get it wrong, it’s impossible to always get it right. I should be getting it right more often than wrong so that we can all profit.
I hope everyone is onto Oil this week. See that analysis.
Lara, what do you think of the concept of the $USD moving down as shown?
On your USD count, it would likely mean Intermediate 4 would be continuing.
This could allow Gold to move up (much easier), in your alternate count.
https://goldtadise.com/?p=384879
It’s entirely possible. I’m looking at my USD count now and yes, intermediate (4) could do that.
Intermediate (2) was a quick zigzag lasting 15 weeks. If intermediate (4) is over it fits as an expanded flat lasting 25 weeks, so the proportion is good (flats are longer lasting than zigzags) and alternation is perfect.
If intermediate (4) continues further it would be much longer in duration, and would begin to be out of proportion. But this is still entirely possible. The proportions of corrections for USD just aren’t always that good.
Main hourly chart shows yesterday’s hourly until enlarged, then the new chart shows up. Strange. I think Richard noticed the same thing a few days ago.
Dreamer, “There are two bits of code. One bit for how it shows in the body of the text, and another for how it shows when you click on it.” Lara will fix it.
Crikey. SO sorry guys! Yes, my code. Will fix.