
More downwards movement was expected for the short term for Silver.
So far Silver has moved slightly lower.
Summary: A strong bearish signal from On Balance Volume this week at the weekly chart level supports the first alternate Elliott wave count, which expects Silver is in a new downwards trend. A new low below 16.132 would confirm this wave count. A new high above 18.710 would indicate a new high is likely.
New updates to this analysis are in bold.
This analysis is presented with a main and alternate wave count. They are presented in the order they were developed, not in order of probability.
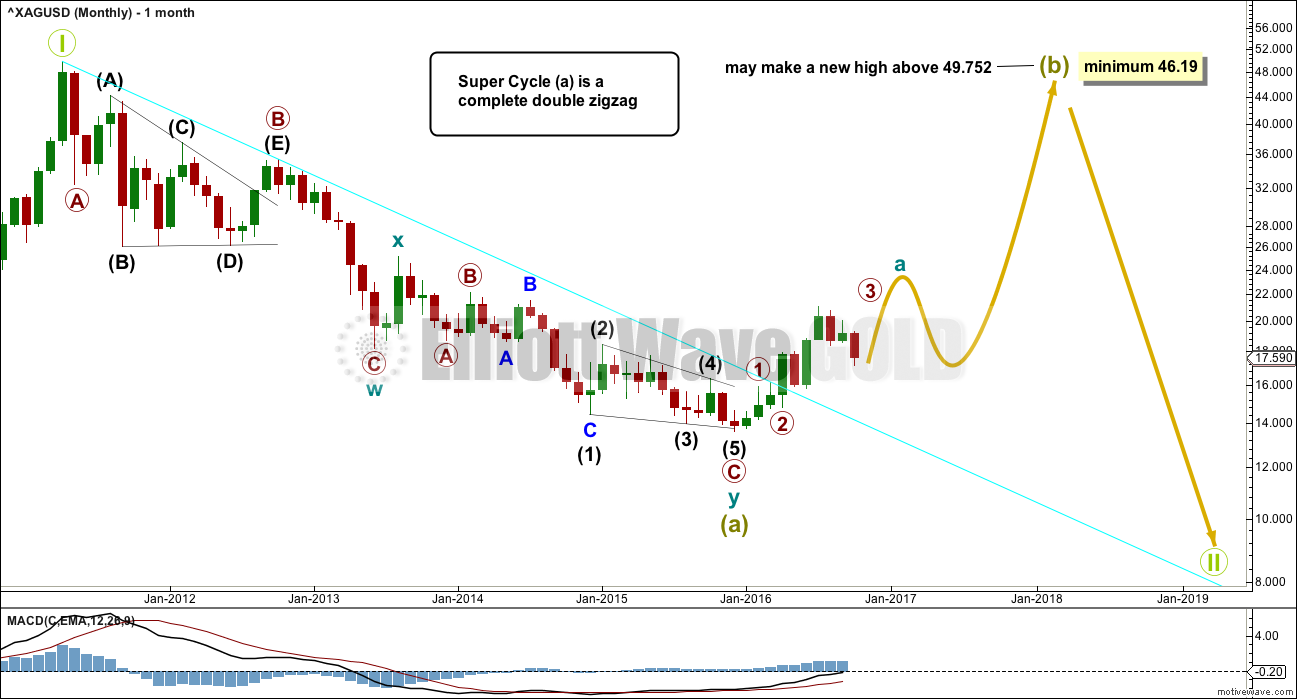
MONTHLY WAVE COUNT
Click chart to enlarge.
I have two wave counts at the monthly chart level that see the large downwards wave here labelled super cycle wave (a) as either a three or a five. This first wave count sees it as a three.
If super cycle wave (a) is a completed three, it would be a double zigzag. Within the double zigzag, cycle wave X is relatively brief and shallow, exactly as an X wave within a double zigzag should be.
Within the first zigzag, primary wave B subdivides as a running barrier triangle and intermediate wave (E) ends with an overshoot of the (A)-(C) trend line.
If super cycle wave (a) is a completed three wave structure, then the entire correction labelled Grand Super Cycle wave II, or Grand Super Cycle wave IV (because this correction may also be a fourth wave) may be a flat correction. If it is a fourth wave, it may also be a triangle. The following B wave when A waves subdivide as threes is normally very deep. A substantial upwards wave would be expected to follow.
If a large flat correction is unfolding, then super cycle wave (b) must retrace a minimum 0.9 length of super cycle wave (a) at 46.19 or above. The most likely structures for super cycle wave (b) to achieve this length would be a single or multiple zigzag.
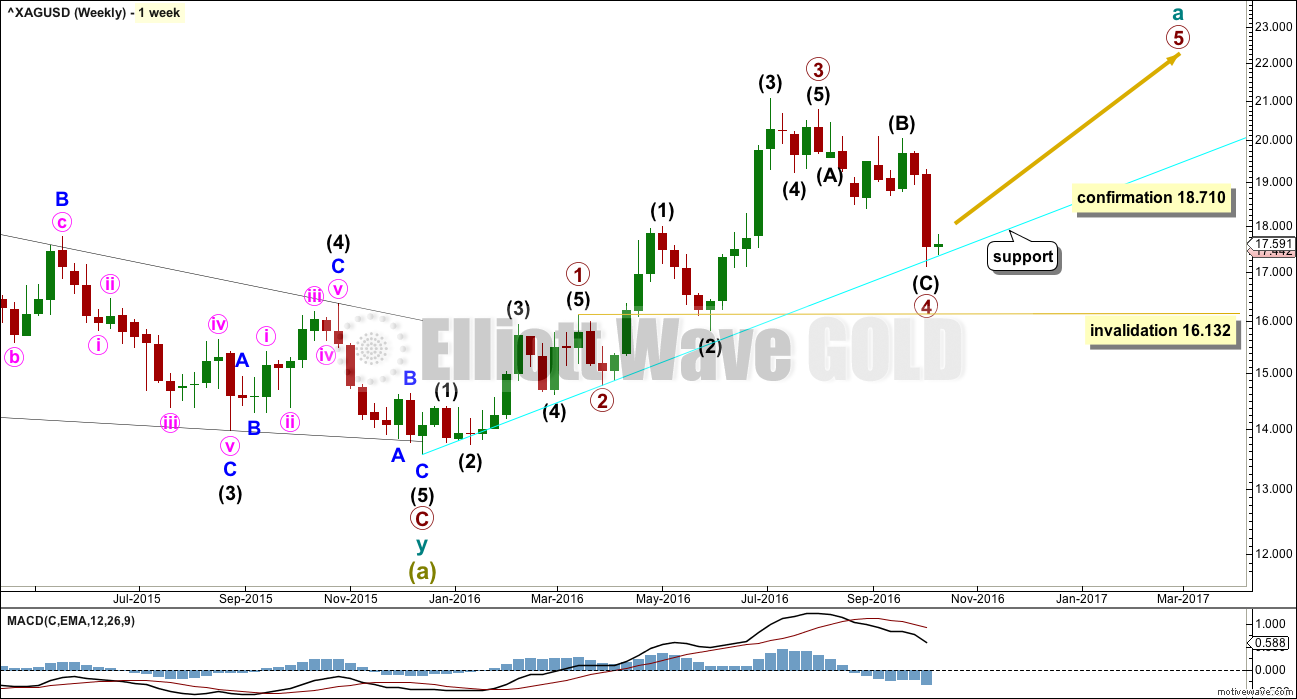
WEEKLY WAVE COUNT
Click chart to enlarge.
If a zigzag is unfolding upwards, then within it cycle wave a should subdivide as a five wave structure. So far primary waves 1 through to 3 may be complete, and primary wave 4 is very close to completion.
Primary wave 4 may not move into primary wave 1 price territory below 16.132.
The disproportion between primary waves 2 and 4 reduces the probability of this wave count. Primary wave 2 lasted just two weeks. So far primary wave 4 has lasted nine weeks and is incomplete.
The lack of alternation further reduces the probability of this wave count. Both primary waves 2 and 4 are zigzags.
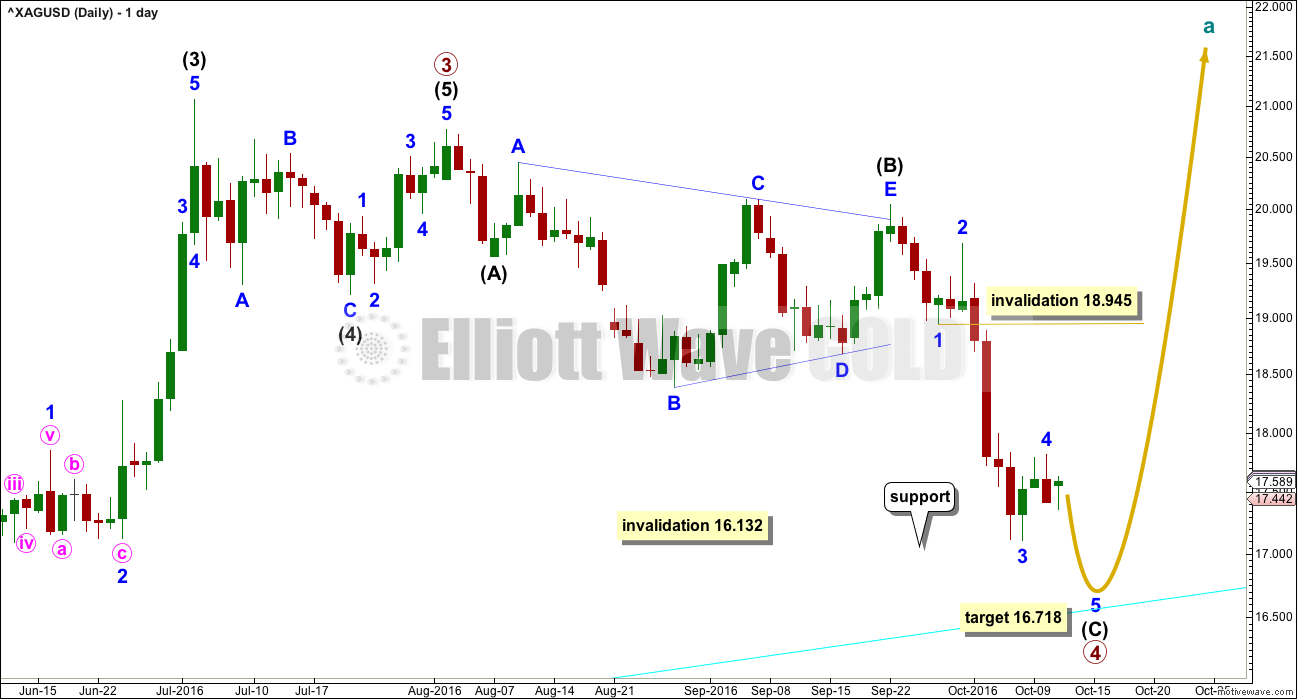
DAILY WAVE COUNT
Click chart to enlarge.
Primary wave 3 ends with a truncation. This slightly reduces the probability of this wave count. A truncation may occur after a movement that is “too far, too fast”, which is a description that may fit the upwards wave labelled intermediate wave (3).
Intermediate wave (5) will fit perfectly as a five wave impulse.
Primary wave 4 may be unfolding as a zigzag. Within primary wave 4, intermediate wave (B) fits as a running contracting triangle.
Intermediate wave (C) must complete as a five wave structure. Within intermediate wave (C), minor wave 4 may not move into minor wave 1 price territory above 18.945.
At this stage, it is possible that minor wave 4 is complete. If it is complete and it does not move any higher, then at 16.718 minor wave 5 would reach equality in length with minor wave 1.
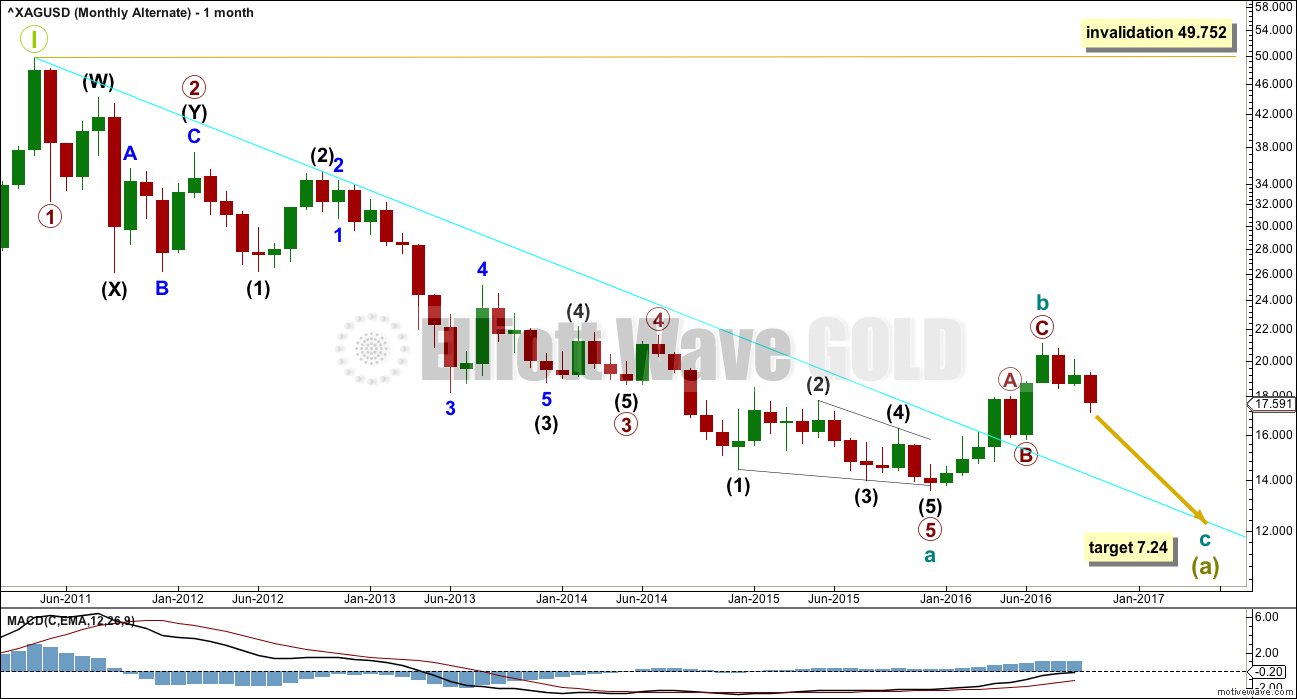
ALTERNATE MONTHLY WAVE COUNT
Click chart to enlarge.
What if the large wave down from the all time high was a five and not a three? Does it fit?
If the first second wave correction within the downwards wave labelled primary wave 2 is seen as an atypical combination, then everything else fits neatly.
Primary wave 2 fits as a combination, but the second structure in the double ends reasonably below the same level as the first. The whole structure has a downwards slope, but it should be a sideways movement. This reduces the probability of this wave count.
A triangle may not be a sole corrective structure for a second wave, so this portion of the wave count may not be seen in the same way as the first wave count.
If a five down is complete, then that would most likely be only cycle wave a within a larger zigzag for super cycle wave (a). If cycle wave a is a five, then cycle wave b within it may not make a new high above the start of cycle wave a at 49.752.
Cycle wave b may be a complete brief shallow 0.21 zigzag. At 7.24 cycle wave c would reach 0.382 the length of cycle wave a.
ALTERNATE WEEKLY WAVE COUNT
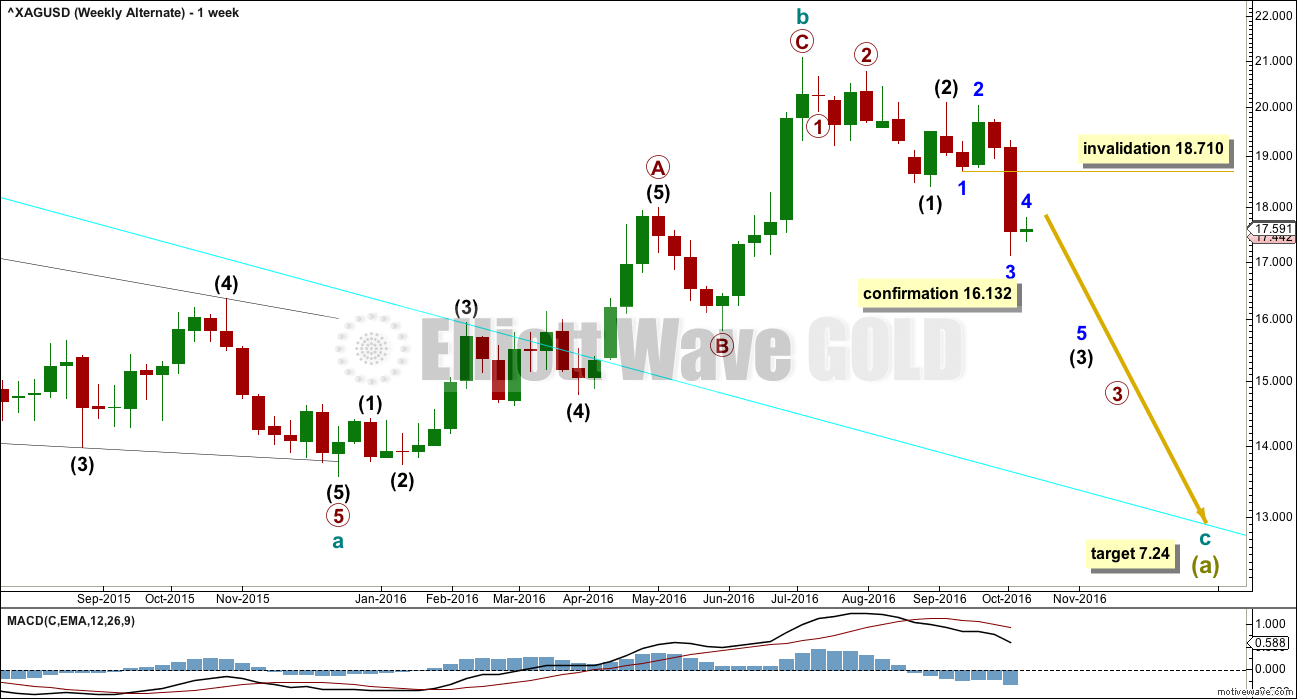
Click chart to enlarge.
Upwards movement fits better as a completed zigzag than it will as an incomplete five, at this stage. At the daily and weekly chart level, this alternate wave count has a better fit and better look for Silver.
This wave count may be considered confirmed if the main wave count is invalidated below 16.132.
ALTERNATE DAILY WAVE COUNT
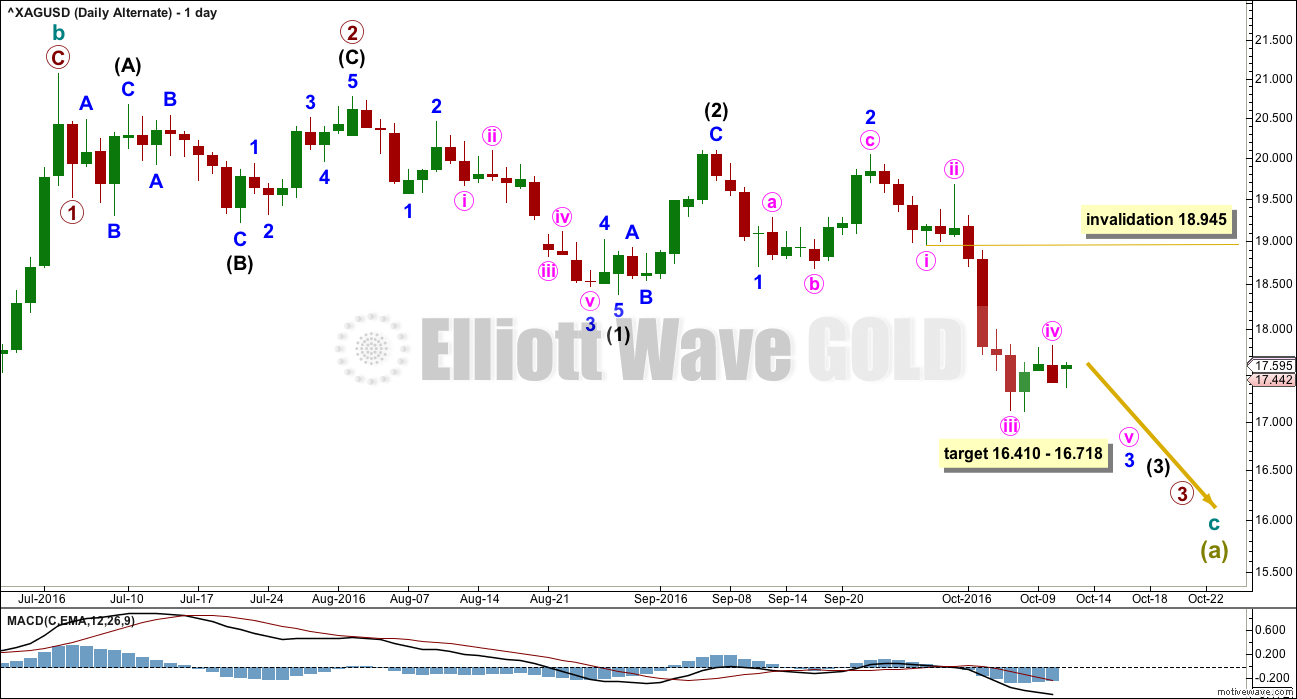
Click chart to enlarge.
If there has been a trend change at a large degree at the last high, then a five down should unfold. So far a series of three overlapping first and second waves may be complete.
Within minor wave 3, the correction for minute wave iv may not move into minute wave i price territory above 18.710.
At 16.41 minor wave 3 would reach 2.618 the length of minor wave 1. At 16.718 minute wave v would reach equality in length with minute wave i. This gives a 0.308 target zone.
ALTERNATE II WEEKLY WAVE COUNT
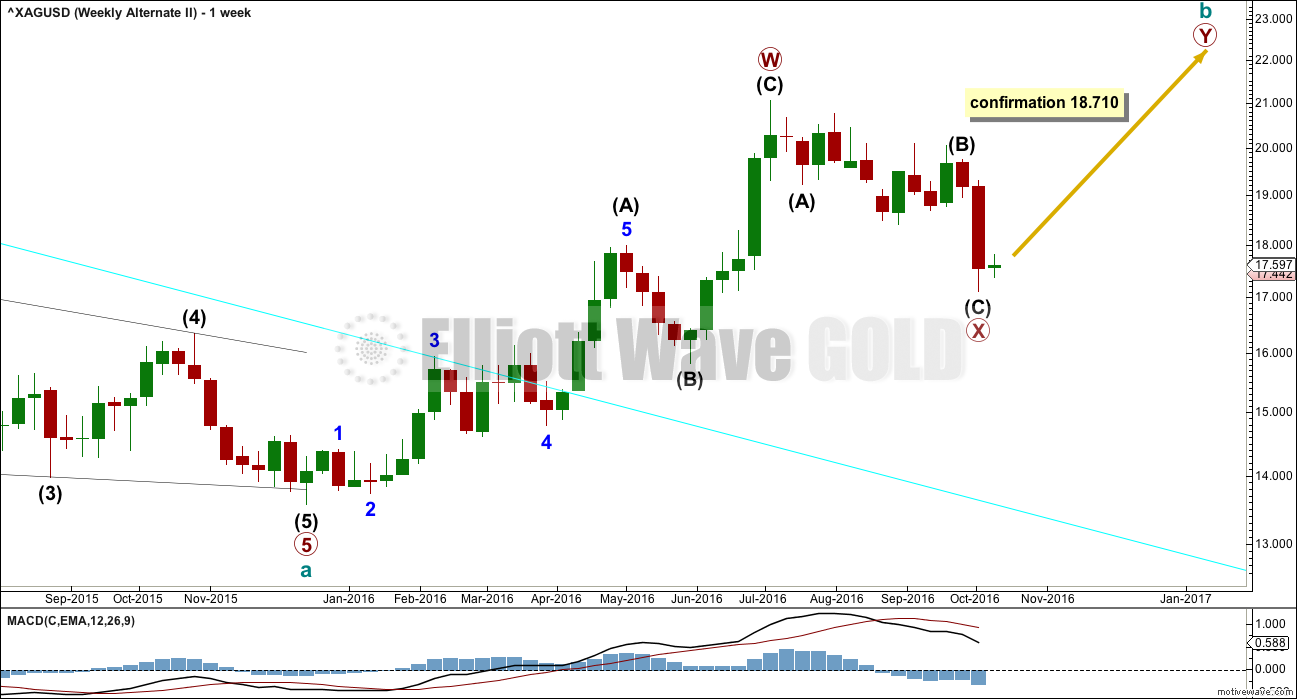
Click chart to enlarge.
If the degree of labelling within the zigzag up from the low for Silver is simply moved down one degree, this may be the first zigzag in a double. It may also be wave A of a larger flat or triangle for cycle wave b.
ALTERNATE II DAILY WAVE COUNT
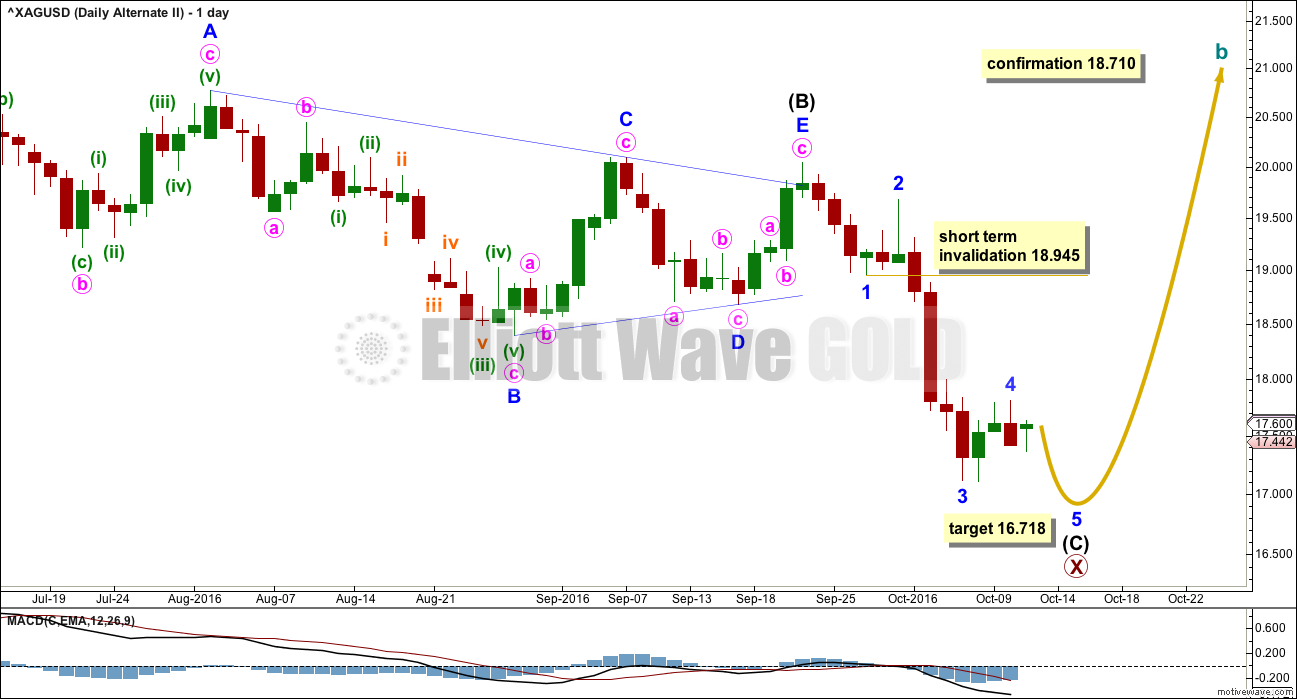
Click chart to enlarge.
Recent sideways movement fits well as a triangle for Silver. If this labelling is correct, then a zigzag is unfolding downwards and is very close to completion.
Within intermediate wave (C), the correction for minor wave 4 may not move into minor wave 1 price territory above 18.945 in the short term. As soon as minor waves 4 and 5 may be complete, then a trend change would be expected for Silver and a new zigzag upwards towards new highs.
At 16.718 minor wave 5 would reach equality in length with minor wave 1.
Primary wave Y would likely be about even in length with primary wave W, which was 7.493.
TECHNICAL ANALYSIS
WEEKLY CHART
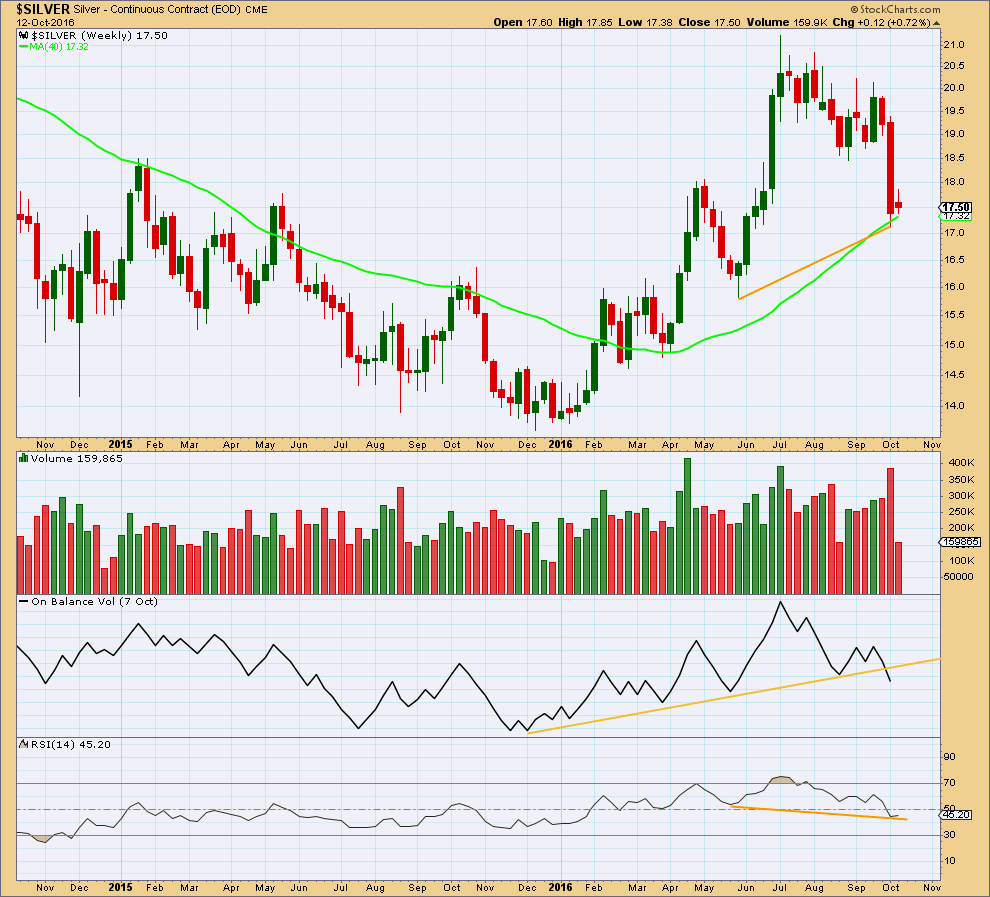
Click chart to enlarge. Chart courtesy of StockCharts.com.
On Balance Volume this week gives a strong bearish signal with a clear break below the yellow support line. This strongly favours the first alternate wave count.
Last week moved price strongly lower with an increase in volume. This also favours the first alternate Elliott wave count.
There is still divergence between price and RSI (orange lines). This divergence is bullish and indicates weakness in price. This supports the main and second alternate Elliott wave counts.
DAILY CHART
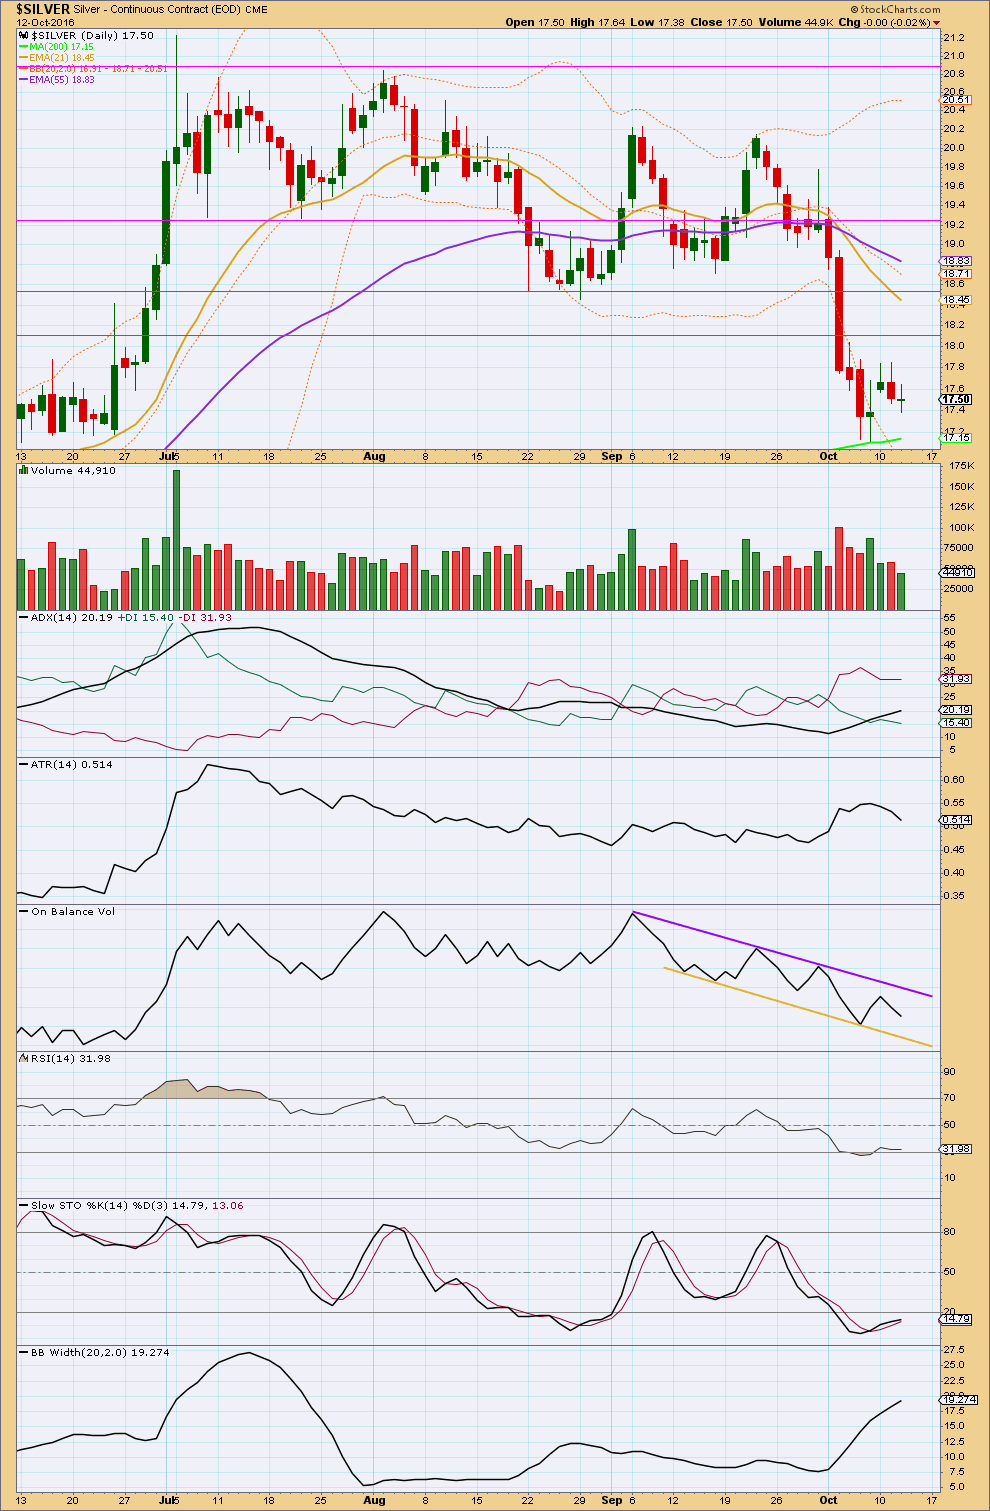
Click chart to enlarge. Chart courtesy of StockCharts.com.
Price found support and stopped right at the 200 day moving average.
The last three days of slight upwards and sideways movement comes with declining volume. This looks like a small consolidation within a new downwards trend.
ADX is increasing and the -DX line is above the +DX line indicating a downwards trend is in place.
ATR is declining for the last three days as price moves mostly sideways. This may indicate a small consolidation within the new downwards trend.
Bollinger Bands are still widening as volatility has returned. Overall, it looks like a new downwards trend is in place.
After four days of price moving below the lower edge of the Bollinger Bands,
Price is now returning to within the Bollinger Bands after four days of price moving below the lower edge of the Bollinger Bands. It may be expected that price may return to the mid line before the downwards trend resumes.
RSI has returned from oversold, but only slightly. The consolidation may need to continue a little longer before RSI again allows room for price to fall.
Stochastics is still oversold. It may remain extreme for reasonable periods of time during a trending market.
The support line in yellow for On Balance Volume is adjusted this week. OBV is contained within these trend lines.
This analysis is published @ 02:50 a.m. EST.
What an incredible potential deep drop for Silver in bearish alternate.