
Price has moved sideways since last Elliott wave and technical analysis.
Summary: A short term target for upwards movement to end is at 53.30. If this target is wrong, it may be too low. Thereafter, a trend change is expected: a downwards wave for Oil to a minimum of 28.61 with a range of 26.06 – 16.33 as most likely.
New updates to this analysis are in bold.
MONTHLY ELLIOTT WAVE COUNT
Click chart to enlarge.
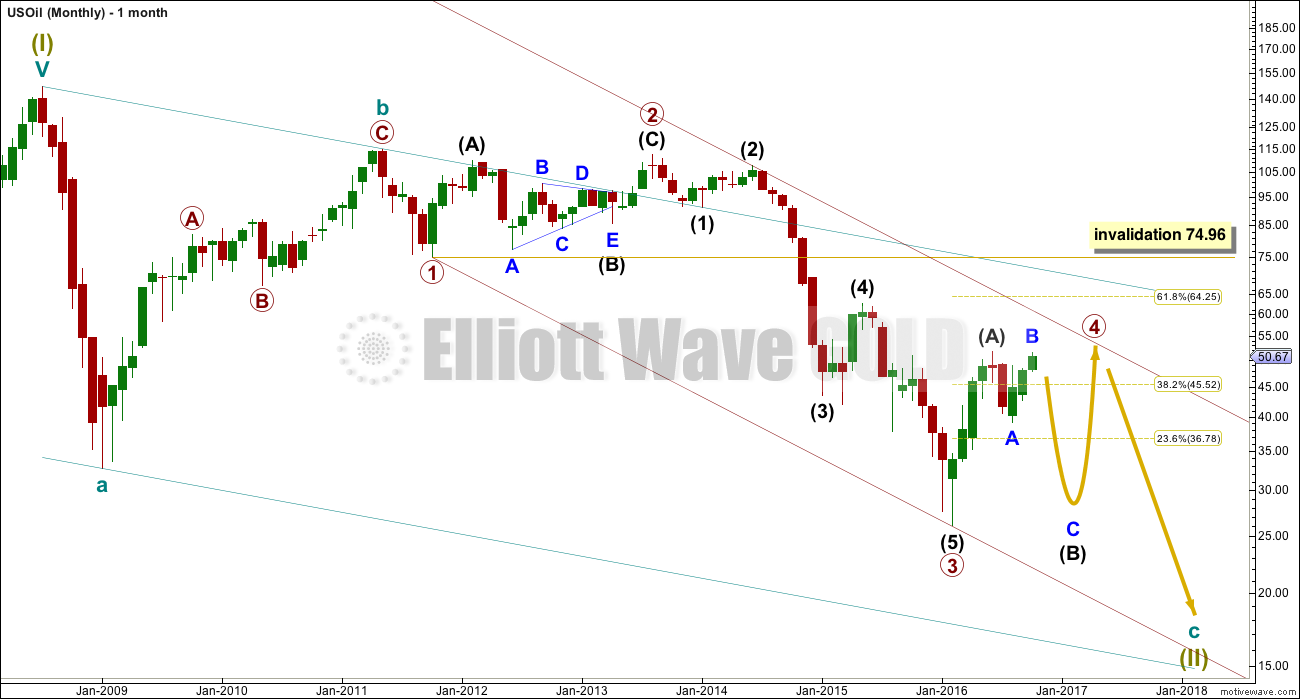
Within the bear market, cycle wave b is seen as ending in May 2011. Thereafter, a five wave structure downwards for cycle wave c begins.
Primary wave 1 is a short impulse lasting five months. Primary wave 2 is a very deep 0.94 zigzag lasting 22 months. Primary wave 3 is a complete impulse with no Fibonacci ratio to primary wave 1. It lasted 30 months.
Primary wave 4 is likely to exhibit alternation with primary wave 2. Primary wave 4 is most likely to be a flat, combination or triangle. Within all of these types of structures, the first movement subdivides as a three. The least likely structure for primary wave 4 is a zigzag.
Primary wave 4 is likely to end within the price territory of the fourth wave of one lesser degree; intermediate wave (4) has its range from 42.03 to 62.58.
Primary wave 4 may end if price comes up to touch the upper edge of the maroon channel. The upper edge of this channel has been pushed up to sit on the end of intermediate wave (2) within primary wave 3.
Primary wave 4 is most likely to be shallow to exhibit alternation in depth with primary wave 2. So far it has passed the 0.382 Fibonacci ratio at 45.52. It may now continue to move mostly sideways in a large range.
Primary wave 4 may not move into primary wave 1 price territory above 74.96.
DAILY ELLIOTT WAVE COUNT
Click chart to enlarge.
This week there is still only one daily wave count for US Oil.
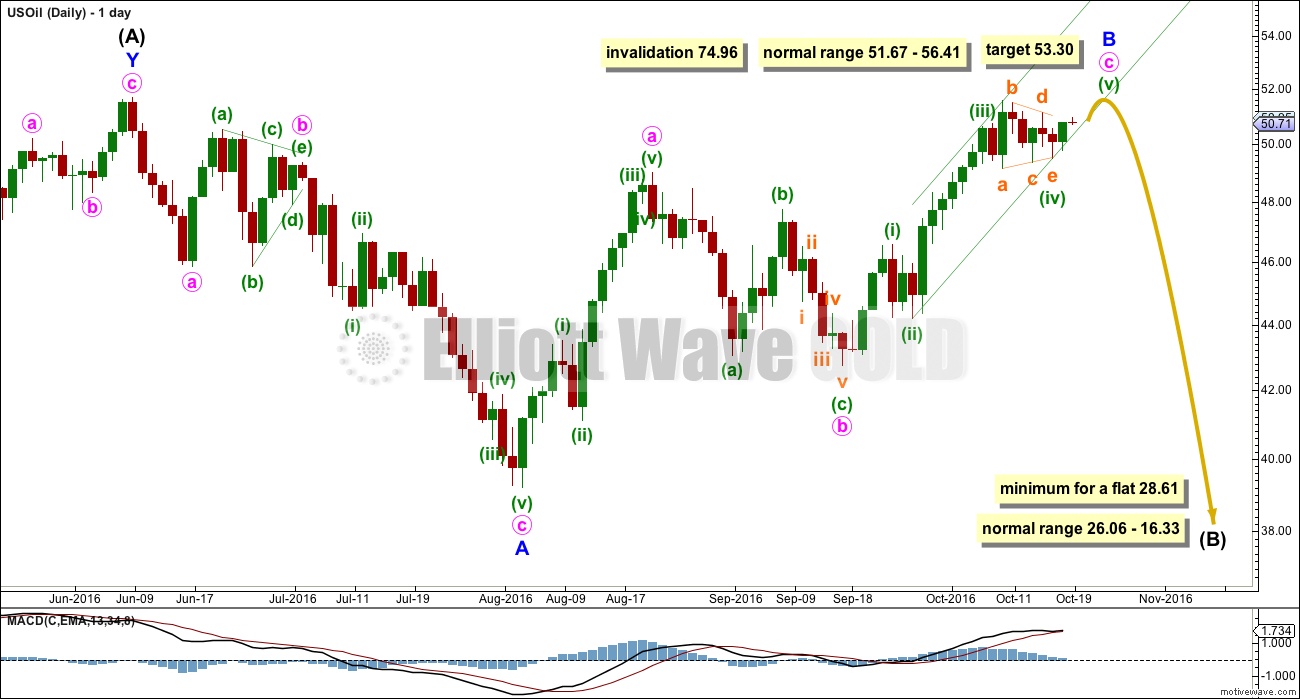
The upwards wave labelled intermediate wave (A) fits neatly as a double zigzag. This is classified as a three.
Intermediate wave (B) now looks like it is unfolding as an expanded flat correction. This is also classified as a three.
When both A and B waves subdivide as threes, the larger structure one degree higher is either a flat or triangle. Within a triangle though, no part of intermediate wave (B) should move beyond the end of intermediate wave (A) above 51.67. A new high this week above 51.67 may eliminate a possible triangle unfolding at this stage.
Primary wave 4 looks like it may be unfolding as a flat correction if my analysis of intermediate wave (A) is correct.
Within a flat correction, the minimum depth for intermediate wave (B) is 0.9 the length of intermediate wave (A) at 28.61. Intermediate wave (B) may make a new price extreme beyond the start of intermediate wave (A) below 26.06 as in an expanded flat.
Intermediate wave (B) is unfolding as a flat correction. Within intermediate wave (B), the normal range for minor wave B would be from 1 to 1.38 times the length of minor wave A.
Within the flat correction of minor wave B, the final wave up of minute wave c must subdivide as a five wave structure. At this stage, it looks like a small triangle has completed and this may be minuette wave (iv). At 53.30 minuette wave (v) would reach equality in length with minuette wave (i). This is the most common ratio for a fifth wave to exhibit, so this target has a reasonable probability and would see minor wave B end within normal range.
Primary wave 4 may not move into primary wave 1 price territory above 74.96. Upwards movement could continue higher as long as it remains below this point.
A small channel is drawn using Elliott’s second technique about minute wave c. When this green channel is clearly breached by downwards movement, it would be earliest indication of a potential trend change.
TECHNICAL ANALYSIS
DAILY CHART
Click chart to enlarge. Chart courtesy of StockCharts.com.
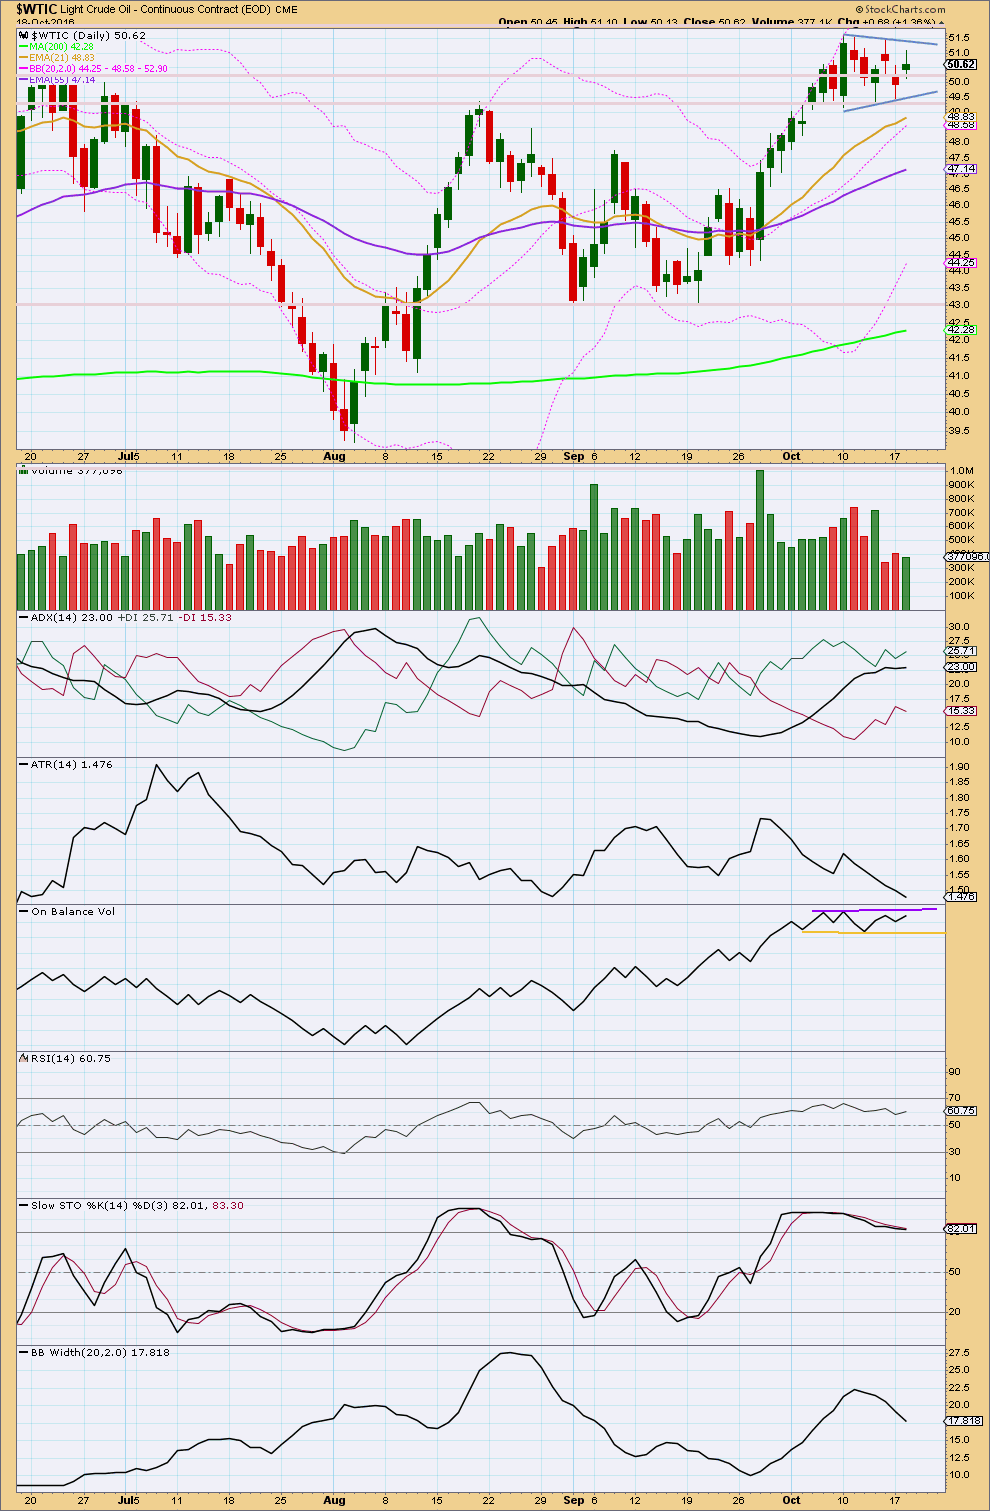
A small pennant pattern is forming, and it is supported by declining volume. Pennants are reliable continuation patterns. The measured rule would give a target at about 58.77. While the direction agrees with the Elliott wave analysis, the target is significantly different.
ADX is still slightly increasing. The +DX line is above the -DX line. ADX indicates an upwards trend is still in place.
ATR disagrees though. It is clearly declining. There is something wrong with this trend. The Elliott wave count makes sense of this; there should be something wrong or off about a B wave.
Bollinger Bands are declining for the last seven days as price moves sideways in a small consolidation.
RSI has not yet reached overbought. There is room for price to rise further.
Stochastics is still overbought, but this oscillator may remain extreme for reasonable periods of time during a trending market.
On Balance Volume trend lines are redrawn this week about the recent consolidation. Watch these lines carefully over the next few days. If OBV breaks out of this small zone, it may precede a break by price and indicate the next trend direction.
Overall, this classic analysis agrees with the Elliott wave count in terms of direction, just not in how far up the next movement may go.
This analysis is published @ 01:07 a.m. EST.
Kimble Charting view
Lara, any concern for the possible bullish inverted H&S pattern?
Hopefully the pattern will not play out. I like your count.
After some time of confusion about structure for this B wave within a B wave… the absolute worst of the worst…. I can now happily say that I have more confidence now in my analysis for US Oil.
Once we have a trend change confirmed, after a new high and then a breach of the narrow channel, then I’ll be looking to go short for the next wave down.