
A new low below 1,242.87 has invalidated the main Elliott wave count and confirmed the more bearish alternate.
There is only one wave count now.
Summary: The classic technical analysis is very bearish. Corrections are an opportunity to join the trend. A correction to about 1,247 may unfold on Monday. Use the parallel channel on the hourly chart for support and resistance. To manage risk carefully do not invest more than 3-5% of equity on any one trade and always use a stop.
New updates to this analysis are in bold.
Grand SuperCycle analysis is here.
MONTHLY ELLIOTT WAVE COUNT
Click chart to enlarge.
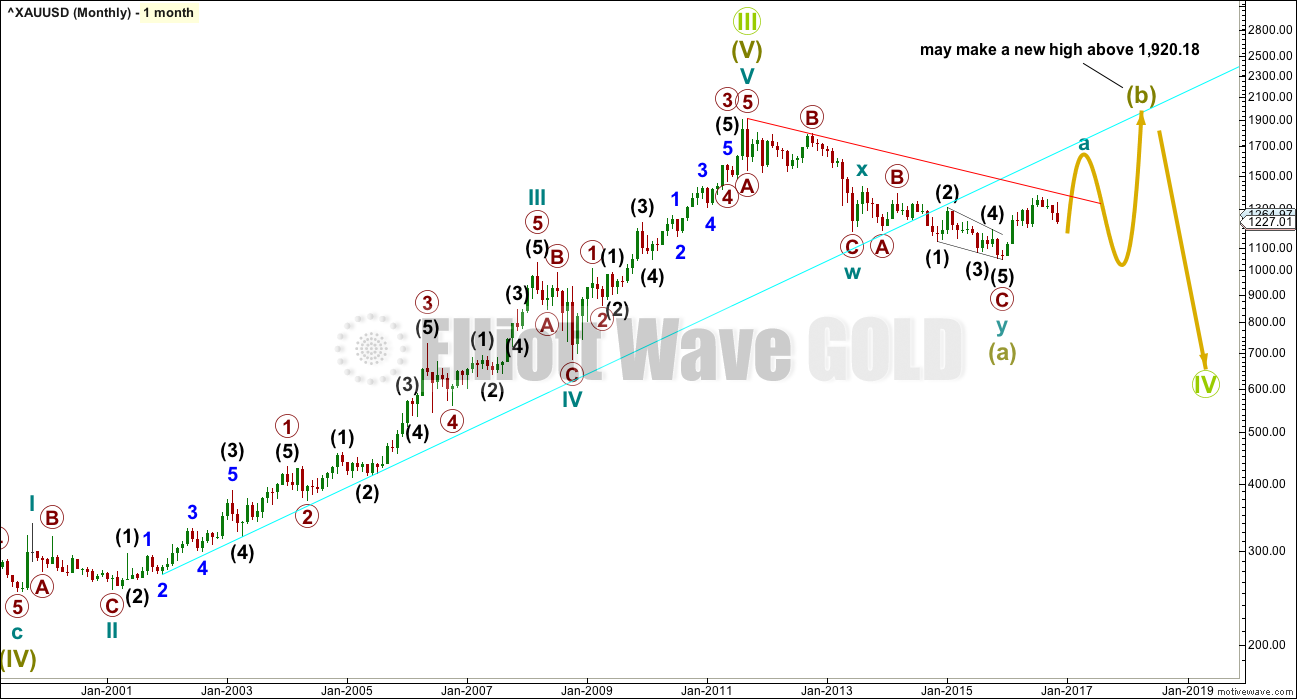
The large wave down labelled Super Cycle wave (a) may be seen either as a three or a five. It fits best as a three. At this stage, it does not make a difference to the short or mid term expectations.
If Super Cycle wave (a) is a three, then Super Cycle wave (b) may make a new high above its start at 1,920.18.
The larger structure is seen as Grand Super Cycle wave IV. When a fourth wave begins with a three wave structure for its A wave, then a flat, combination or triangle is indicated. In this case, with Super Cycle wave (a) a double zigzag, a combination for Grand Super Cycle wave IV may be eliminated because multiples may not subdivide into multiples. This leaves two possible structures for Grand Super Cycle wave IV: a flat or a triangle.
If Grand Super Cycle wave IV is unfolding as a flat correction, then within it Super Cycle wave (b) must retrace a minimum 0.9 length of Super Cycle wave (a) at 1,832.78.
If Grand Super Cycle wave IV is unfolding as a triangle, then there is no minimum requirement for Super Cycle wave (b) within it.
Super Cycle wave (b) must subdivide as a three wave structure.
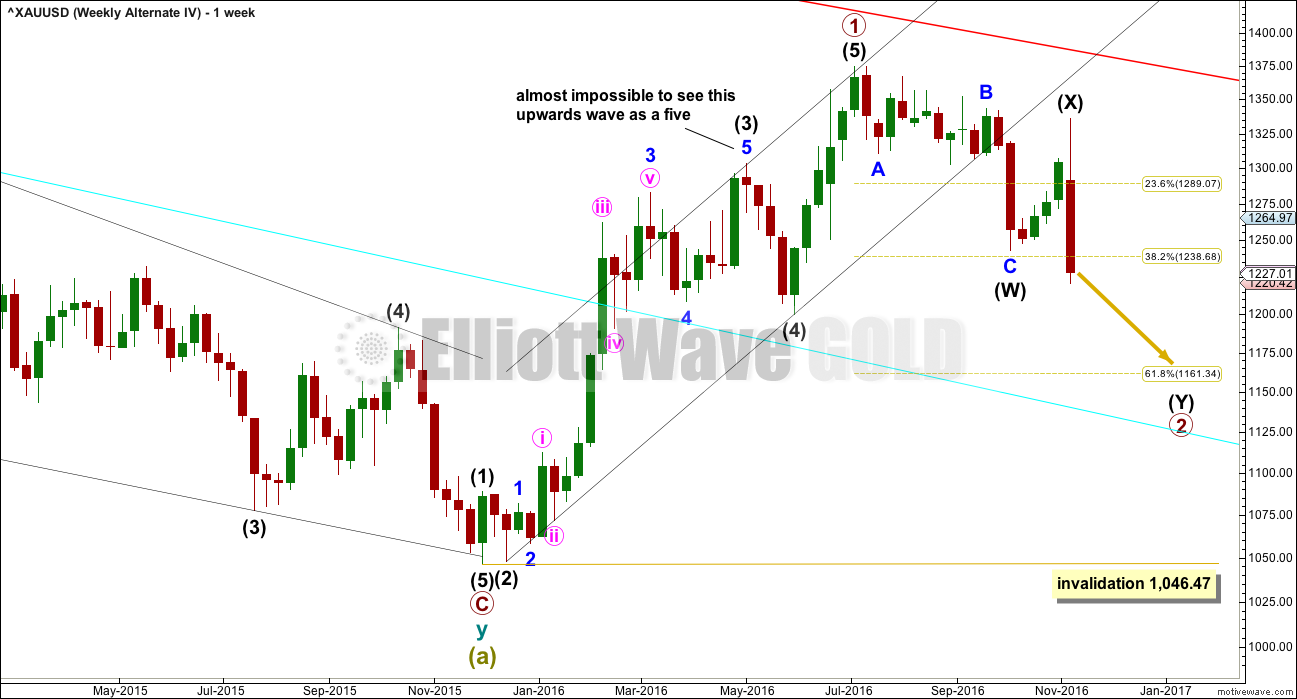
WEEKLY ELLIOTT WAVE COUNT
Click chart to enlarge.
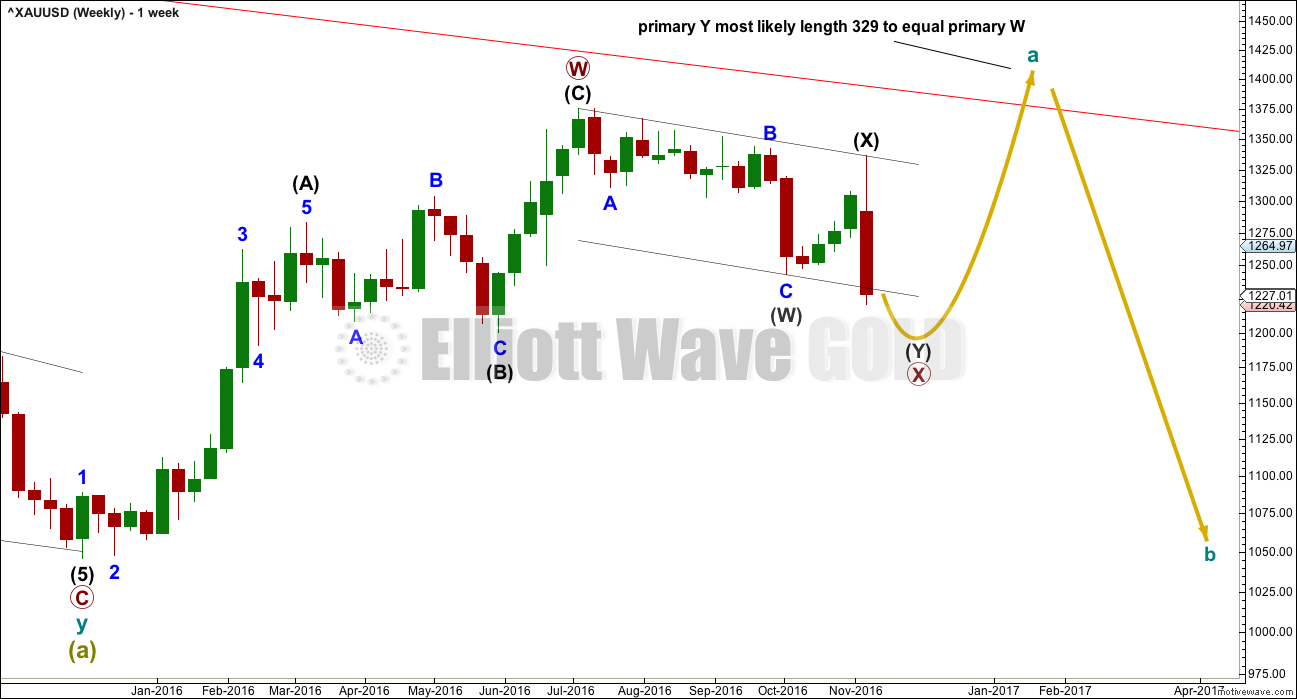
The wave up from the low on the 3rd of December, 2015, fits best as a three and looks like a zigzag. It is possible (just) that it may be a five and this idea is outlined in an alternate below.
If cycle wave a is subdividing as a three, it may be an incomplete double zigzag. The first zigzag in the double is labelled primary wave W and the double is joined by an incomplete three in the opposite direction labelled primary wave X.
The maximum number of corrections within multiple corrective structures is three. To label multiples within multiples increases the maximum beyond three violating the rule. Within each of W, Y and Z, they may only be labelled simple corrective structure A-B-C (or A-B-C-D-E in the case of triangles). X waves however are not included in the maximum; they are joining structures in the opposite direction and may subdivide as any corrective structure including multiples.
The new low for Friday confirms the wave down labelled primary wave X is incomplete.
DAILY ELLIOTT WAVE COUNT
Click chart to enlarge.
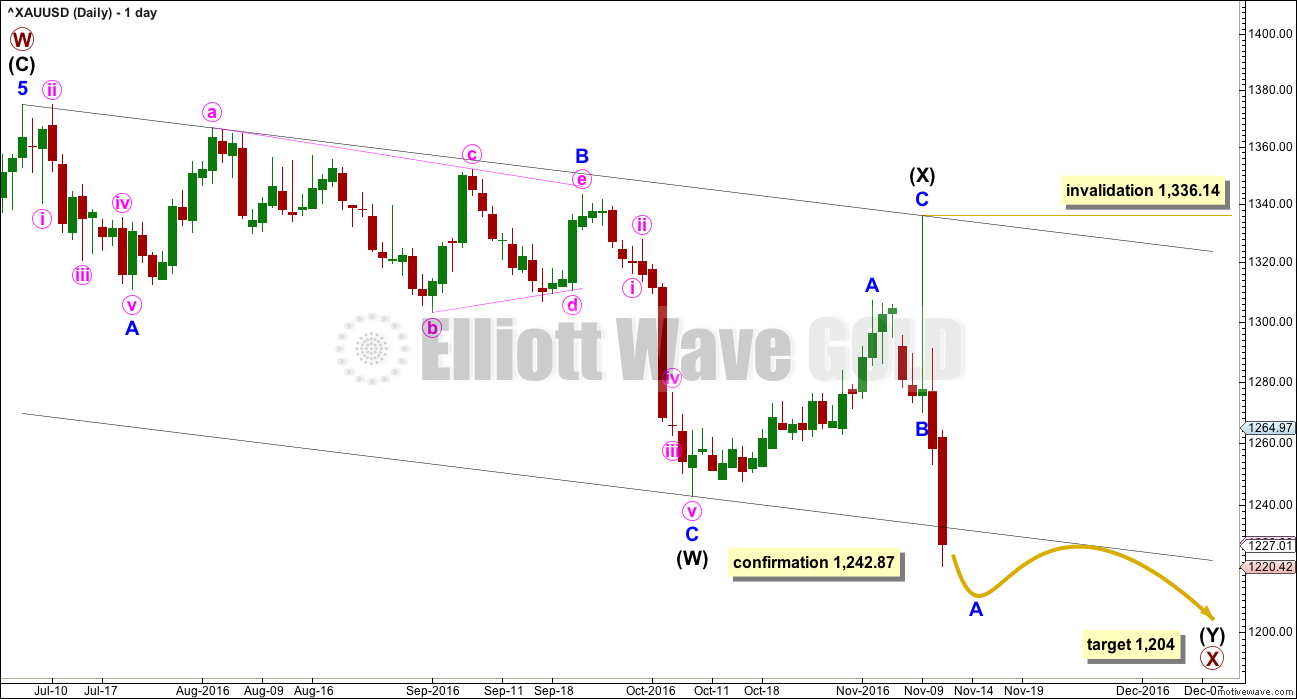
The structure of primary wave X is still seen as a multiple and still seen as incomplete, but the labelling within it today is changed. This labelling has better proportions, so it has a better overall look.
The most important implication today with this change is the larger structure of primary wave X may be either a double zigzag or a double combination. The second structure in this double for primary wave Y may be either a zigzag (for a double zigzag) or a flat or a triangle (for a double combination).
It is my judgement at this stage that it is more likely primary wave X will be a double zigzag due to the relatively shallow correction of intermediate wave (X). Although intermediate wave (X) is deep at 0.71 the length of intermediate wave (W), this is comfortably less than the 0.9 minimum requirement for a flat correction. Within combinations the X wave is most often very deep and looks like a B wave within a flat.
However, there is no minimum nor maximum requirement for X waves within combinations, so both a double zigzag and double combination must be understood to be possible. A double zigzag is more likely and that is how this analysis shall proceed.
Within the second structure, minor wave A should be a five wave structure. When it is done, then minor wave B may not move beyond the start of minor wave A above 1,336.14.
Now that minor wave A has closed below the channel about primary wave X, in the first instance minor wave B may find resistance there. If price closes back above this trend line, then Fibonacci ratios will be used for targets for minor wave B.
When minor wave B is complete, then a new target for minor wave C downwards may be calculated. The target may then change.
At this stage, at 1,204 intermediate wave (Y) would reach equality in length with intermediate wave (W). If this target is wrong, it may not be low enough.
HOURLY ELLIOTT WAVE COUNT
Click chart to enlarge.
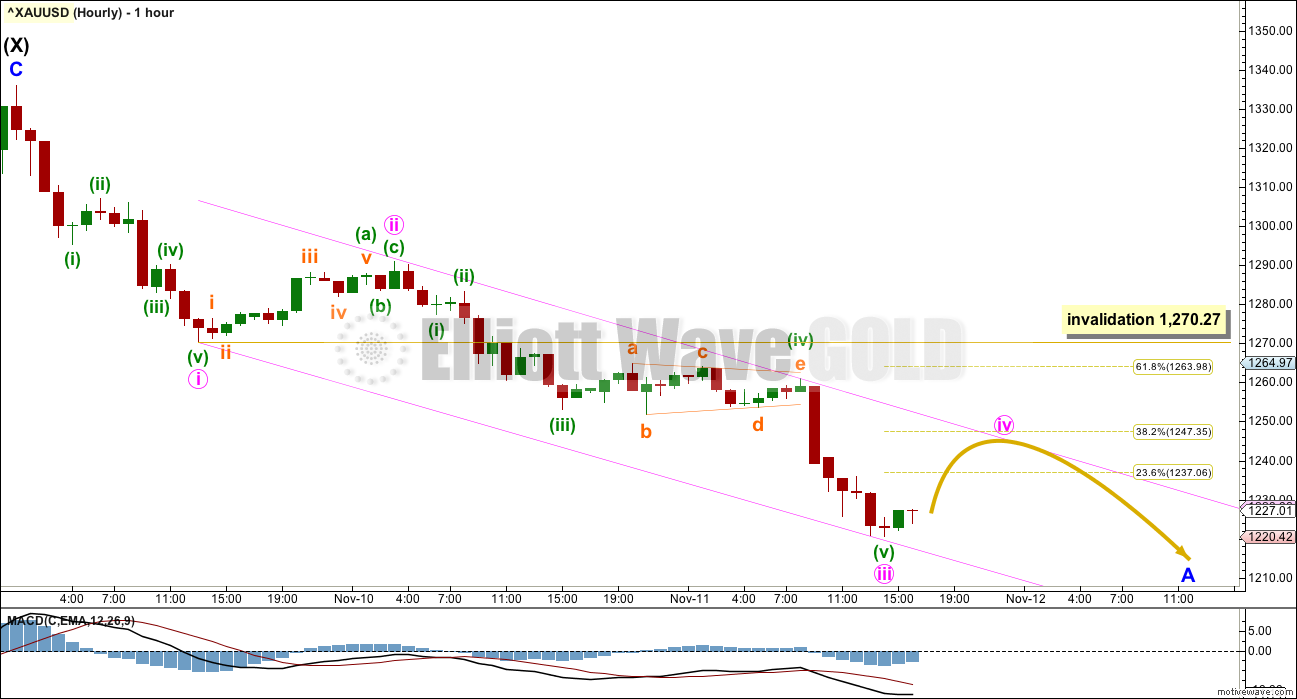
At the hourly chart level, this wave count fits perfectly within an Elliott channel. That offers some confidence to the short term expectation of where price may find resistance and support along the way down.
If minor wave A is unfolding as a five wave structure, then within it minute waves iv and v still need to complete.
Minute wave iii is longer than minute wave i but exhibits no Fibonacci ratio to minute wave i. Minute wave v would most likely be about equal in length with minute wave i, which was $65.87.
Minute wave iv should unfold upwards / sideways and may offer an opportunity to join the downwards trend. It may not move into minute wave i price territory above 1,270.27. If it ends about the 0.382 Fibonacci ratio at 1,247, then it may end at the upper edge of the channel.
Minute wave v could possibly be a strong downwards movement typical of fifth waves for commodities, but it does not have to be.
ALTERNATE WEEKLY ELLIOTT WAVE COUNT
Click chart to enlarge.
It is also possible to see the last wave up as a five wave structure. That would mean that the current correction down may be a second wave correction, not an X wave.
Cycle wave a would be subdividing as a five wave impulse rather than a three wave structure.
While this idea fits the larger picture better, the subdivisions within minor wave 5 of intermediate wave (3) are problematic. It is almost impossible to see this upwards wave as a five wave structure. That does reduce the probability of this alternate wave count.
Primary wave 2 may end close to the 0.618 Fibonacci ratio at 1,161.
Primary wave 2 may not move beyond the start of primary wave 1 below 1,046.47.
TECHNICAL ANALYSIS
WEEKLY CHART
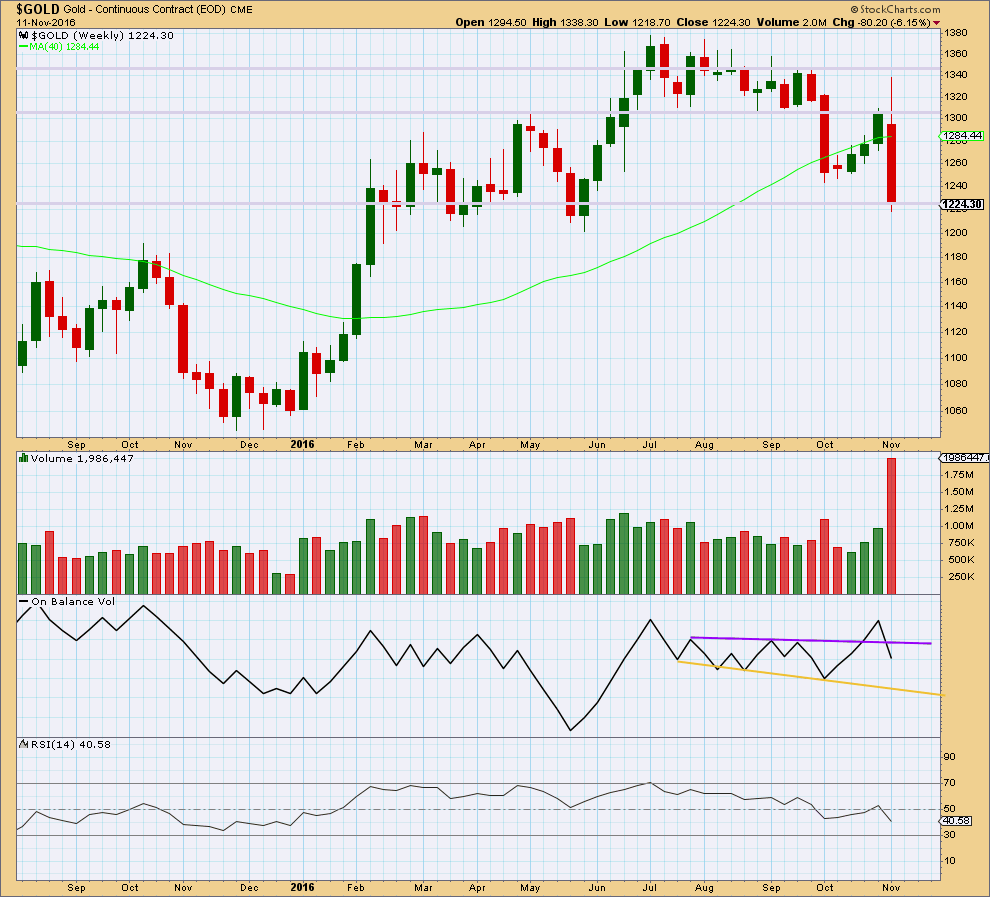
Click chart to enlarge. Chart courtesy of StockCharts.com.
A strong downwards week comes with a very strong increase in volume. The fall in price is well supported.
The long upper wick on this weekly candlestick is very bearish.
On Balance Volume gives a bearish signal this week with a break below support at the purple trend line.
RSI is not extreme. There is plenty of room for price to fall. Also, there is no divergence between price and RSI this week to indicate weakness.
The larger picture this week is very bearish.
DAILY CHART
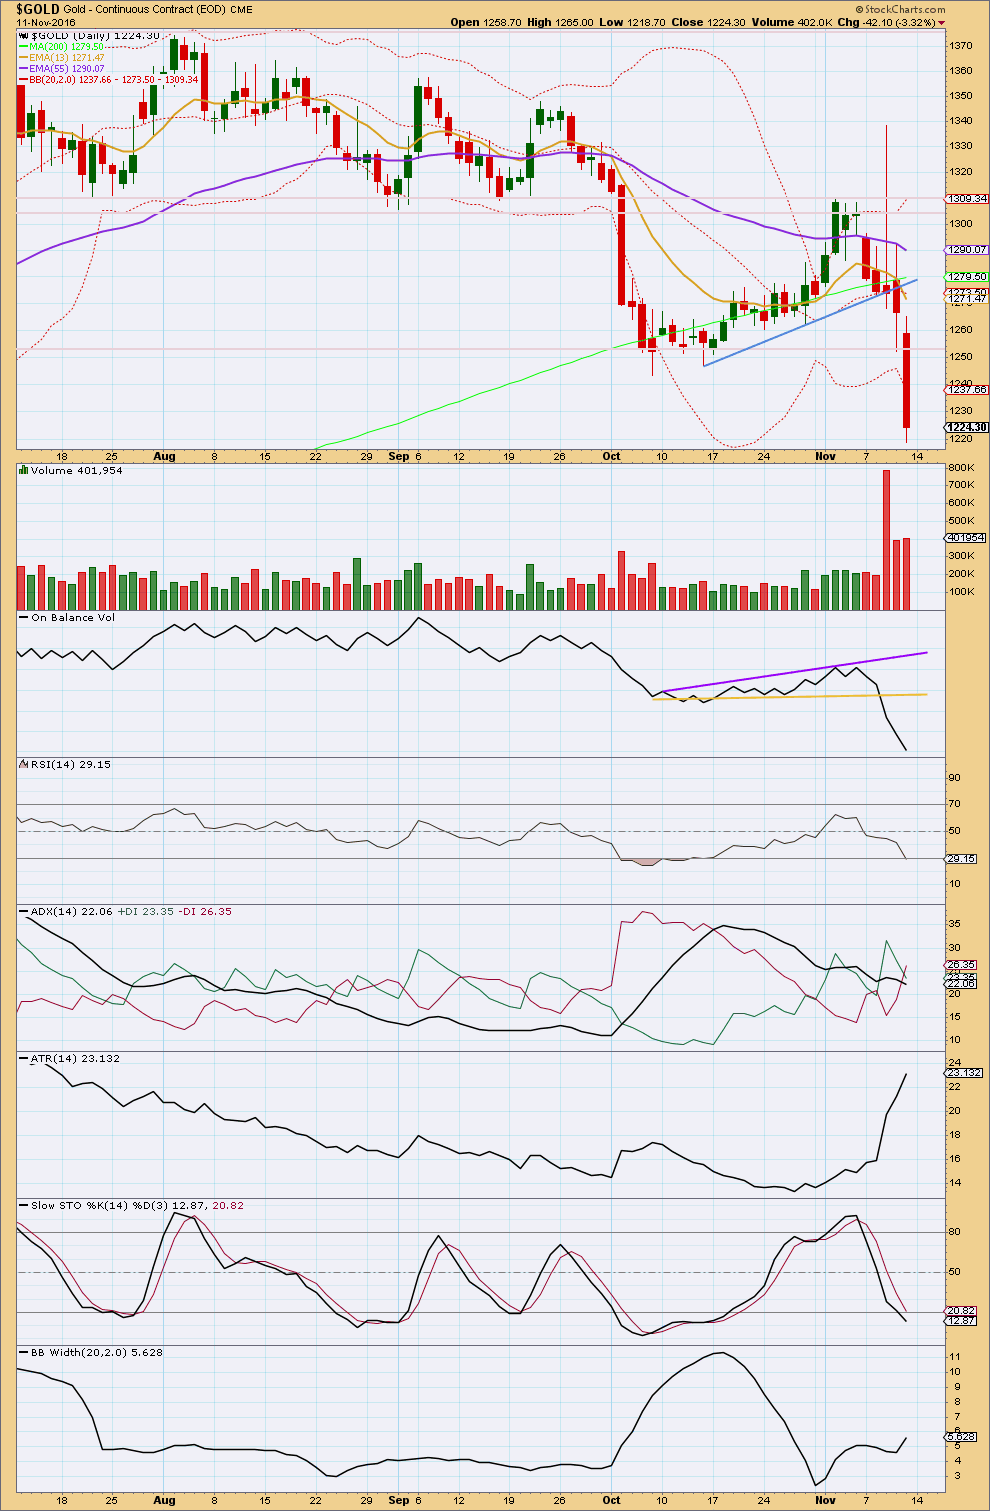
Click chart to enlarge. Chart courtesy of StockCharts.com.
Another very strong downwards day has broken below support at 1,255 and made a new swing low. This comes with strong volume, slightly higher than the prior day. The fall in price is well supported by volume.
On Balance Volume is still very bearish. There is no longer any divergence between price and OBV.
ADX has only just indicated a trend change, but it does not yet confirm a new trend as the ADX line is still declining.
ATR is strongly increasing and Bollinger Bands are widening. These strongly indicate the market is trending. The trend is down.
Price has closed below the lower edge of Bollinger Bands. During a strong trend for Gold, this can continue for another week or two before the trend ends. Look back at the last strong upwards trend: on the 3rd of February, 2016, price closed above the upper Bollinger Band range yet price continued to rise a further $120.9 reaching a high six sessions later on the 11th of February. A close outside the extreme range of Bollinger Bands for Gold should be read as a strong trend and not the end of a trend.
RSI is not yet extreme. There is divergence today between the new low here and the last swing low on the 7th of October: price has made a new low, but RSI has not. This indicates weakness in price. This may be a warning of an end to downwards movement very soon, or the divergence may disappear. Divergence is a warning; it is not certain.
Stochastics is only just now entering oversold. Only when Stochastics is oversold and then exhibits short term divergence with price may it indicate exhaustion for bears.
This analysis is published @ 09:58 p.m. EST.
On 9th November Lara asked if anyone had an entry point to please share. This morning’s open could potentially be an entry point but for confirmation of the low made yesterday, I applied Gann which is -1.75 cycles from the high on 22nd September giving a price of 1218.01 which is within the range of yesterday’s candle. The time squared gives 36.6 days since the high on the 22nd September – and this is 37 days – next square up. If you count back (not counting first candle) it is exactly 37 days.
I found the following website to better explain how I arrive at this – https://www.amazingaccuracy.com/investing-article-detail.php?artID=69
If trading the weekly from the high of 1375.04 in July, price could potentially fall to 1161.44, and time squared is 37 weeks forwards from then. It all fits in with fibonacci levels and the elliott waves although the latter two are visually easier when applied to a chart.
I also posted the same comment on the Video analysis by accident!
The real reason gold rally reversed???
The Real Reason The Rally In Gold After Trump Election Got Quashed Sending Gold Into A Tailspin
How Modi (Indian PM) Killed The Rally
India is often the biggest source of demand for physical gold. Indian Prime Minister Modi has directed that 500 and 1000 rupee notes be banned.
This is a huge deal. These notes represent 20% of cash value in circulation and 80% of cash outstanding.
Indian economy has long suffered from black money. Only 49 million out of 473 million working Indians pay taxes. A common method to convert black money into white money has been to slowly buy gold by paying cash using large bills. As large bills become worthless, this important source of demand for physical gold will disappear.
This is the real reason that gold reversed after rallying to $1339 on Trump election and subsequently fell to about $1250.
http://www.kitco.com/commentaries/2016-11-11/The-Real-Reason-The-Rally-In-Gold-After-Trump-Election-Got-Quashed-Sending-Gold-Into-A-Tailspin.html
Wow… outlawing large bank notes has a big impact on money, the economy and so wider society.
This may have unintended consequences in India. Exactly what those may be… would be guesswork at this stage.
This is fascinating.
Updated hourly chart:
It looks like minor A is now done. A few days of either sideways chop or upwards movement for minor B now.
Target for minor B: 1,288.57
Thank you Lara for your timeliness of this post. I’m needing to adjust a position and this confirms my thoughts.
Glad to hear you weren’t directly impacted by the recent quake(s) 🙂
You’re welcome.
Apparently there was a tsunami warning, I’m coastal and we have sirens. Except my whole household slept through it. That’s not gonna work Civil Defence!
No tsunami up here. There was a 5m wave down on Banks Peninsula apparently though.
And lots of poor tourists trapped in Kaikoura.
The death toll will be low though, because most of the South Island is empty of people. This one didn’t hit a city.
Gunner24 sees a gold low coming during the week of Nov 28 between 1,200 and 1,122
http://www.gunner24.com/newsletter-archive/november-2016/13112016/
Lara, is there a gold count that could be an almost complete correction like you show for GDX? For example, could Intermediate wave X end where you have Minor wave A ending, then could Intermediate wave Y be an almost complete expanded flat?
Just trying to line up the gold and GDX counts.
No, it doesn’t work. Because the Trump spike (yeah, that’s what I’m calling it) has a high which is below the prior high of 2nd Nov for GDX. That means for GDX the last small wave down can be seen as a three. But for Gold it can’t.
That’s okay. They don’t have their highs and lows / turns for long waves exactly on the same date. When GDX has it’s first second wave correction in the new wave up (for that count anyway) could be when Gold completes minor C down.
This is what I have for the daily GDX count at this time. it may change after Lara updates her count.
I have something similar… except I see the second zigzag as possibly complete. But your labelling is equally as valid. It could be only minor A of the second zigzag coming to an end.
Here’s another thing to ponder… with GDX currently if we have had a really big trend change, then you have to see the downwards waves as a series of overlapping first and second waves. This has two problems:
1. It ignores a rather obvious triangle, because you can’t have a triangle as the sole structure of a second wave. It could possibly be a triangle as part of a combination for a second wave though.
2. Each successive second wave correction of a lower degree is more time consuming than the one before. This problem of proportion must reduce the idea.
Cesar’s proofing and publishing my GDX charts now.
Lara, thank you for the new update on GDX, your additional comments here, and your feedback on my analysis.
I’m still a little confused on the “acceptable” lengths for X waves. In the case of GDX, for example, it seems that you are OK if my count shown above ends up with an X wave as low as the 19 range? That’s a fair bit lower than the 21.94 Primary wave B bottom of the leg up.
I know. It’s confusing.
Initially I put that limit in there so that there was some limit, not an unlimited amount of space below with nothing to differentiate the ideas.
There is actually no limit nor widespread convention in Elliott wave for X waves.
Here’s my angle of approach: Double zigzags should look like zigzags. They should have a clear slope, they are not sideways movements. To achieve this purpose within a double zigzag the X wave should be brief and shallow, like the B wave within a zigzag (almost always, not always).
I forced an interpretation on it that the X wave shouldn’t move beyond the start of C within the first zigzag. So that it was shallow.
I think that for double zigzags there maybe should be a guideline for their X waves which is the same as the rule for B waves within single zigzags; X waves of double zigzags shouldn’t move beyond the start of the first zigzag. That makes more sense.
So I think my first interpretation of it was wrong. And following the rule for B waves is a better idea. Unfortunately it gives ample room for X waves to be deep, not shallow.
Sometimes they can be deep within double zigzags, but it is rare.
Thanks for the explanation.
One for Silver too. These inverted H&S patterns are just speculation until they break the neckline to the upside
Chart by ThirdEyeOpen
This chart showing an even bigger Inverted H&S pattern gives us hope to move higher soon
Chart by ThirdEyeOpen
This chart showing Gold broke through the neckline of a H&S pattern is scary. Could target the 1,000 range if it fully plays out
Chart by ThirdEyeOpen
Lara, hope everything is OK way up North in your area. That was one powerful quake!
http://www.nbcnews.com/news/world/powerful-quake-shakes-christchurch-new-zealand-usgs-n683131
Thanks Dreamer, I’m just fine.
I slept through it. The tsunami sirens weren’t heard by anyone in this house…. No tsunami anyway. Nothing even to surf 🙂
My family down the line all appear to be okay too.
Good to hear. Being on the other end of the “ring of fire” in California, I’m very familiar with earthquakes!
Hi Lara, now that GDX has gone below 21.94, not sure if you are OK with GDX continuing as an X wave down?
I went back out to the monthly level and have 4 ideas. I think the first 2 match best with your current main gold count and meet the rules, but both have “issues” that you may not approve of.
Can you take a look and give some guidance and/or update your GDX analysis? Many thanks
I will be updating my GDX wave counts tomorrow. I’ll also be giving you feedback on GDX once I’ve done that.
Today I had much to do, and a day off from charts.
Thank you very much Dreamer for the work on GDX.
I agree with your conclusions.
The upwards wave from the last low in December 2015 fits best and looks like a three.
This is either a complete correction, or the first zigzag in a double, or wave A of a flat correction.
Actually, there’s one other possibility that neither of us have charted yet Dreamer. It could be wave A of a triangle.
The second thing is that the downwards movement from the high in August 2016 does not subdivide as a complete five nor look like a five. It looks like a double zigzag, and that’s how it subdivides best.
Conclusion: middle of a big correction, multiple options open, a nightmare to analyse and trade 🙁 And it’s not over yet folks.