
Yesterday’s Elliott wave analysis expected upwards movement from Gold.
Price has moved higher as expected.
Summary: On Balance Volume today gives a bullish signal and upwards movement has support from volume. The main Elliott wave count expects a fourth wave correction to end and be followed by a fifth wave up.
New updates to this analysis are in bold.
Grand SuperCycle analysis is here.
The last published monthly chart may be seen here.
DAILY ELLIOTT WAVE COUNT
Click chart to enlarge.
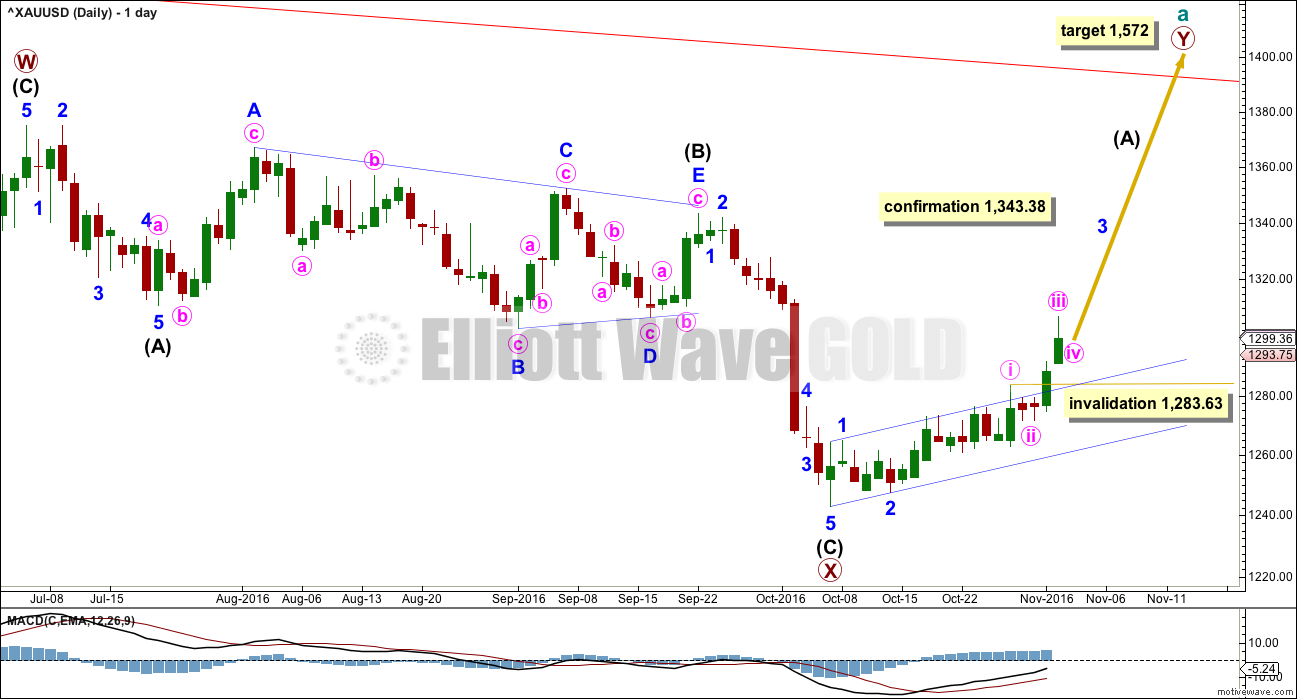
The zigzag downwards for primary wave X may be complete, at all time frames. A target for primary wave Y upwards would be about 1,569 where primary wave Y would be about even in length with primary wave W.
So far, within the five up for intermediate wave (A), minor waves 1 and 2 may be complete. Within minor wave 3, minute waves i, ii and now also iii may be complete.
Minute wave iii is very slightly shorter than minute wave i; minute wave i is 35.96 in length and minute wave iii is 35.68 in length. This limits minute wave v to no longer than equality in length with minute wave iii, so that the core rule stating a third wave may not be the shortest is met.
When minute wave v completes the impulse of minor wave 3, then minor wave 4 may unfold sideways for a few days.
Minor wave v may be extended.
HOURLY ELLIOTT WAVE COUNT
Click chart to enlarge.
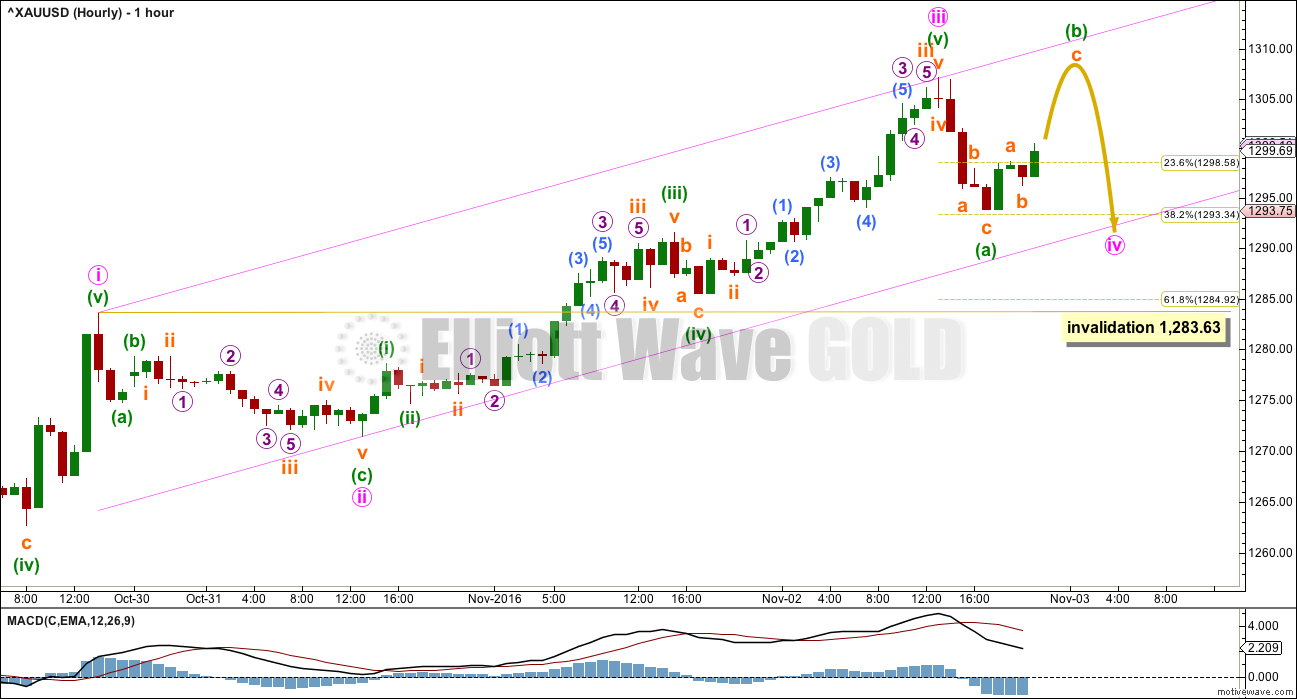
With the depth and duration of this current downwards movement, it looks like a new wave to follow the prior upwards wave. This looks like minute wave iii is over earlier than expected and minute wave iv has arrived already.
Minute wave ii was a shallow 0.34 zigzag lasting 22 hours. Minute wave iv may most likely be a flat, combination or triangle. It may be deep, but to do so it would have to breach the Elliott channel. It may exhibit alternation in structure and maybe not depth.
Draw the channel using Elliott’s technique: draw the first trend line from the ends of minute waves i to iii, then place a parallel copy on the end of minute wave ii. Minute wave iv may find support at the lower edge of this channel, and minute wave v may find resistance about the upper edge.
Minute wave iv may end within the price range of the fourth wave of one lesser degree; minuette wave (iv) has its range from 1,291.63 to 1,285.41. If it ends in this range, it may not be contained within the channel.
If minute wave iv unfolds as an expanded flat, running triangle or combination, then it may include a new high above its start at 1,307.09. A new high may be part of this correction and is not necessarily a new upwards wave. If a new high exhibits any weakness at the hourly chart level with divergence between price and MACD or RSI, and if it looks like a three wave structure upwards, then expect it is more likely part of minute wave iv.
Minute wave v will be limited to no longer than 35.68 if this labelling is correct.
ALTERNATE DAILY ELLIOTT WAVE COUNT
Click chart to enlarge.
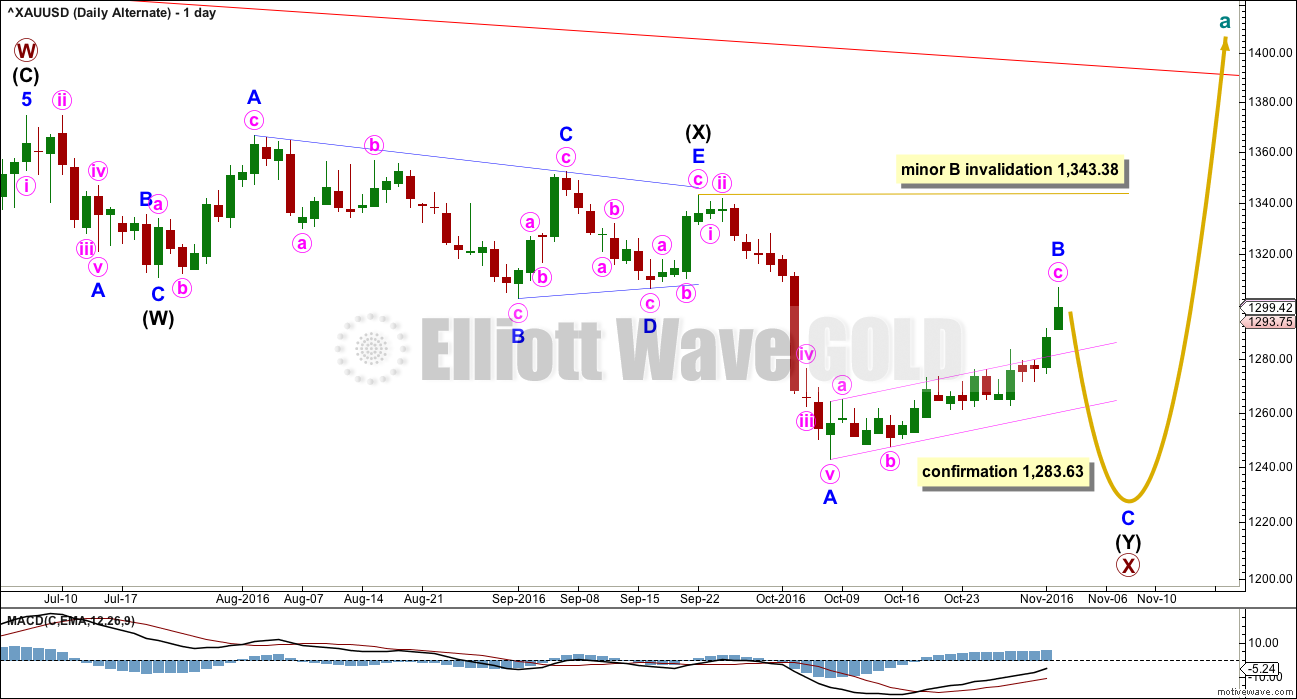
This wave count sees a correction downwards as incomplete.
Within multiple corrections labelled W-X-Y (X-Z), the rule states the maximum number of corrective structures is three. This maximum applies only to the corrective structures of W, Y and Z. Otherwise the maximum would need to be five, not three.
Within multiples, each corrective structure of W, Y and Z may only themselves be labelled as simple corrective structures: A-B-C, or A-B-C-D-E in the case of triangles. They may not themselves be labelled W-X-Y (X-Z). That would increase the maximum beyond three and violate the rule.
This rule does not apply to the joining structures labelled X. They may be any corrective structure including multiples.
The most common mistake for those new to Elliott wave or sometimes those who do not appear to have understood the rule, is to label long movements as W-X-Y-X-Z, with each of W, Y and Z also labelled as multiples. Such labelling of multiples within multiples violates the Elliott wave rule. Such analysis is of no predictive use and should not be seriously considered.
Here, the second zigzag in the double is relatively close to completion. Minor wave C may most likely be about 0.618 the length of minor wave A, which would see it about $62 in length. Minor wave C is highly likely to make at least a slight new low below the end of minor wave A at 1,242.87 to avoid a truncation. When the end of minor wave B is possible again, then a target for minor wave C downward may be calculated.
The small pink channel about minor wave B is drawn using Elliott’s technique for a correction. When this channel is breached to the downside, it will be indicating the correction of minor wave B as over and the next wave down for minor wave C as underway.
Minor wave B may be very close to completion, requiring a final high. When it is done, Gold may see a sharp reversal and a new wave down. When the end of minor wave B is known, then a target may be calculated for minor wave C. But that cannot be done today. Minor wave C would be very likely to make at least a slight new low below the end of minor wave A at 1,242.87 to avoid a truncation.
At this stage, a new low below 1,283.63 would invalidate the main wave count and provide some confidence in this alternate.
ALTERNATE HOURLY ELLIOTT WAVE COUNT
Click chart to enlarge.
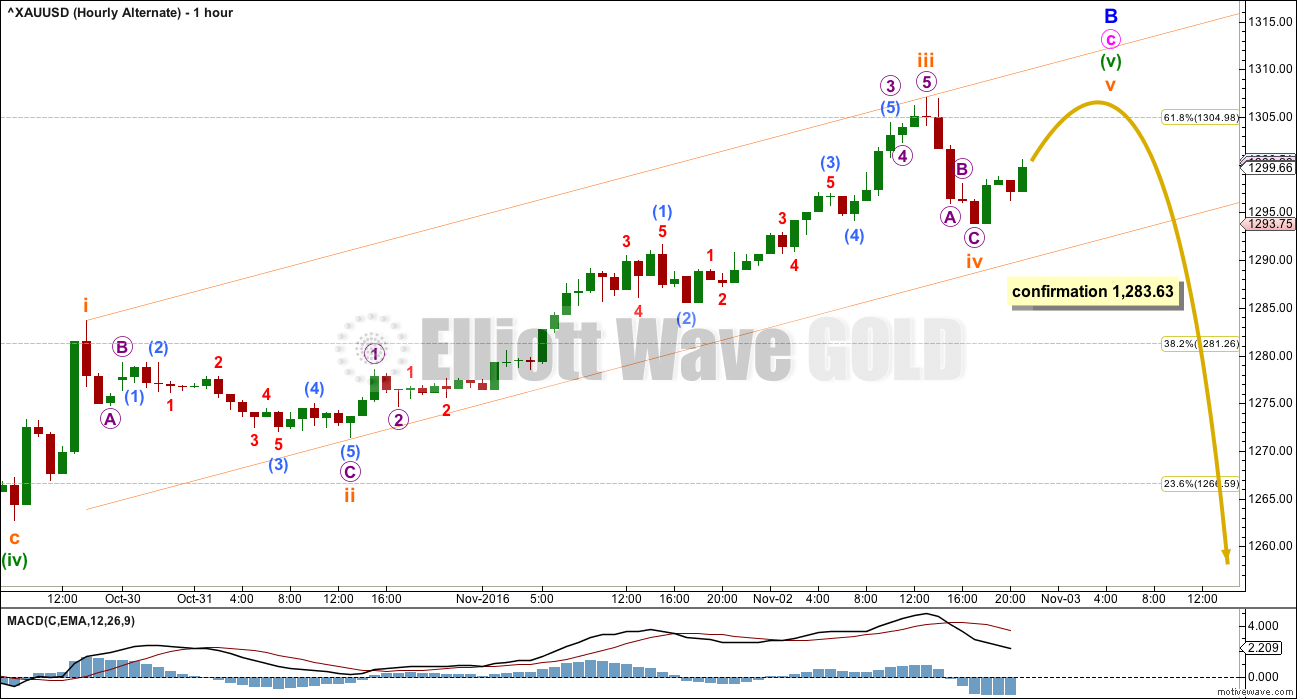
The structure within minor wave B is today changed. Minute wave C is still seen as a five wave impulse, but the proportions look better if within minuette wave (v) the corrections of subminuette waves ii and iv are as labelled here.
A new low below 1,283.63 may not be a fourth wave correction within minuette wave (v), so at that stage minuette wave (v) would have to be over. This would confirm a trend change.
The channel is drawn here using Elliott’s technique. Subminuette wave v may find resistance about the upper edge. Subminuette wave v would be very likely to make at least a slight new high above the end of subminuette wave iii at 1,307.09 to avoid a truncation. It may end close to this point, so that minor wave B ends close to the 0.618 Fibonacci ratio of minor wave A at 1,305.
TECHNICAL ANALYSIS
WEEKLY CHART
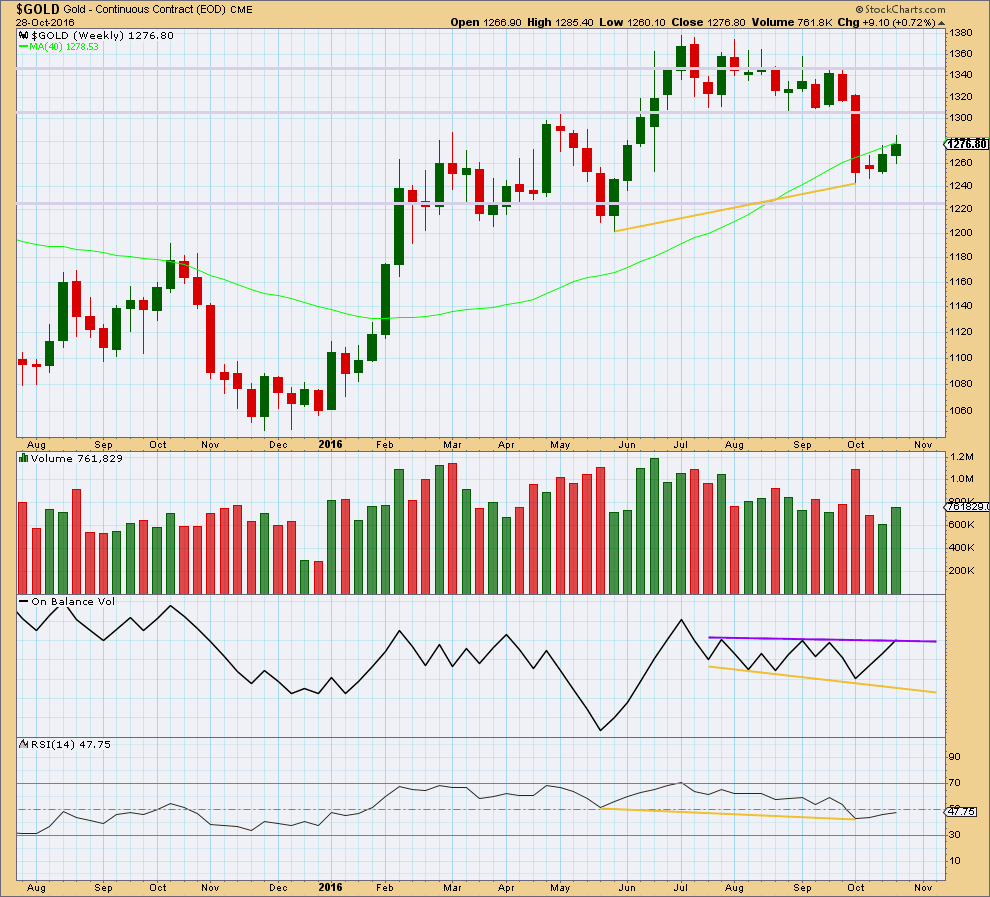
Click chart to enlarge. Chart courtesy of StockCharts.com.
Last week closes with an increase in volume. Last week’s upwards movement was supported by volume.
On Balance Volume has come up to touch the purple resistance line. This may stop price from rising any or much further next week.
The divergence between price and RSI at the last two major swing lows, indicated by gold lines, is still important. It indicates a reasonable low in place and supports the alternate wave count over the main wave count.
DAILY CHART
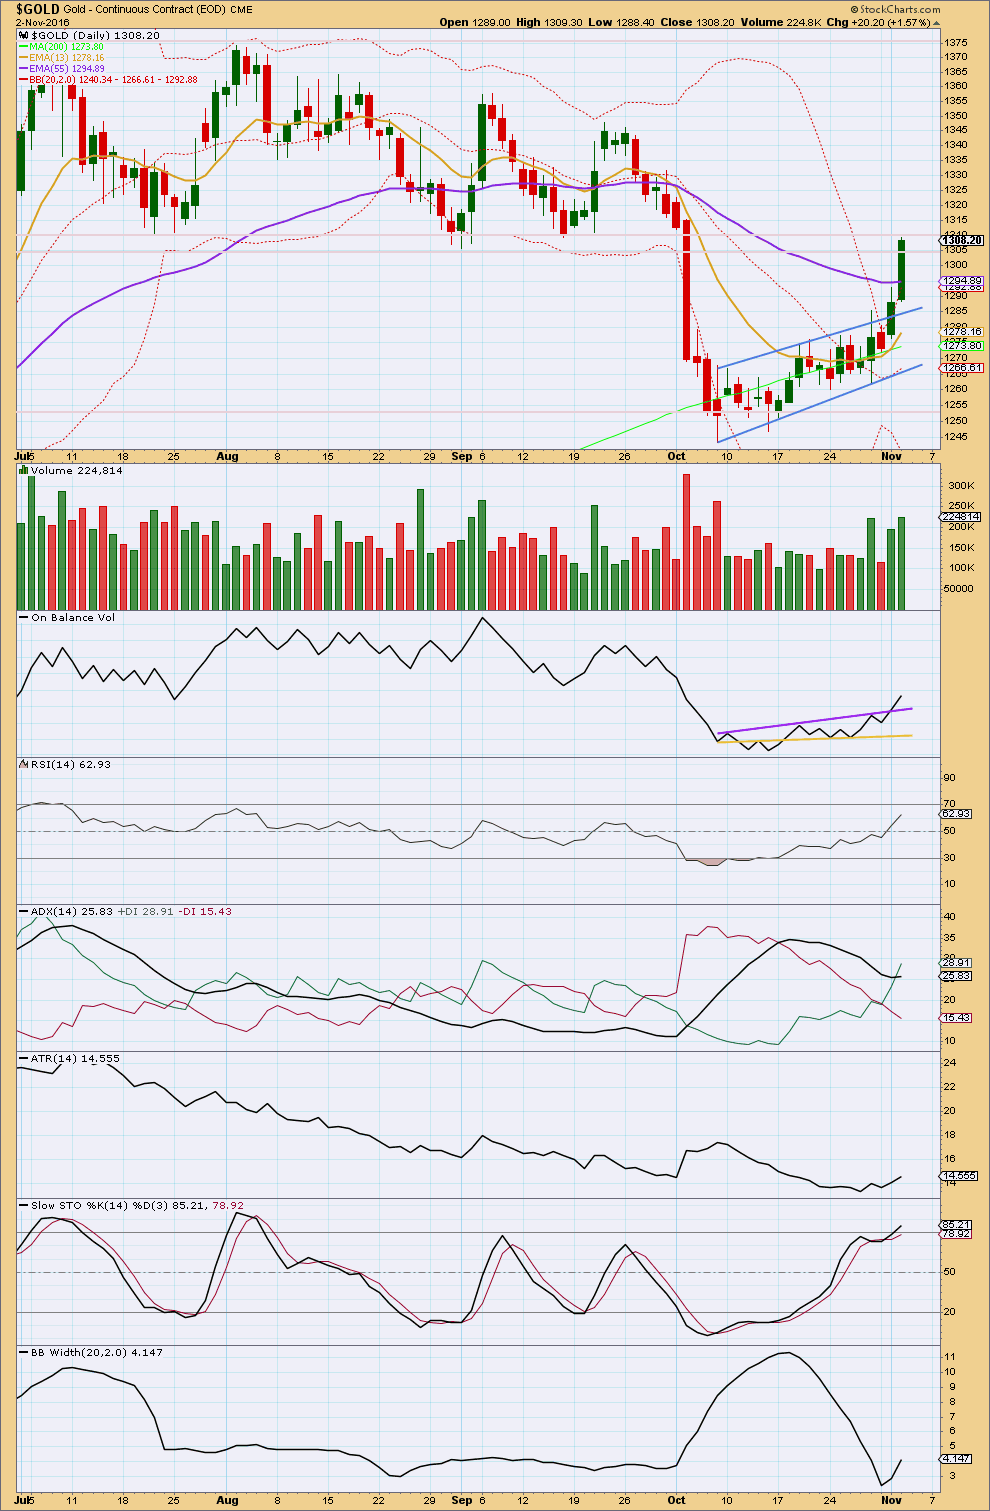
Click chart to enlarge. Chart courtesy of StockCharts.com.
Volume for today’s upwards day is strongest of all upwards movement from the last low on the 7th of October. The rise in price is supported by volume. This looks like a third or fifth wave.
On Balance Volume gives an important bullish signal today with a breach of resistance at the purple trend line. OBV usually (not always) works well with trend lines. This supports the main Elliott wave count over the alternate.
ADX today shows some increase and the +DX line is above the -DX line. ADX indicates an upwards trend.
ATR has begun to increase, so it agrees. Bollinger Bands are widening, so they also agree.
There is some resistance here for price to overcome before upwards movement can continue, about 1,305 – 1,310. This area previously provided support.
RSI is not yet extreme. There is further room for price to rise.
Stochastics is only just moving into overbought, but this oscillator may remain extreme for reasonable periods of time during a trending market. It does not show any divergence to indicate weakness in price yet.
This analysis is published @ 11:11 p.m. EST.
Minute iv fits as a regular flat. Minute ii was a zigzag. Minute iv was deep, minute ii was shallow. There is perfect alternation here and good proportion. This part of the wave count has the right look.
If this is correct labelling then minute iii is very slightly shorter than minute i, so minute v is limited to no longer than equality with iii at 1,321.85 so that minute iii is not the shortest.
At 1,308 minute v would = 0.618 X minute i.
https://goldstocksforex.com/2016/11/02/gold-trump-rally-unlikely-to-last/
Colin Twiggs sees a reversal down to 1200 before we make a more important bottom.
Rambus public gold post
https://rambus1.com/2016/11/02/wednesday-report-141/
Hi Lara. Just thinking aloud.
Could it be possible that the strong move up yesterday that had been labelled as Minute 3 is only Minuette 1 of Minute 3? This will sidestep the problem of Minute 3 being shorter than Minute 1. Also, it means that the move up is a strong third wave.
Yes, entirely possible.
I’m wondering if RSI closing in on overbought allows for that much more upwards movement though before it gets extreme then shows divergence…
So my main idea is that today’s selloff is just another 2nd wave correction designed to shake out he bulls. This correction may be complete as a zig-zag, but more likely will last another couple of days and may morph into a flat, expanded flat, or double zigzag.
When it arrives, Minor wave 3 should be powerful enough to break through the downtrend line resistance that has held since August.
A break below the blue uptrend channel will be the first warning that this count is wrong. A final break below 23.43 (good place for stops) will likely mean that GDX goes down to make a new low below 22.50.
These next few days until the election may be volatile. Good luck all. I hope you find this useful.
A correction was expected today for GDX, but the selloff was pretty sharp. It’s not surprising that GDX was unable to hold a breakout on it’s first try of the down trend line that has been in place since August.
~ RSI is still above 50 = bullish
~ PRICE produced a bearish engulfing type candle on strong VOLUME = bearish
~ MACD remains positive albeit below zero
~ OBV crossed back below horizontal resistance / support = bearish
Overall, the move down today looks more bearish than bullish. The bulls hope is that this is just another strong 2nd wave correction.
Hi Lara. That candle today from stockcharts (I got the same thing) looks incorrect as price did not end at the session high. See GLD’s candle
I know, that’s because StockCharts use NY session only data, while BarChart use 24 hour data.
So the StockCharts data ended before the turn down which brought the close lower for that candlestick on BarChart.