
A new low below 1,172.10 indicated more downwards movement, but the target for the alternate Elliott wave count at 1,169 was inadequate.
Summary: Either a consolidation to last at least a few days or a trend change to a new wave up is expected now. If the new low today exhibits any divergence between price and RSI, then confidence would be had in a reversal here. Bears are in charge, but are weakening. The Elliott wave picture is complicated, but in my judgement the most likely scenario is a third wave up about here. The target would be at 1,695.
New updates to this analysis are in bold.
Grand SuperCycle analysis is here.
MONTHLY ELLIOTT WAVE COUNT
Click chart to enlarge.
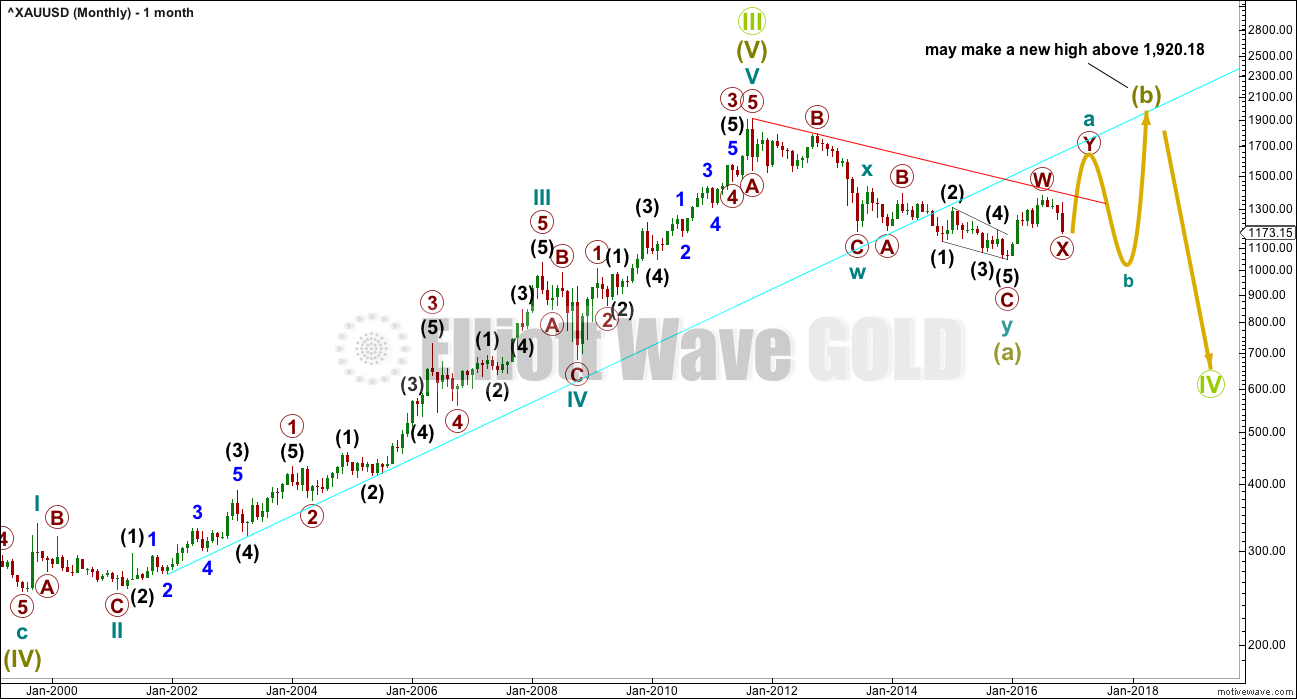
The large wave down labelled Super Cycle wave (a) may be seen either as a three or a five. This first monthly chart sees it as a three.
If Super Cycle wave (a) is a three, then Super Cycle wave (b) may make a new high above its start at 1,920.18.
The larger structure is seen as Grand Super Cycle wave IV. When a fourth wave begins with a three wave structure for its A wave, then a flat, combination or triangle is indicated. In this case, with Super Cycle wave (a) a double zigzag, a combination for Grand Super Cycle wave IV may be eliminated because multiples may not subdivide into multiples. This leaves two possible structures for Grand Super Cycle wave IV: a flat or a triangle.
If Grand Super Cycle wave IV is unfolding as a flat correction, then within it Super Cycle wave (b) must retrace a minimum 0.9 length of Super Cycle wave (a) at 1,832.78.
If Grand Super Cycle wave IV is unfolding as a triangle, then there is no minimum requirement for Super Cycle wave (b) within it. While there is no minimum, Super Cycle wave (b) is highly unlikely to be over here because it should be deeper. A common range for subwaves of triangles is about 0.8 to 0.85 the prior wave; this is from 1,745 to 1,789. For a triangle to have the right look, Super Cycle wave (b) should be only about half way through.
Super Cycle wave (b) must subdivide as a three wave structure.
WEEKLY ELLIOTT WAVE COUNT – Super Cycle wave (a)
Click chart to enlarge.
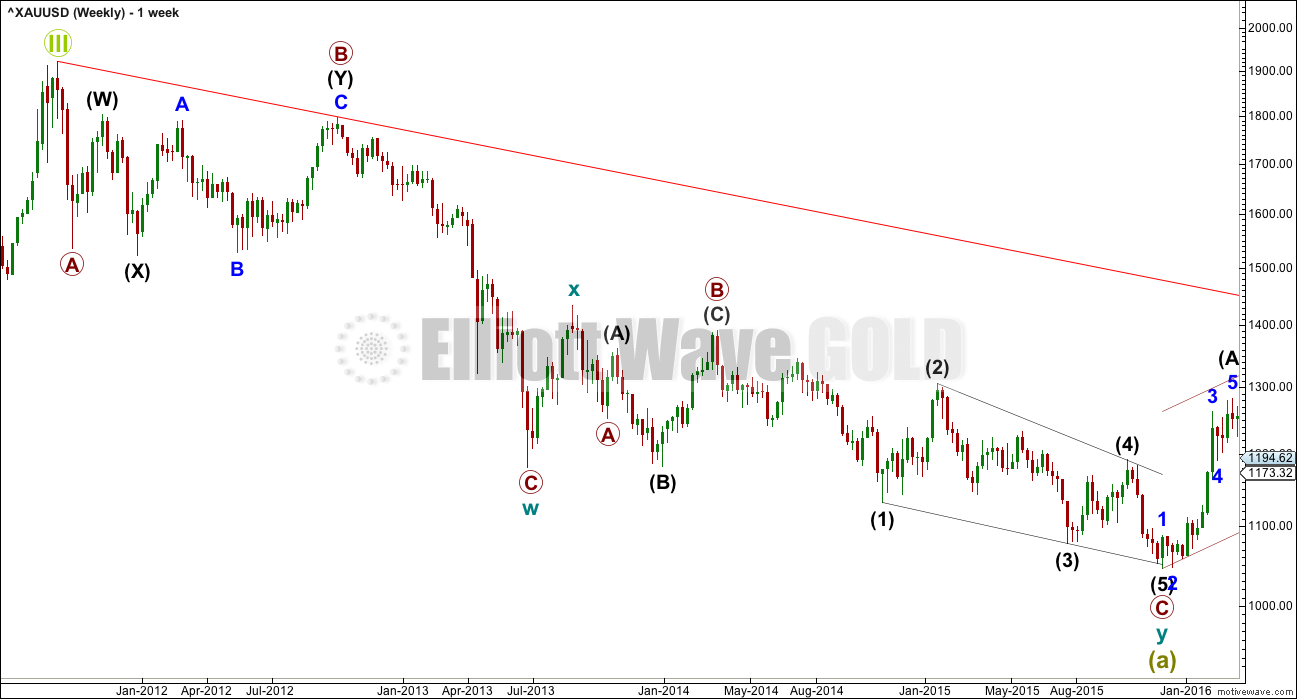
If the large wave down from the all time high is seen as a double zigzag, then the proportions are good and all subdivisions fit perfectly.
The first zigzag in the double is labelled cycle wave W. Within cycle wave W, primary wave B is a combination and primary wove C is just 8.49 short of 1.618 the length of primary wave A.
The double is joined by a brief shallow three in the opposite direction labelled cycle wave X. X waves within double zigzags are normally very brief and shallow, so it is okay that this one lasted just 8 weeks. Duration of waves is a rough guideline only and sometimes corrections are quicker than impulses.
The second zigzag in the double labelled cycle wave y exhibits no Fibonacci ratio to the first zigzag labelled cycle wave w. Within cycle wave y, there is no Fibonacci ratio between primary waves A and C, primary wave B is an expanded flat correction, and primary wave C is an ending contracting diagonal.
WEEKLY ELLIOTT WAVE COUNT
Click chart to enlarge.
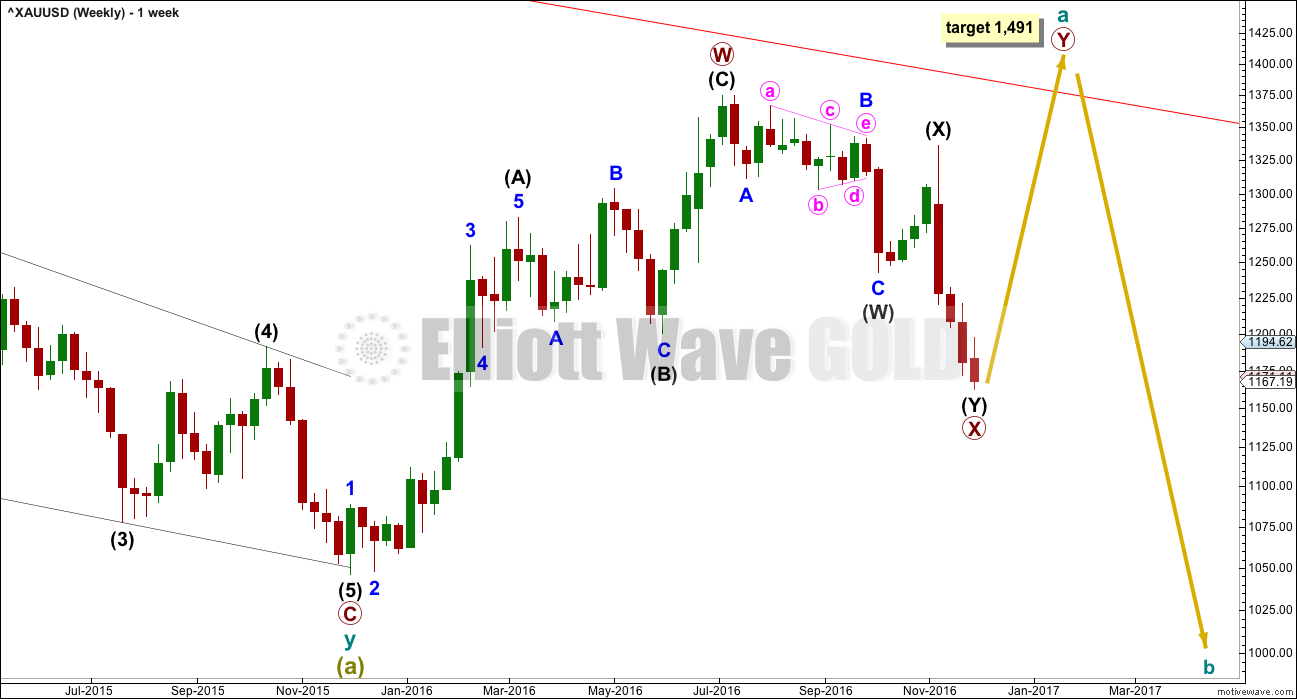
The wave up from the low on the 3rd of December, 2015, fits best as a three and looks like a zigzag. It is possible that it may be a five and this idea is outlined in an alternate below.
If cycle wave a is subdividing as a three, it may be an incomplete double zigzag. The first zigzag in the double is labelled primary wave W and the double is joined by an incomplete three in the opposite direction labelled primary wave X.
The maximum number of corrections within multiple corrective structures is three. To label multiples within multiples increases the maximum beyond three violating the rule. Within each of W, Y and Z, they may only be labelled simple corrective structure A-B-C (or A-B-C-D-E in the case of triangles). X waves however are not included in the maximum; they are joining structures in the opposite direction and may subdivide as any corrective structure including multiples.
Primary wave X has now moved below the end of intermediate wave (B) within primary wave W. It is my judgement that this reduces the probability of this wave count although no rules nor guidelines are broken. There is no rule stating a limit for X waves within double zigzags or double combinations, but within double zigzags the X wave is usually very brief and shallow and this one is now neither.
At 1,491 now primary wave Y would reach equality in length with primary wave W.
WEEKLY ALT ELLIOTT WAVE COUNT
Click chart to enlarge.
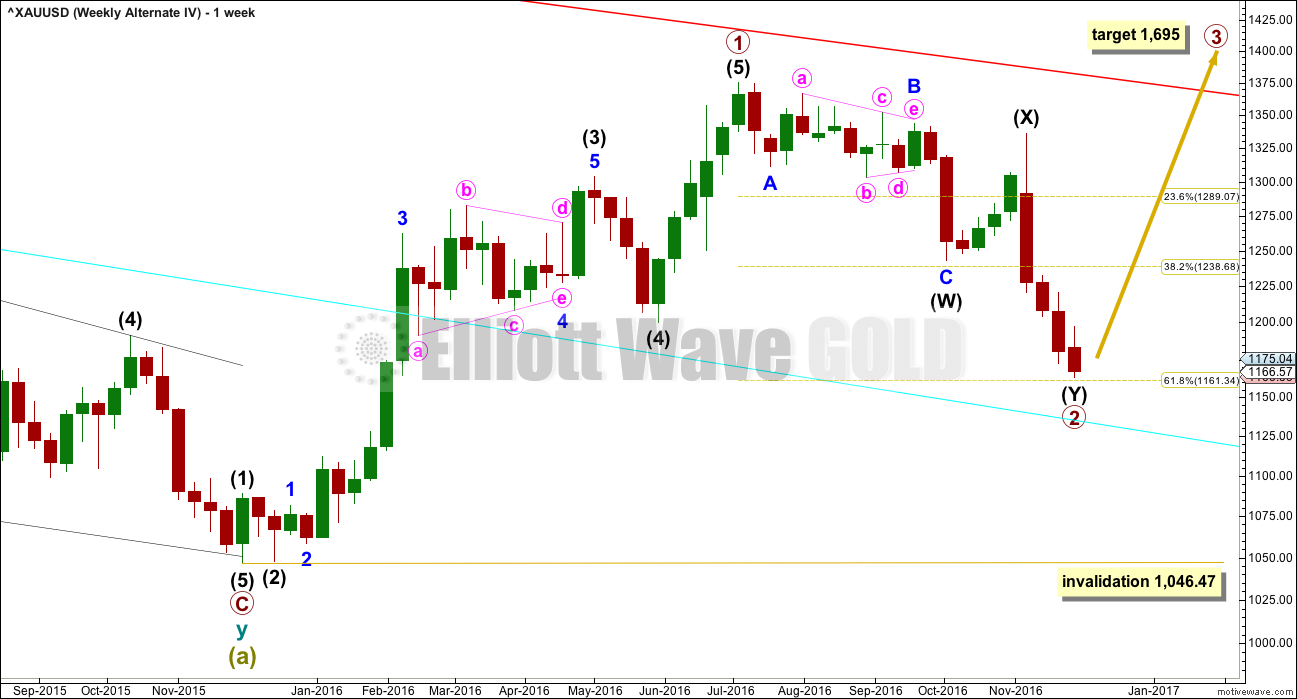
What if cycle wave a is unfolding as a five and not a three? Waves 1 and now 2 may be complete within it.
It is possible to see the wave up from the low at December 2015 to the last major high as a five wave structure. With minor wave 4 now labelled as a triangle, a prior problem with how minor 5 subdivides is resolved. I have more confidence in this wave count now that this problem is resolved.
Primary wave 2 may now be complete as a double zigzag. This is a very common structure for a second wave. Primary wave 2 is very close to the 0.618 Fibonacci ratio of primary wave 1 and this depth is also common for a second wave. Because this part of the wave count at this stage looks so typical, it is my judgement today that this may be the most likely scenario.
If primary wave 2 is over here, then at 1,695 primary wave 3 would reach 1.618 the length of primary wave 1. If primary wave 2 moves any lower, then this target must also move correspondingly lower.
Primary wave 2 may not move beyond the start of primary wave 1 below 1,046.47.
DAILY ELLIOTT WAVE COUNT
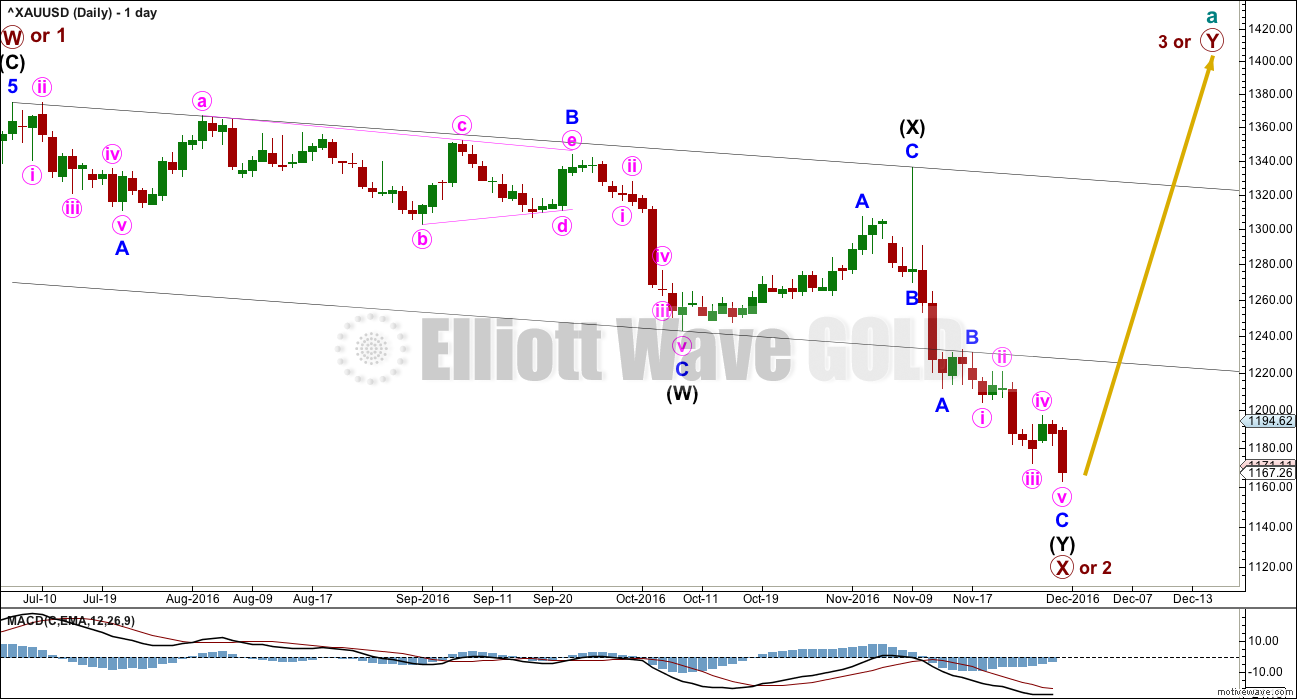
Click chart to enlarge.
This daily chart works the same way for the two weekly charts above. Both weekly charts above see downwards movement as an almost complete double zigzag.
The larger structure of primary wave X (or primary wave 2) may be either a double zigzag or a double combination. The second structure in this double for primary wave Y may be either a zigzag (for a double zigzag) or a flat or a triangle (for a double combination).
If the next wave up is primary wave 3, then it may only subdivide as an impulse.
It is my judgement at this stage that it is more likely primary wave X will be a double zigzag due to the relatively shallow correction of intermediate wave (X). Although intermediate wave (X) is deep at 0.71 the length of intermediate wave (W), this is comfortably less than the 0.9 minimum requirement for a flat correction. Within combinations the X wave is most often very deep and looks like a B wave within a flat.
However, there is no minimum nor maximum requirement for X waves within combinations, so both a double zigzag and double combination must be understood to be possible. A double zigzag is more likely and that is how this analysis shall proceed.
Within the second structure, minor wave A should be a five wave structure.
Minor wave B found resistance at the lower edge of the wide parallel channel about primary wave X. Along the way up, price may find resistance at the lower edge of this channel.
Minor wave C may now again be complete at the hourly chart level.
HOURLY ELLIOTT WAVE COUNT
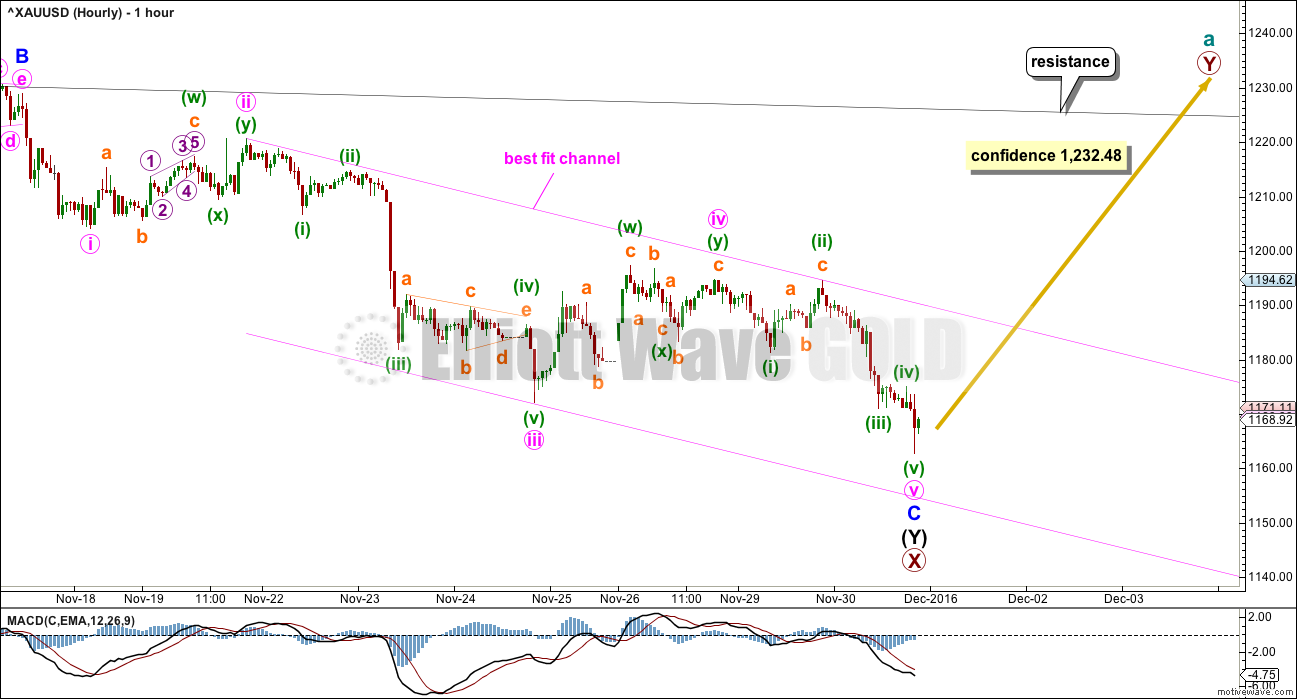
Click chart to enlarge.
Minor wave C has moved lower. There is no Fibonacci ratio between minor waves A and C.
Ratios within minor wave C are: there is no Fibonacci ratio between minute waves i and iii, and minute wave v is 1.81 longer than 0.618 the length of minute wave iii.
The short, sharp thrust downwards to the last low looks like a capitulation spike for minute wave v. The long lower wick on this candlestick is bullish.
Some confidence in a trend change of a reasonable magnitude may now be had with a new high above 1,232.48.
ALTERNATE MONTHLY ELLIOTT WAVE COUNT
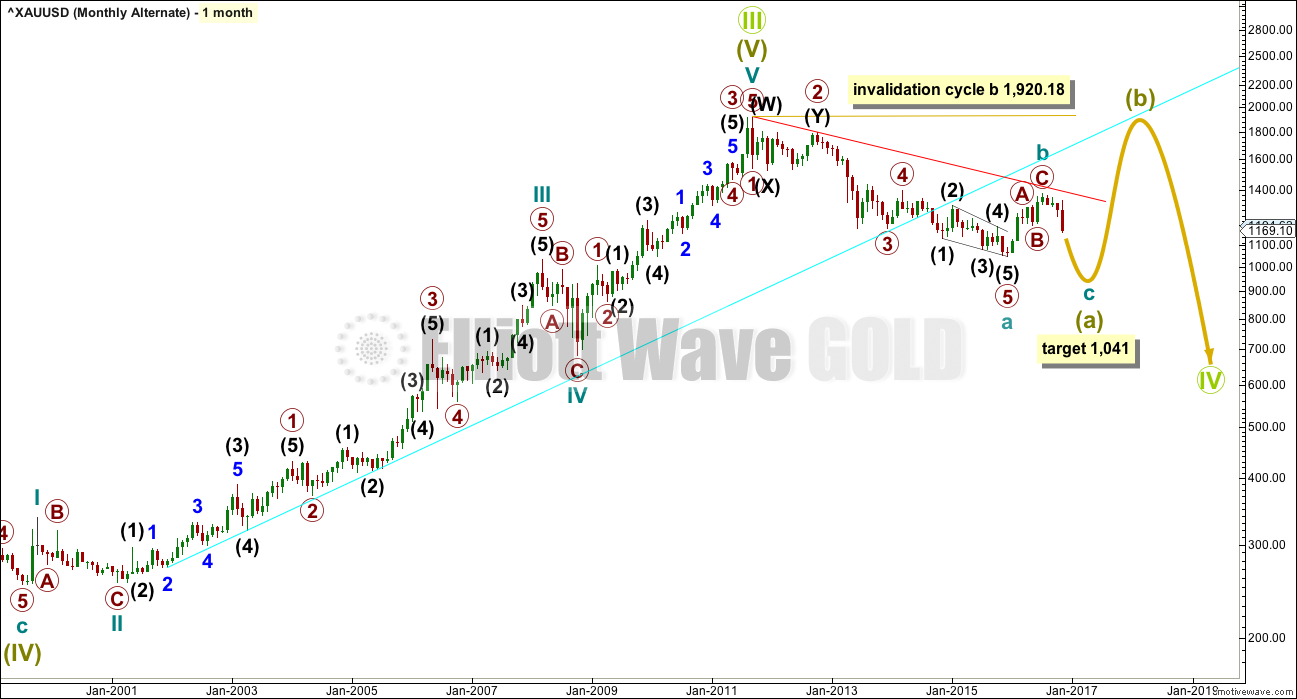
Click chart to enlarge.
It is also possible to see the large downwards wave from the all time high as a five wave structure. Super Cycle wave (a) may be an incomplete zigzag, to subdivide 5-3-5.
Prior problems with this wave count have been resolved, and this is detailed in the weekly detail chart shown below.
If cycle wave a is a five, then cycle wave b may not move beyond its start above 1,920.18. Cycle wave b may now be a complete single zigzag ending just below the 0.382 Fibonacci ratio of cycle wave a. Cycle wave b is 0.376 the length of cycle wave a. Cycle wave b may have ended close to resistance at the red trend line.
At 1,041 cycle wave c would reach 0.382 the length of cycle wave a.
ALTERNATE WEEKLY ELLIOTT WAVE COUNT – Super Cycle wave (a)
Click chart to enlarge.
If primary wave 2 is seen as a longer lasting double combination, then the prior problems with the base channel and proportion are resolved.
Primary wave 1 lasted 3 weeks. Primary wave 2 lasted 51 weeks. Primary wave 2 is a deep 0.65 double combination.
Primary wave 3 lasting 66 weeks is 20.84 short of 1.618 the length of primary wave 1. The close Fibonacci ratio is lost, but this is less than 10% the length of primary wave 3 and so I consider it close enough to say a ratio exists.
Primary wave 4 lasts just 11 weeks and is a shallow 0.35 zigzag. The disproportion between primary waves 2 and 4 is reasonably acceptable; zigzags do tend to be quicker structures than combinations.
Primary wave 5 is an ending contracting diagonal lasting a Fibonacci 89 weeks exactly.
Problems:
1. Minor wave 3 within intermediate wave (3) within primary wave 3 ends with a truncation of 17.08. This comes after a movement that fits the description of “too far, too fast”, so the truncation is acceptable.
2. Primary wave 3 ends with a small truncation. Intermediate wave (5) is truncated by 1.96. This is small and also comes after a long fast movement ending intermediate wave (3), so this is acceptable.
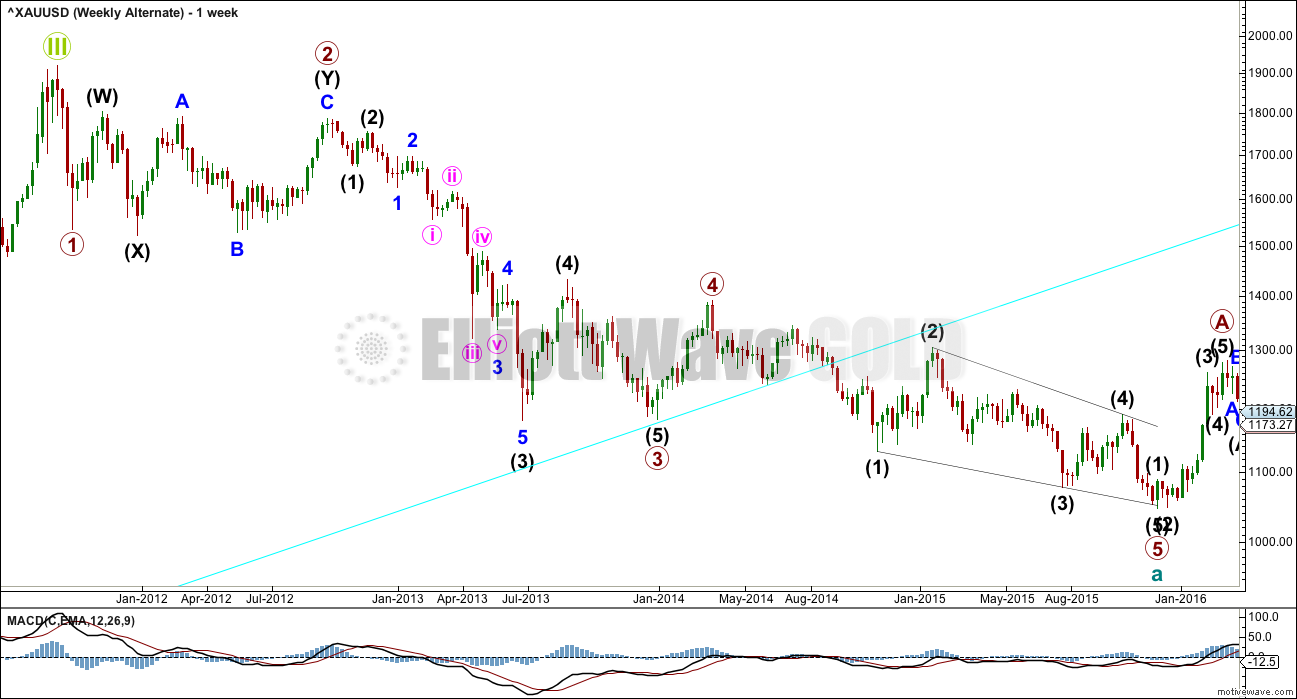
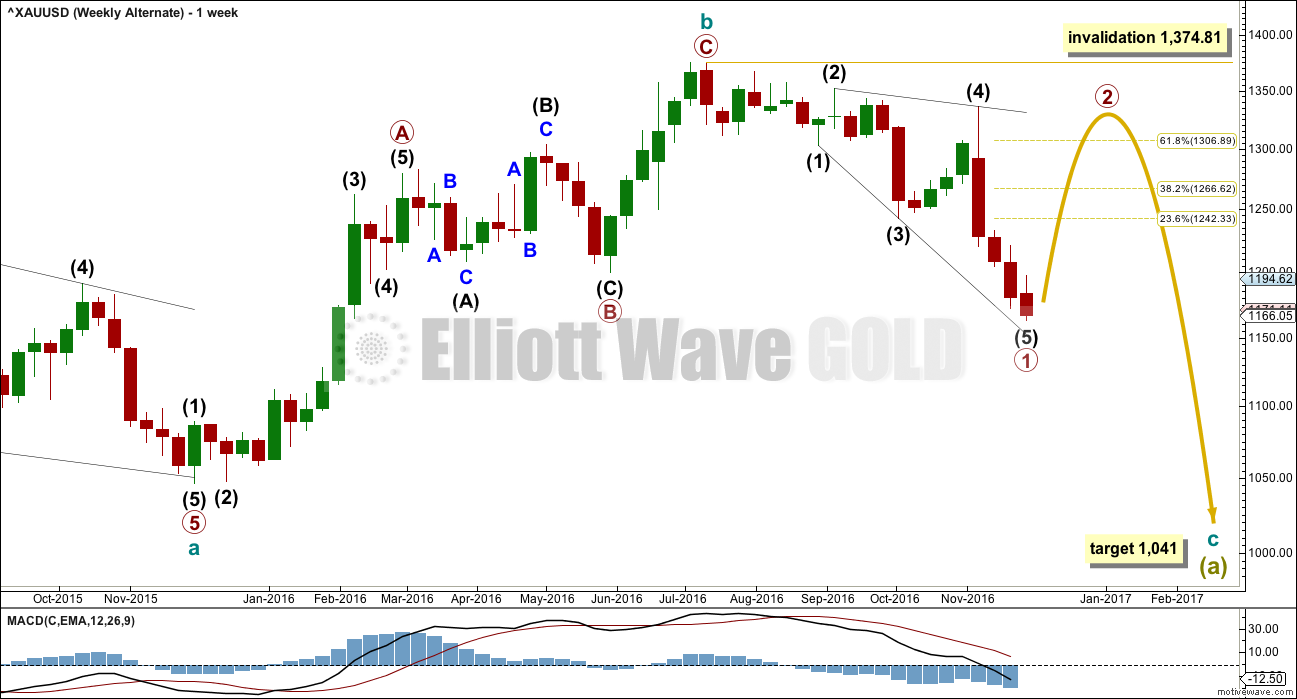
ALTERNATE WEEKLY ELLIOTT WAVE COUNT
Click chart to enlarge.
If the last high was a trend change at cycle degree, then a five wave structure downwards should develop from there.
Cycle wave c must subdivide as a five wave structure. It may be either an impulse or ending diagonal. Within cycle wave c, the first wave of primary wave 1 must also be a five, either an impulse or a leading diagonal.
It is possible that primary wave 1 completed as a leading expanding diagonal. However, while these are not rare structures they are not very common either. When first waves subdivide as diagonals, they are most often contracting and not commonly expanding. This reduces the probability of this wave count.
When first waves subdivide as leading diagonals, they are then typically followed by very deep second waves. Primary wave 2 would most likely be deeper than the 0.618 Fibonacci ratio of primary wave 1.
Primary wave 2 may not move beyond the start of primary wave 1 above 1,374.41.
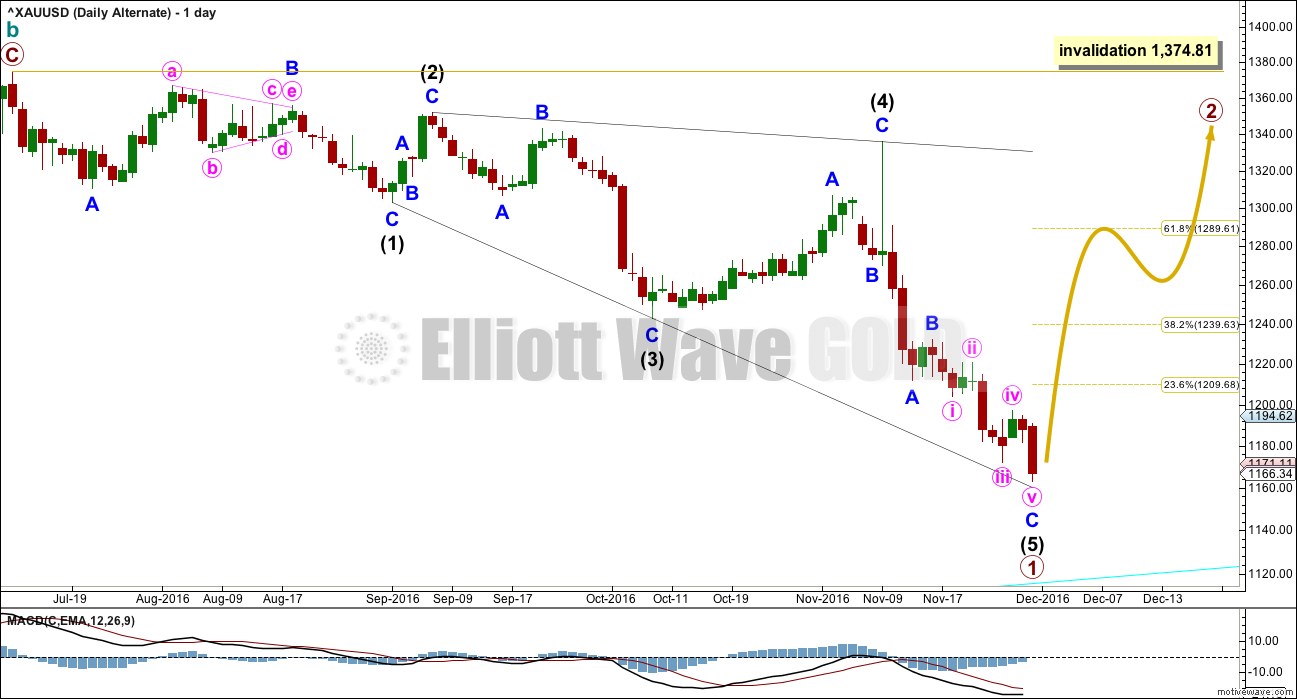
ALTERNATE DAILY ELLIOTT WAVE COUNT
Click chart to enlarge.
Within leading diagonals, sub-waves 2 and 4 must subdivide as zigzags. Sub-waves 1, 3 and 5 are most commonly zigzags but sometimes may also appear to be impulses.
Within this structure, all sub-waves subdivide as zigzags. This wave count meets all Elliott wave rules. This diagonal looks correct.
This wave count has a lower probability at the daily chart level because leading diagonals are not very common structures for first waves. When first waves do subdivide as leading diagonals, they are most often contracting and not expanding. This wave count does not rely upon a rare structure, but it does rely upon a less common structure.
Primary wave 1 lasted 102 days. Primary wave 2 may initially be expected to last about a Fibonacci 55 or 89 days. It should be a big three wave structure.
At the hourly chart level, this alternate wave count would be essentially the same as the main hourly chart; minor wave C may now be complete.
At this stage, there is no divergence in expected direction between this alternate and the main wave count. The structure of upwards movement, if it is clearly a three or five, may assist to tell us which wave count is correct in coming weeks. For now this alternate must be judged to have a low probability due to the problems outlined. It is published to consider all possibilities.
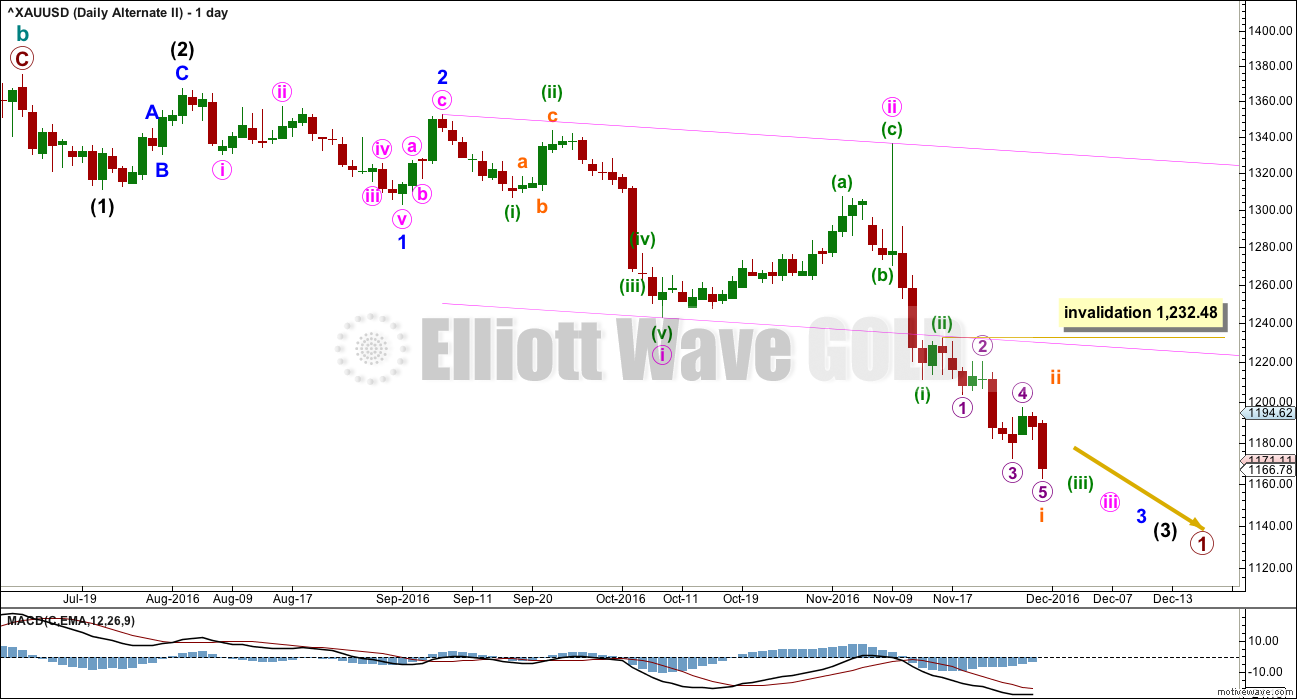
SECOND ALTERNATE DAILY ELLIOTT WAVE COUNT
Click chart to enlarge.
What if a new bear market is underway for cycle wave c? The most likely structure would be an impulse. At this stage, price may be close to the middle of a third wave within primary wave 1 down.
This wave count has a problem of proportion at the daily chart level: minute wave ii lasted 23 sessions and intermediate wave (2) three degrees higher lasted just 8 sessions. Lower degree corrections should be more brief than higher degree corrections. This is not always the case, but when the duration is substantially different then it must necessarily reduce the probability of the wave count.
The pink channel here is a base channel about minute waves i and ii. Price should continue to find resistance at the lower edge of the base channel now that it has breached the channel.
When subminuette wave i is complete, then subminuett wave ii upwards may not move beyond the start of subminuette wave i above 1,232.48.
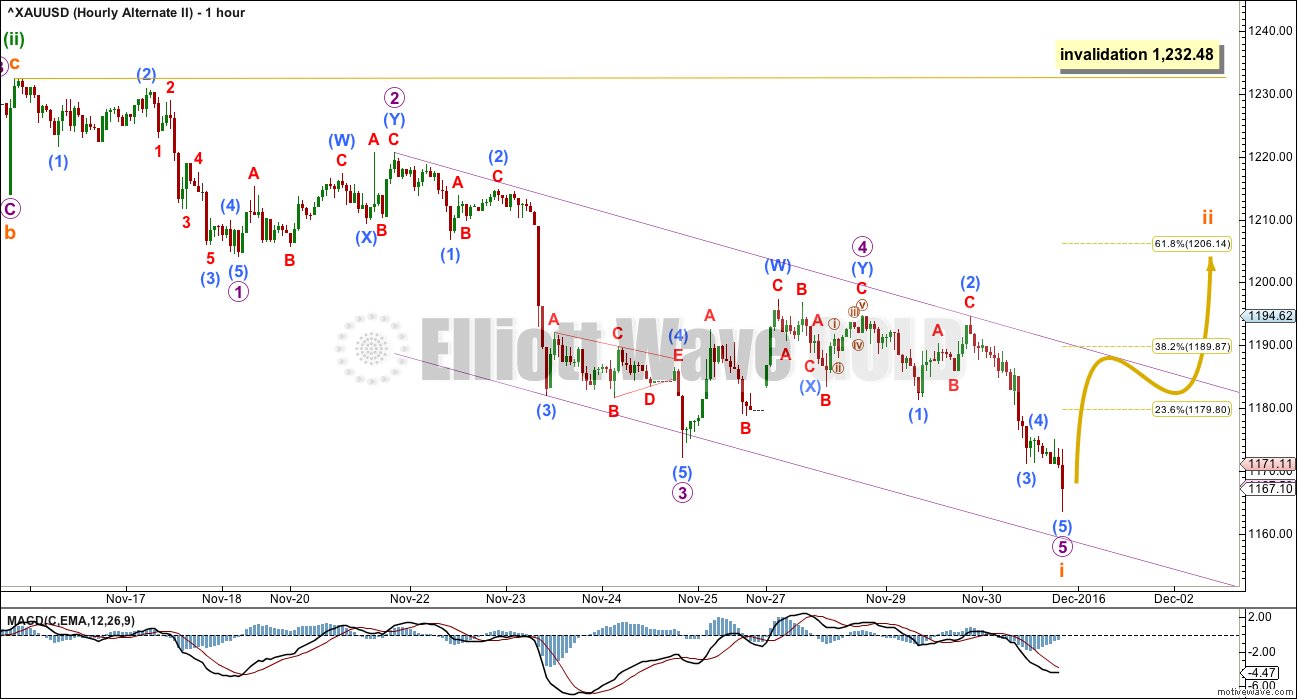
SECOND ALTERNATE HOURLY ELLIOTT WAVE COUNT
Click chart to enlarge.
If an impulse is developing downwards, then the third wave within it would still be incomplete.
Subminuette wave i may now be complete. Subminuette wave ii may unfold over two to a few days to resolve oversold conditions. It would most likely end about the 0.618 Fibonacci ratio of subminuette wave i about 1,206.
Subminuette wave ii may be any corrective structure except a triangle. It is most likely to be a zigzag. It may not move beyond the start of submineutte wave i above 1,232.48.
TECHNICAL ANALYSIS
WEEKLY CHART
Click chart to enlarge. Chart courtesy of StockCharts.com.
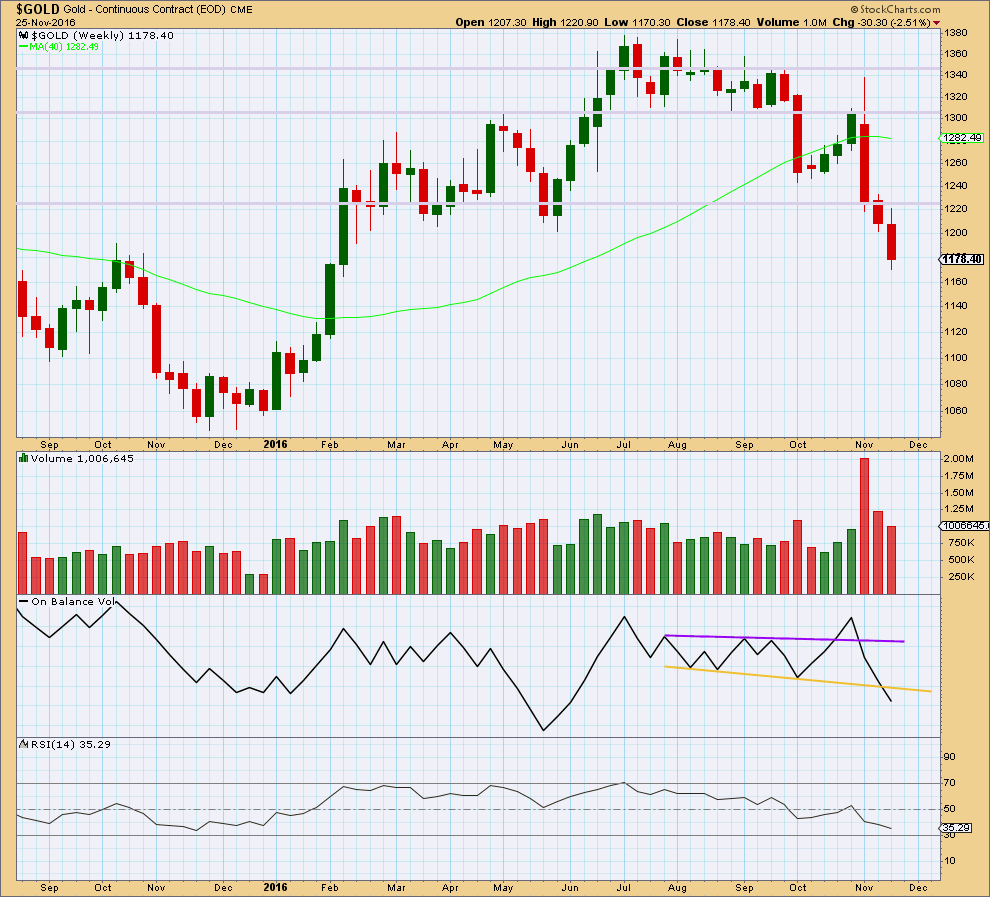
Another downwards week comes with a further decline in volume. The fall in price is not supported by volume, so it should be suspicious.
On Balance Volume last week breaks below the yellow support line. This is a strong bearish signal that supports the second alternate Elliott wave count.
There is no divergence between price and RSI at the weekly chart level to indicate weakness. RSI is not yet extreme. There is room still for price to fall further.
DAILY CHART
Click chart to enlarge. Chart courtesy of StockCharts.com.
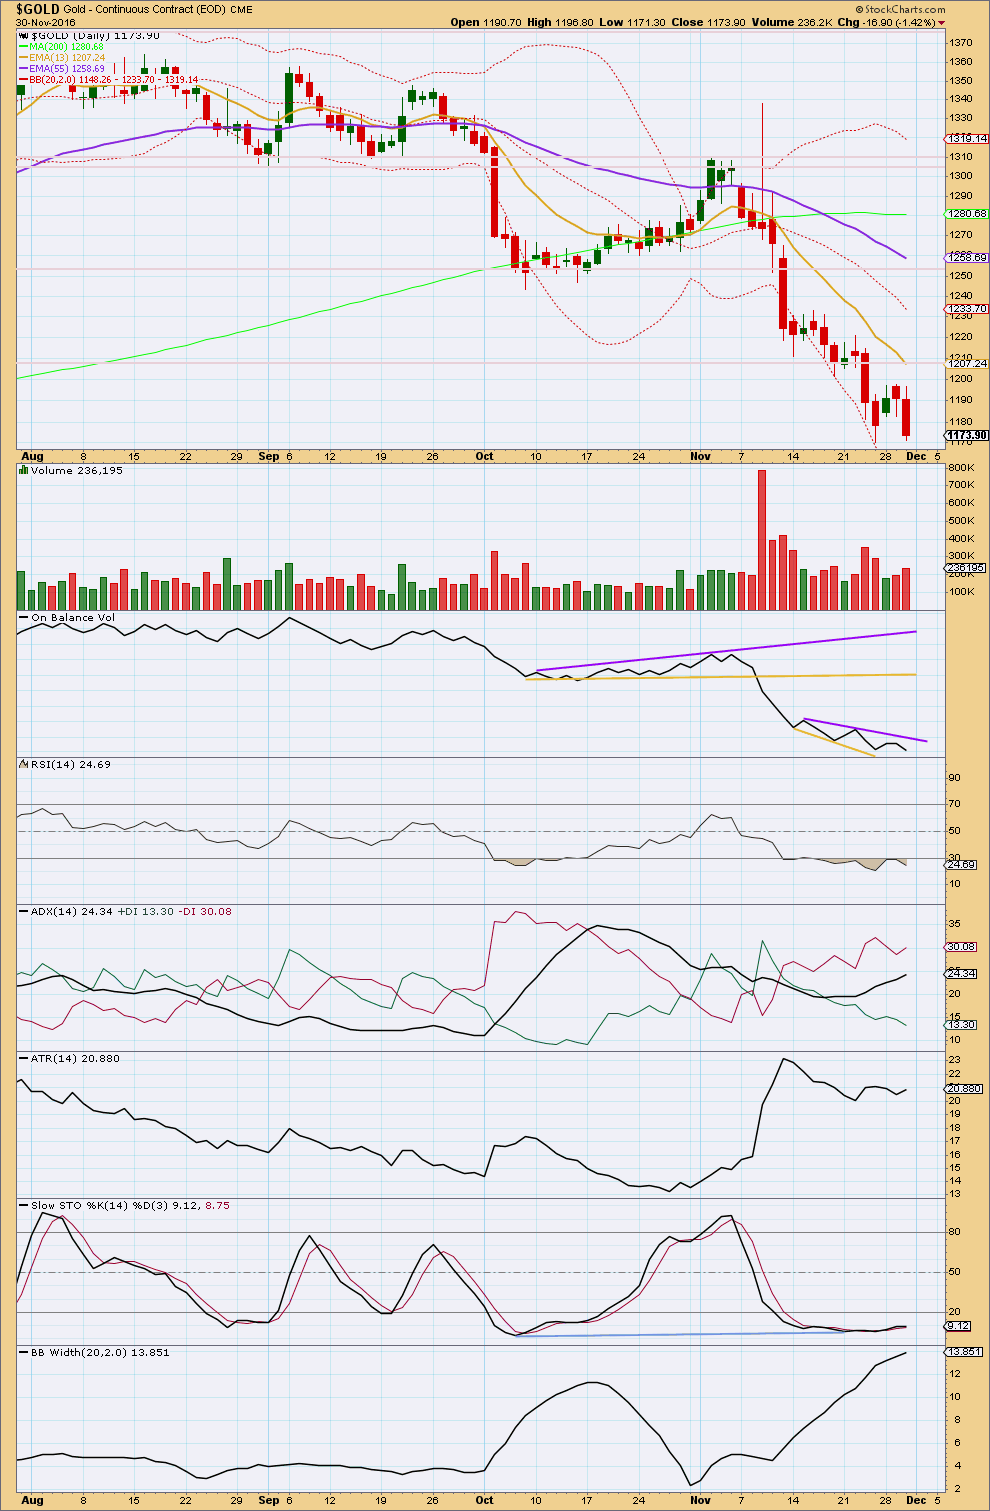
StockCharts data is NY session only, so it does not include the new low.
It cannot be seen until tomorrow if this new low exhibits divergence between price and RSI. If it does, then a low may be in place at least short term.
A slight increase in volume supports the fall in price. Volume is still light relative to prior downwards days though, so bears are weakening. To some extent this market is falling of its own weight.
On Balance Volume has not yet broken out of the new range. There is as yet no divergence between price and OBV at lows.
RSI is oversold and has been now for some time. A correction or trend change should be expected here or very soon.
Stochastics is oversold and exhibits divergence with price. If this develops into double divergence tomorrow, when the new low is taken into account, then a trend change from down to up or sideways should be expected here.
ATR is flattening off. The trend is weakening. ADX still indicates a downwards trend in place and it is not yet extreme. Bollinger Bands are still widening.
Overall, this downwards trend looks tired. Some consolidation is very likely here, but this classic analysis is still very bearish.
GDX DAILY CHART
Click chart to enlarge. Chart courtesy of StockCharts.com.
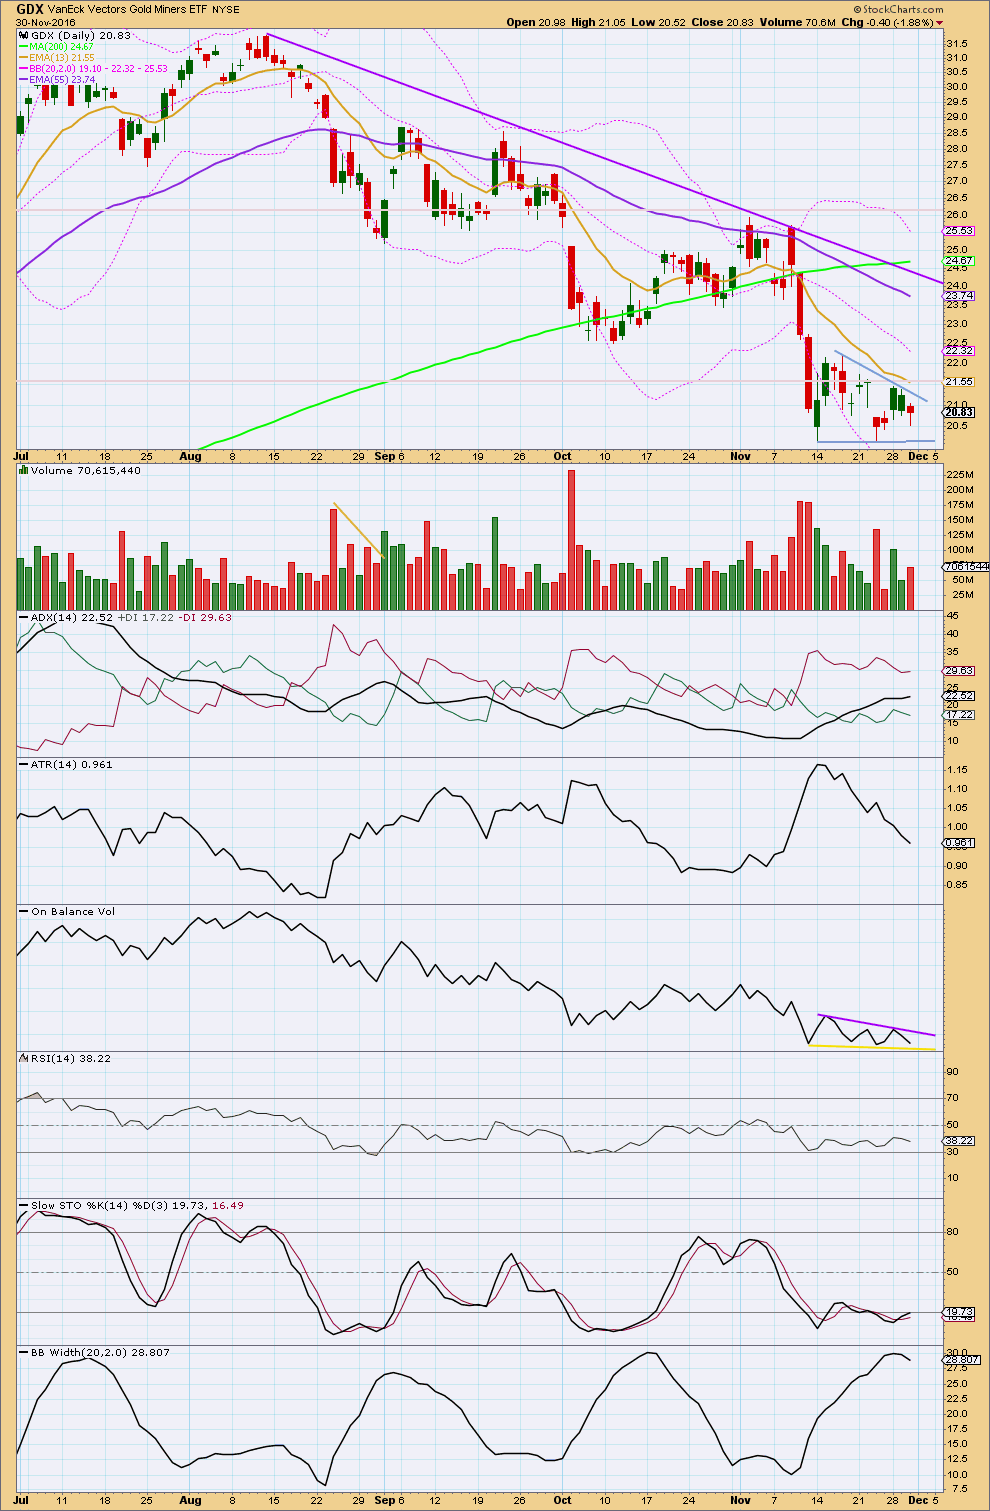
GDX is in a downwards trend. ADX is increasing and is not extreme, so there is room for this trend to continue.
Short term GDX is consolidating. Until proven otherwise, it would be wisest to assume that this is a consolidation within a mid term downwards trend. The short term Fibonacci 13 day moving average is pointing downwards and is below the mid term Fibonacci 55 day moving average, which is also pointing lower.
The larger trend may still be upwards though: the 200 day moving average is still pointing upwards.
Price is below all three averages and may now find resistance at the shorter 13 day average.
While price has been moving sideways since the last low for 11 days now, volume is overall declining. A small triangle may be forming, which is a continuation pattern. The upper blue trend line of the triangle slopes downwards indicating a downwards breakout is more likely.
ATR is declining as price moves sideways. Bollinger Bands have just begun to slightly contract.
Stochastics is still oversold, so some further consolidation may be required to resolve this. RSI is not oversold though, so the consolidation may not continue for too much longer.
There is some mid term divergence between price and RSI and Stochastics between the lows of the 6th of October and the 14th of November. This indicates some weakness to the last wave down, but it does not signal a trend change.
Overall, the picture for GDX looks much more bearish than bullish. Watch On Balance Volume closely, a breakout of support or resistance there may indicate the next direction for price.
This analysis is published @ 09:35 p.m. EST.
Excellent analysis
Gann degrees <3
Yeah baby! My nuggets (JNUG, NUGT) already are looking quite golden as I jumped on the recent bottom with both feet…. 🙂
Oops! Just when one thinks this is going down, the way Gold/Silver ratio just dropped and with 1160 holding tough as nails, this may just be the boost that Gold price needs to test a break above 1175/1187 and go looking for my stop lol… Gosh, hard to keep up. Win some lose some….Have a fine day all. GL & good trading!
This is how I see it atm regarding the bull vs bear-fight
Here’s my first conclusion this morning: it’s not over for Gold, it looks like it’s going to make more lows yet.
I need to figure out the most likely direction and a trading strategy for NFP tomorrow. Gold is likely to whipsaw violently.
More conservative traders may like to exit the market before this happens and then calmly reenter when it settles. Those with nerves of steel may like to have a go at making a profit on the news release.
Short term I think Gold has more downside, because the last wave down is subdividing as a three so it looks like minuette (v) is going to be an ending diagonal.
I don’t like labelling minuette (iv) as a quick zigzag here, but I will because the alternate is an expanded flat with wave B 2.72 X wave A. As Alan rightly points out that’s longer than the convention of 2. It could be though, no rules are broken, and I have seen expanded flats (rarely) with very long B waves.
At this point in time it makes no difference though because minuette (v) begins at the same place whatever structure minuette (iv) was.
For those members newer to EW:
Ending diagonals are terminal structures. The classic pattern equivalent here is a falling wedge.
EW ending diagonals must have subwaves 1 through to 5 which all subdivide as zigzags.
I have labelled subminuette i as complete. It looks like a zigzag. Hence the suggestion that an ending diagonal may be unfolding.
This cannot be minuette (v) complete at the last low because fifth waves may not subdivide as zigzags, they may only subdivide as five wave structures (diagonals or impulses).
Is another possibility minuette 4 not over yet and maybe expanded flat, and last zigzag wave down could be a “b” wave?
I’m looking at that possibility….
…. and it looks good.
Maybe a whipsaw tomorrow, or turn by dec 15 after fed meeting
IMO lucky if this can break above 1176 to get past pivot 1180-81/lower weekly band. Keeping it short notwithstanding upside risk a declining by about $8 a day resistance currently at 1210… Lets see how this pans out and closes today; got my target 1166, looking for deeper 1156-1148 range….
Nicely done Syed 🙂
Alan, for the main count, do you think Minuette 4 could be an expanded flat and gold is now in Minuette 5?
Hi Dreamer. If minuette 4 was an expanded flat, it would become 1171.11 – 1175.51 – 1163.53 – 1176.24. The Fib ratio for the B wave is in excess of 2.618, and I remember Lara saying that 2.0 is the limit.
I’m thinking that minuette 3 terminated at 1163.53, and minuette 4 ar 1176.24. Minuette 5 must drop in 5 waves. I have confidence in the first two subwaves at 1166.79 and 1171.38. The third subwave could be 1161.93; this I am not too sure. If correct, then the rise now is the fourth subwave. There will be one more drop.
My drop target is now 1157 – 1153.50. This represents 1.382 (Int Y of Int W), 0.618 (Minor C of Minor A).
I think fourth has already gone into wave 1 territory on recent move down which is ok if diagonal however impulse would suggest this is a corrective second wave of larger third wave down?
Hi Daniel, that’s what I thought too. Only thing is that this means the drop is going to be quite severe. So, I’m risking an ending diagonal.
Maybe turn coincides with jobs report tomorrow?
Daniel. I think you are right there.
I assumed that ADP gives a pretty good picture of NFP which means gold may plunge (see my earlier post). But, the strong unemployment claims figure today cast doubts on that.
So, if NFP figures fall short of the expected value, gold will rise. This is the best case scenario.
Hi Alan
When I look at 5 minute chart of this third wave down from 1176 its easier to see as an impulse rather than as a zig-zag which would be necessary for ending expanding diagonal. Also given relative rarity of ending expanding diagonal have to be concerned about more significant downside.
2.0 is the allowable convention for a limit, but it’s not a rule. Actually, it’s not even a guideline in Frost and Prechter’s “Elliott Wave Principle”.
I got the limit of 2.0 by asking the question to Elliott Wave International of how long a B wave within a flat can be. They replied that their software gave a warning to relabel the correction when the B wave reached 2.0 the length of the A wave.
Hence the “convention”.
I have seen a very few expanded flats with B waves that are longer than 2.0, which in hindsight certainly appeared to be expanded flats. So it can happen.
Lara/Alan: In monthly chart could primary wave X still continue below primary wave c??
Hi Papudi. I am afraid I can’t figure out what you mean by Primary C. From what I see, Primary X cannot drop below 1046.38, the beginning point of Cycle B and Primary W.
My detailed analysis of today’s surprising drop is posted in reply to Dreamer’s question.
Yes. There is no rule stating a minimum nor maximum for X waves.
This is part of a movement within Super Cycle wave (b). I think of B waves like this: they can do pretty much whatever they like. And when you think you have them figured out… you’re wrong.
This analysis is going to be a nightmare for a while 🙁
TA is very bearish for PM sector.
Top HnS formed over the last three months and break down from the neckline has happen.
Here is an example:
https://goldtadise.com/?p=388589
Hey Richard, you still out there? We’ve missed your daily posts now for several weeks. Hope all is well.
Yup. Richard, we miss you.
I was going to post also to call out Richard..
I have not seen his posts for some time??
Yes I hope every thing is OK>>> or gold volatility made him loose interest???
I checked in with him, he’s okay. Just not here for a while I think.
I miss him too.
Just some thoughts on my trading strategy for the balance of the week:
(1) Much as I like to cheer the bull on, I don’t see much persuasion for it to do so. I use moving averages to discern the larger picture. EMA13 < EMA34 < EMA89 which does not augur well for the bull. Moreover, all are pointing steeply downwards. Sigh. MACD is still negative, no crossover. Only RSI is way oversold which calls for some upmove. So, pessimistic here.
(2) Dreamer has a nice post of a descending triangle for GDX. Thank you, Dreamer. The odds are given as 36% for the upmove and 64% for the downmove. As a former competitive bridge player, 2-to-1 odds wins hands down anytime. Unless of course if I'm contrarian.
(3) The charts point to an upmove from yesterday's low of 1163.53 (in agreement with RSI). I would like to see price breaking first 1172.10 (hitherto the "last defence"), then the staunch 1195-1200 resistance. Once price breaks 1200, I will be more happily bullish. Until then, I'm neutral.
(4) At the fundamental level, investor sentiment is focused on Friday's NFP report. ADP data had suggested a strong jobs figure, and if NFP follows suit, I am afraid gold may plunge. The Alternate 2 scenario will then gain prominence. For today, I expect mainly consolidation. The move up had been very lethargic for the good part of today (Singapore time).
In view of the above, I am scalping some for the upmove today. It’s just like taking crumbs off the dinner table.
Hope this helps.
Alan, excellent post as always. Good to hear your “voice of reason”. NFP is of course a worry, but hopefully the oversold condition of gold will allow it to bounce here even if the numbers are not super favorable. That said, even the most bearish EW count now expects a solid bounce of approximately 35 points, so at minimum, a good scalp should be in order. Good trading to all.
Lara, this is such a good post….can you add it to “gold historical “?
Oh yeah, should have done that. I forgot. Will do. Thanks.
The contrarian in me says that GDX is going to breakout upwards from its descending triangle even though the odds are at 36% according to thepatternsite. Sticking with this count unless GDX breaks below 20.13
Your wave count looks good Dreamer. My only question (and it’s just that, not anything that’s invalid) is why have you labelled minor 4 of intermediate (C) of primary W as a combination? Will that piece fit as a running triangle?
Lara, here’s a zoomed in look with the triangle labels added. I really didn’t see any other way to make it fit. Can a triangle fit for the whole of Minor 4?
Lara, thank you for the detailed analysis with video and for adding in GDX as a bonus!
Just a quick note on the GDX descending triangle. According to thepatternsite.com, a downward breakout occurs 64% of the time. So there is hope for the bulls with a 36% chance for an upward breakout. We should know soon. http://thepatternsite.com/dt.html
Thanks Lara. This is a tough one to pin down. It is at a very important juncture, or close to it and all the alternates help to envision what may unfold.
Thank you Dermot. Yes, it is a complicated and confusing juncture in EW terms.
B waves really are the worst, and we’re probably in the middle of one.