
A slight new high was expected before a sideways consolidation began.
No slight new high was seen. Price has moved lower.
So far price remains above the invalidation point and tightly contained within a channel.
Summary: A fourth wave correction is likely over now. The target for a fifth wave up is at 1,338. The main wave count will have a higher probability as long as price remains above 1,264.72. Expect the trend is up. Use the low today as an opportunity to join an upwards trend at a good price. Stops may be set just below the invalidation point at 1,264.72, and manage risk by investing no more than 3-5% of equity on any one trade.
New updates to this analysis are in bold.
Grand SuperCycle analysis is here.
The last published monthly chart may be seen here.
DAILY ELLIOTT WAVE COUNT
Click chart to enlarge.
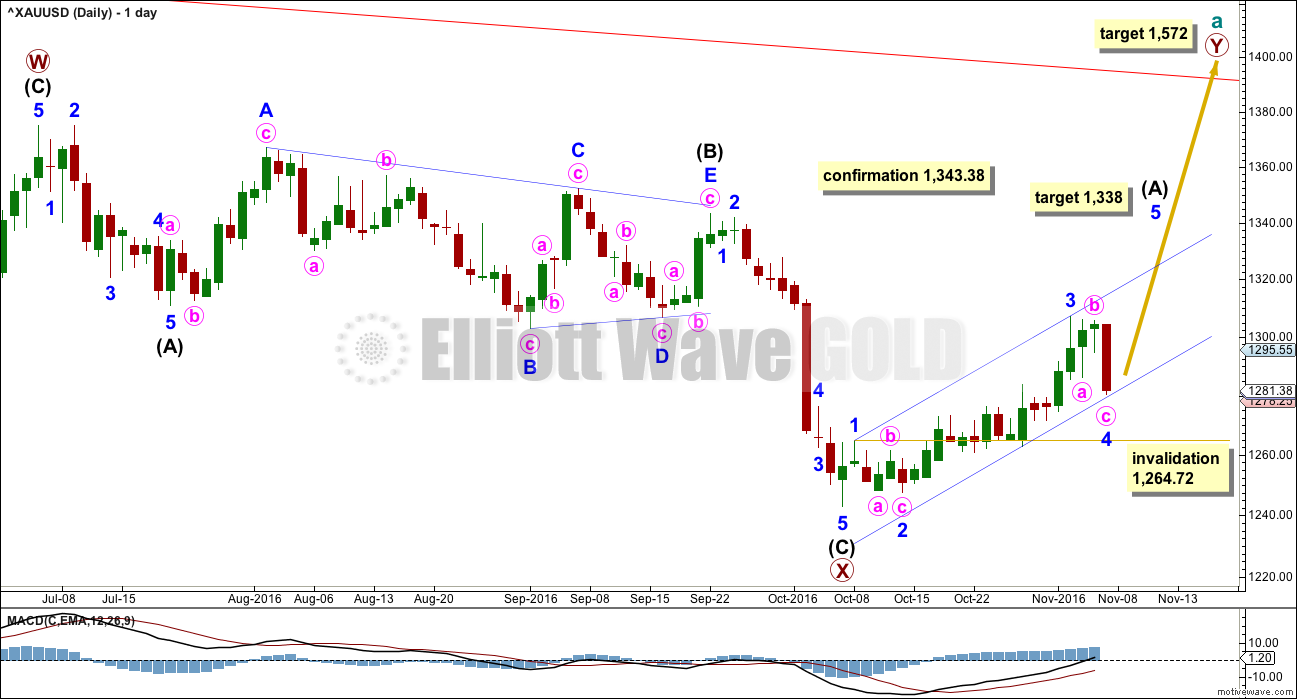
The zigzag downwards for primary wave X may be complete, at all time frames. A target for primary wave Y upwards would be about 1,569 where primary wave Y would be about even in length with primary wave W.
So far, within the five up for intermediate wave (A), minor waves 1 through to 4 may now be complete. Minor wave 5 may have begun at today’s low. At 1,338 minor wave 5 would reach equality in length with minor wave 3. Minor wave 5 may exhibit a blowoff top, so look out for that possibility.
HOURLY ELLIOTT WAVE COUNT
Click chart to enlarge.
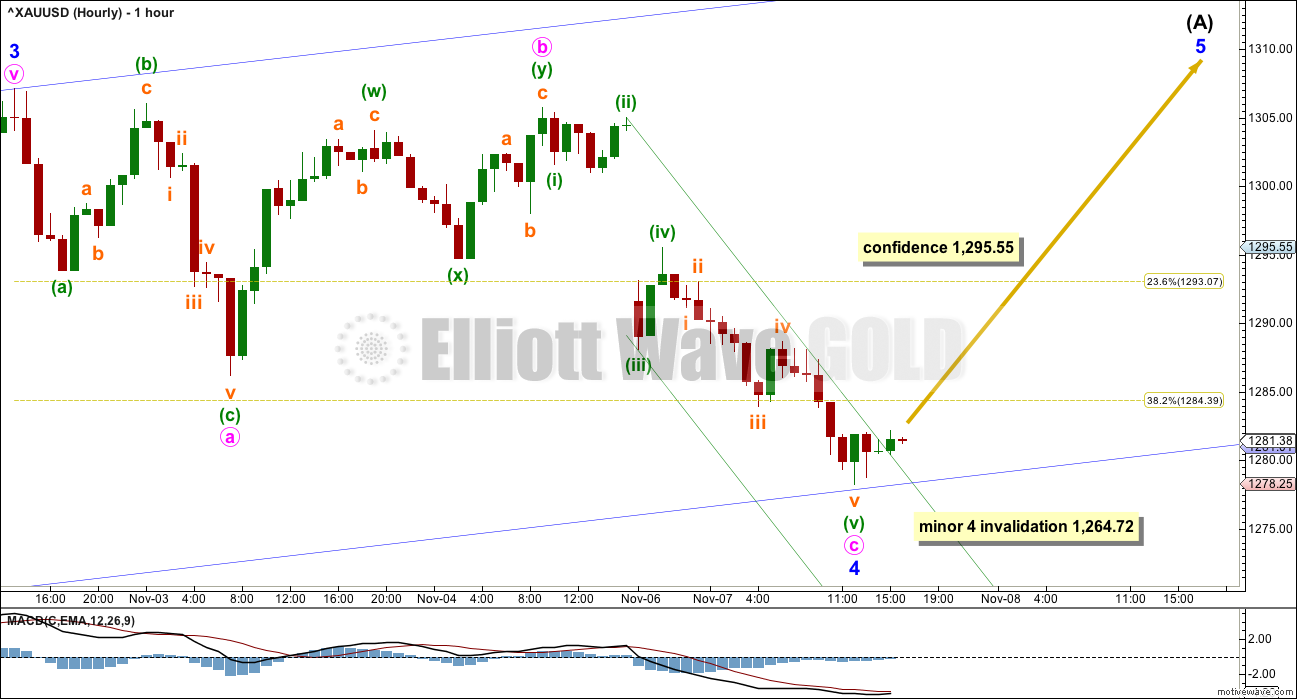
The structure within minor wave 3 is reanalysed today. Rather than seeing minor wave 3 end with a small truncation, it is more likely that minor wave 3 ended with quick shallow fourth waves.
The corrections of minute wave ii and minuette wave (ii) are deep and time consuming early on within minor wave 3. Momentum and volume then build through the middle of minor wave 3 and as a result the corrections to end the impulse are brief and very shallow fourth waves. This is typical of Gold, giving its impulses a curved look. There is disproportion between the second and fourth wave corrections, but this is forced due to strong fifth waves.
Minor wave 2 was a deep 0.78 zigzag. Minor wave 4 here is a more shallow 0.49 regular flat correction. There is alternation in structure and depth.
Minor wave 3 is 2.22 longer than 2.618 the length of minor wave 1. At 1,338 minor wave 5 would reach equality in length with minor wave 3, so both minor waves 3 and 5 would be extended.
If minor wave 5 breaks above the upper edge of the blue channel, then it may be extending further. If the target is wrong, it may not be high enough. Look out for surprises to the upside for this wave count; Gold often exhibits very strong fifth waves.
If it continues any lower, minor wave 4 may not move into minor wave 1 price territory below 1,264.72.
ALTERNATE DAILY ELLIOTT WAVE COUNT
Click chart to enlarge.
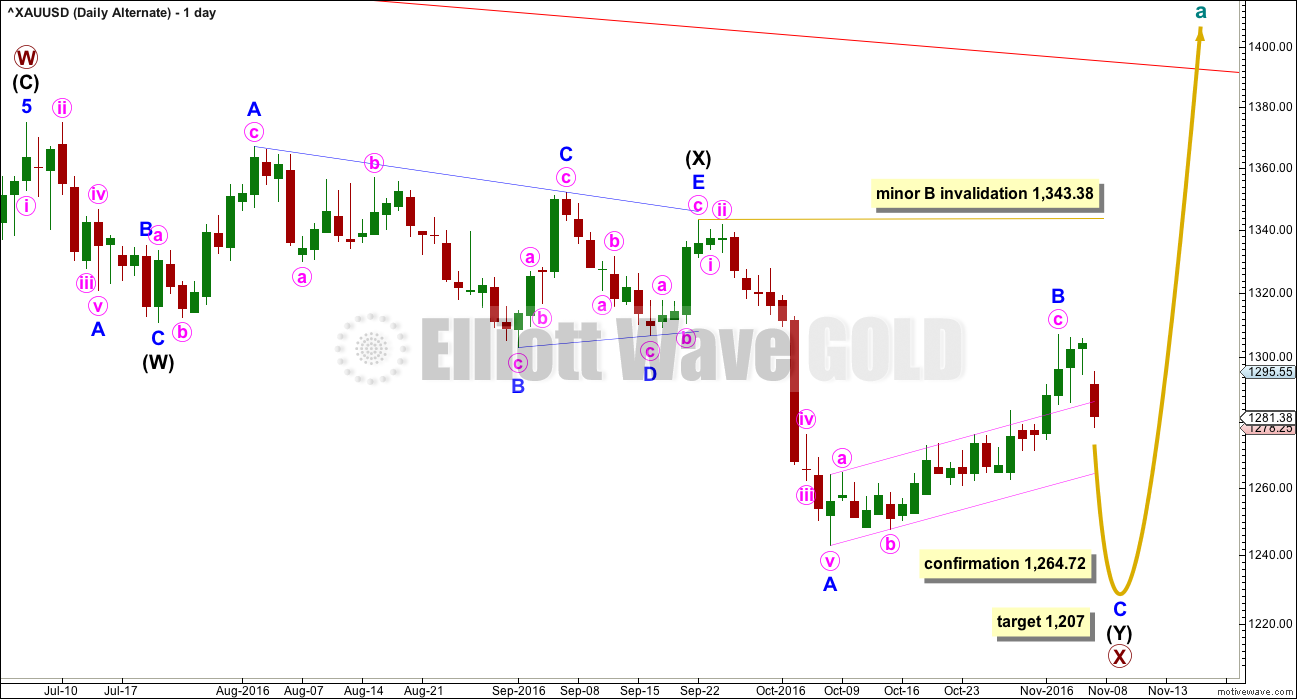
This wave count sees a correction downwards as incomplete.
Within multiple corrections labelled W-X-Y (X-Z), the rule states the maximum number of corrective structures is three. This maximum applies only to the corrective structures of W, Y and Z. Otherwise the maximum would need to be five, not three.
Within multiples, each corrective structure of W, Y and Z may only themselves be labelled as simple corrective structures: A-B-C, or A-B-C-D-E in the case of triangles. They may not themselves be labelled W-X-Y (X-Z). That would increase the maximum beyond three and violate the rule.
This rule does not apply to the joining structures labelled X. They may be any corrective structure including multiples.
The most common mistake for those new to Elliott wave or sometimes those who do not appear to have understood the rule, is to label long movements as W-X-Y-X-Z, with each of W, Y and Z also labelled as multiples. Such labelling of multiples within multiples violates the Elliott wave rule. Such analysis is of no predictive use and should not be seriously considered.
Here, the second zigzag in the double is relatively close to completion.
Minor wave B may now be complete. Gold may see a sharp reversal and a new wave down. At 1,207 minor wave C would reach equality in length with minor wave A. Minor wave C would be very likely to make at least a slight new low below the end of minor wave A at 1,242.87 to avoid a truncation.
At this stage, a new low below 1,264.72 would invalidate the main wave count and provide some confidence in this alternate.
ALTERNATE HOURLY ELLIOTT WAVE COUNT
Click chart to enlarge.
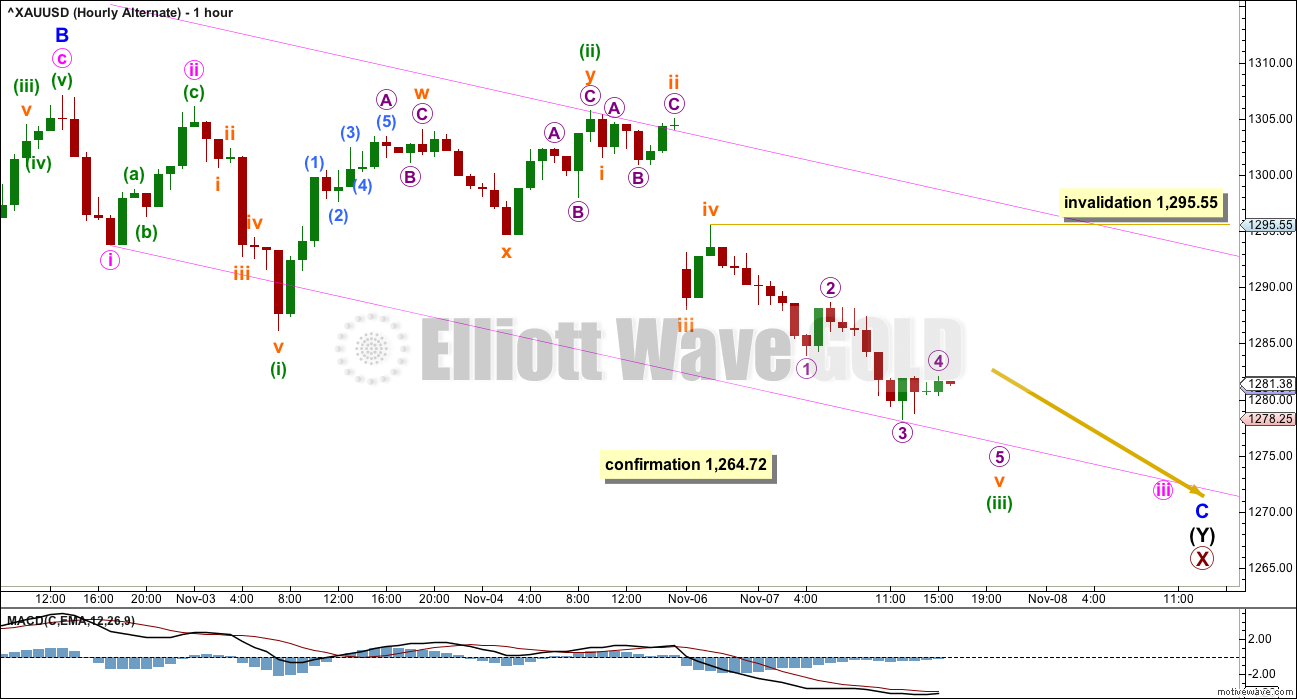
Upwards movement for minor wave B is seen in exactly the same way as upwards movement for the main wave count. A-B-C of a zigzag subdivides 5-3-5, exactly the same as 1-2-3 of an impulse.
Thereafter, the wave counts diverge.
If price makes a new low below 1,264.72, it cannot be a fourth wave correction within a continuing impulse. So at that stage the upwards movement must be over and would most likely be a three wave structure. With a three wave structure upwards, that would indicate the trend remains down.
Minor wave C may have begun with a series of overlapping first and second waves. Minor wave C must subdivide as a five wave structure, and so far it looks like it may be unfolding as an impulse.
Within subminuette wave v of minuette wave (ii), no second wave correction may move beyond the start of its first wave above 1,295.55. This invalidation point allows for the possibility that labelling within subminuette wave v is wrong.
TECHNICAL ANALYSIS
WEEKLY CHART
Click chart to enlarge. Chart courtesy of StockCharts.com.
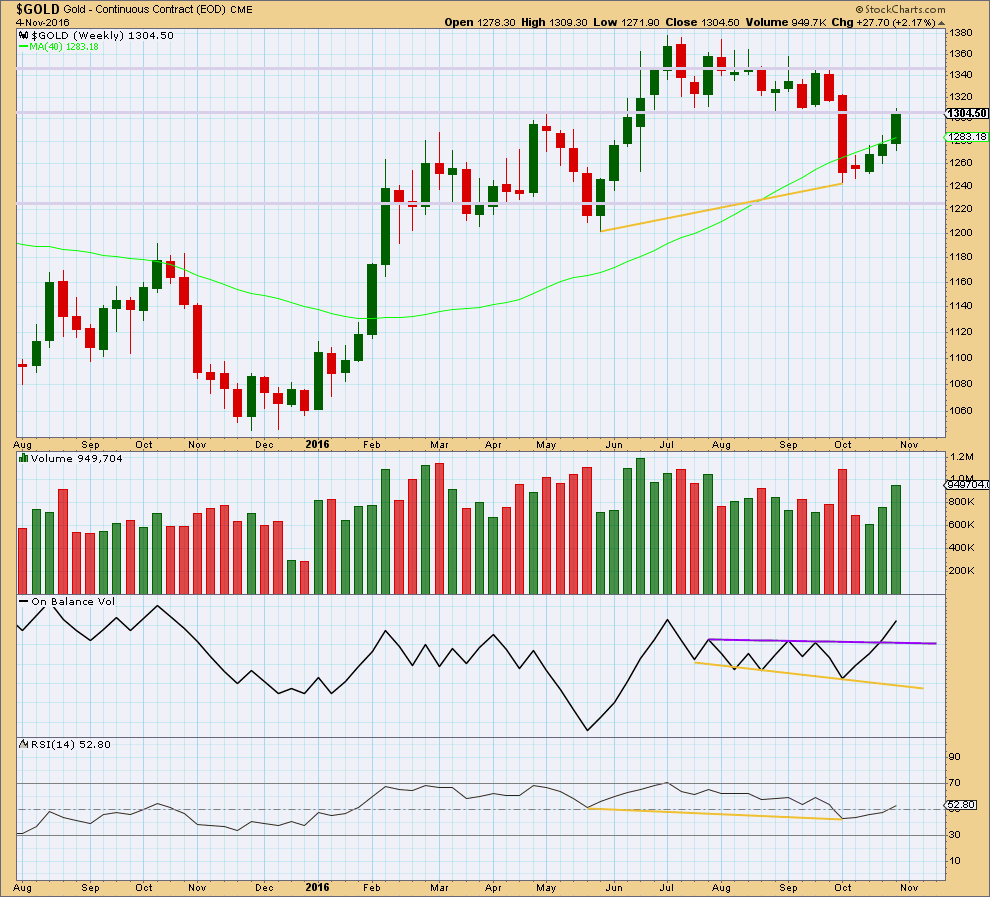
Following bullish divergence between price and RSI (yellow lines), price has been moving upwards for three weeks on increasing volume.
RSI at the weekly chart level is above 50, which is bullish. It has a long way to go before it would reach extreme, so there is plenty of room still for price to rise.
Price is finding some resistance at an area of prior support at 1,305 – 1,310. If price can break above 1,310 this week, that would be a strong bullish signal. The next line of resistance would then be about 1,350.
DAILY CHART
Click chart to enlarge. Chart courtesy of StockCharts.com.
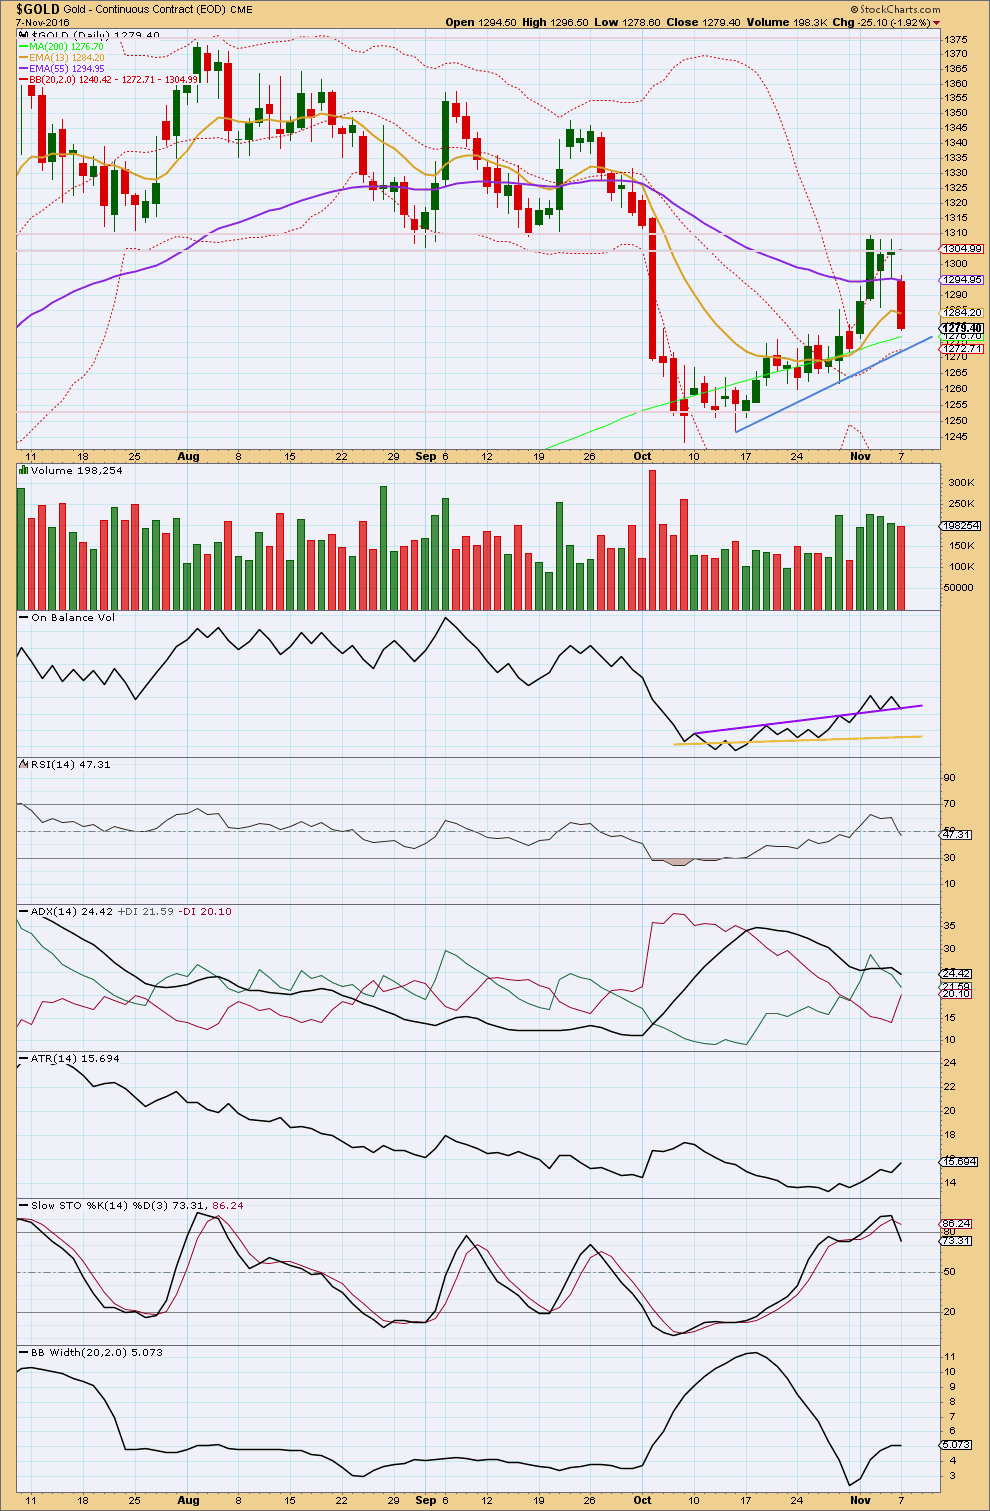
Downwards movement for Monday’s session, importantly, has lighter volume than prior upwards sessions. The fall in price is not supported well by volume, so it should be suspicious. With volume stronger for recent upwards movement, it looks like the trend is still up and this downwards day is a counter trend movement.
On Balance Volume has today come down again to sit on the purple line, which is now offering support. This may force the fall in price to stop here.
RSI has returned close to neutral. There is again plenty of room for price to rise.
ADX is today declining, indicating the market is not trending. The +DX line remains above the -DX line, so no trend change is indicated.
ATR increased today disagreeing with ADX. But one day is not enough for a new trend to be indicated.
Bollinger Bands were flat today slightly agreeing with ADX and the Elliott wave count, which sees downwards movement as a counter trend movement.
It looks like strong resistance about 1,305 – 1,310 has forced a small counter trend consolidation at this point. If price can break above resistance here, it may then be able to sustain a stronger trend.
This analysis is published @ 05:40 p.m. EST.
Alternate update:
The upwards spike today labelled subminuette wave ii overlaps price territory of minuette wave (i) – that had it’s low at 1,286.17. That means that the wave I have labelled subminuette ii cannot be a fourth wave, which means for this alternate the third wave is not over.
The strongest downwards movement is ahead.
A new low below 1,264.72 is still required to confirm this alternate.
It would help if I actually loaded the right chart now wouldn’t it. Sorry folks.
I can work out a solution for the bear wave count. This downwards movement will fit as a double zigzag.
But now there is very little alternation between the single zigzag of minor 2 and the double zigzag of minor 4. They’re both deep too.
But the subdivisions fit neatly.
I’m struggling to figure out the structure on the hourly chart for both bull and bear scenarios….
Still working on it. I should have a chart or two for you before the close… but it may be close 🙂
Sticking with the bullish count although its not clear if the bottom is in or not
GDX had a big gap down with support from a rise in volume:
~ RSI may be at support
~ PRICE overshot, then closed back above the uptrend line and appears to be triangulating to a decision within the next few days. Watch for a breakout, up or down
~ OBV moved down and may be at support
Overall, I don’t see any clear signs that the bottom is in, although it may be.
Lara,
For the first leg up, Primary wave W, Intermediate wave A was approximately 217 in length and Intermediate wave C was approximately 175 in length.
If Minor 5 of Intermediate wave A of Primary wave Y hits your target @ 1,338, Intermediate wave A will only be approximately 147 in length. Any concern with the short length in comparison with the Intermediate waves of Primary wave W?
That will mean Intermediate wave C of Primary wave Y will be very long to hit the target of 1,572. Maybe that’s OK as Intermediate wave C would be a “blowoff” top and the lengths of Intermediate waves A & C of Primary wave W will be inverted with Intermediate waves A & C of Primary wave Y.
I may need to move the degree of labelling within this intermediate (A) down one degree.
But no, I’m not yet concerned about the different lengths of this move for intermediate (A) compared to intermediate (A) within the first zigzag of primary W. In fact, it may be that this second zigzag may exhibit some alternation to the first zigzag.
The first zigzag had a relatively long A wave and relatively short C wave. This second zigzag may alternate with a relatively short A wave and relatively long C wave.
The guideline of alternation should be applied flexibly.
Sounds good. Thanks
Playing for a pullback from within / under 1287/95 for a take out of 1278-75 before considering going long on this. Lets see how this works out for me. GL everyone!