
Downwards movement unfolded and remains above the invalidation point.
Summary: The picture is less clear today. But the invalidation point is very close by, so we may have clarity soon. Assume the trend most likely remains upwards while price remains above 1,264.72. Look out for a strong extended fifth wave upwards. If price makes a new low below 1,264.72, then look out for a strong third wave down.
New updates to this analysis are in bold.
Grand SuperCycle analysis is here.
The last published monthly chart may be seen here.
DAILY ELLIOTT WAVE COUNT
Click chart to enlarge.
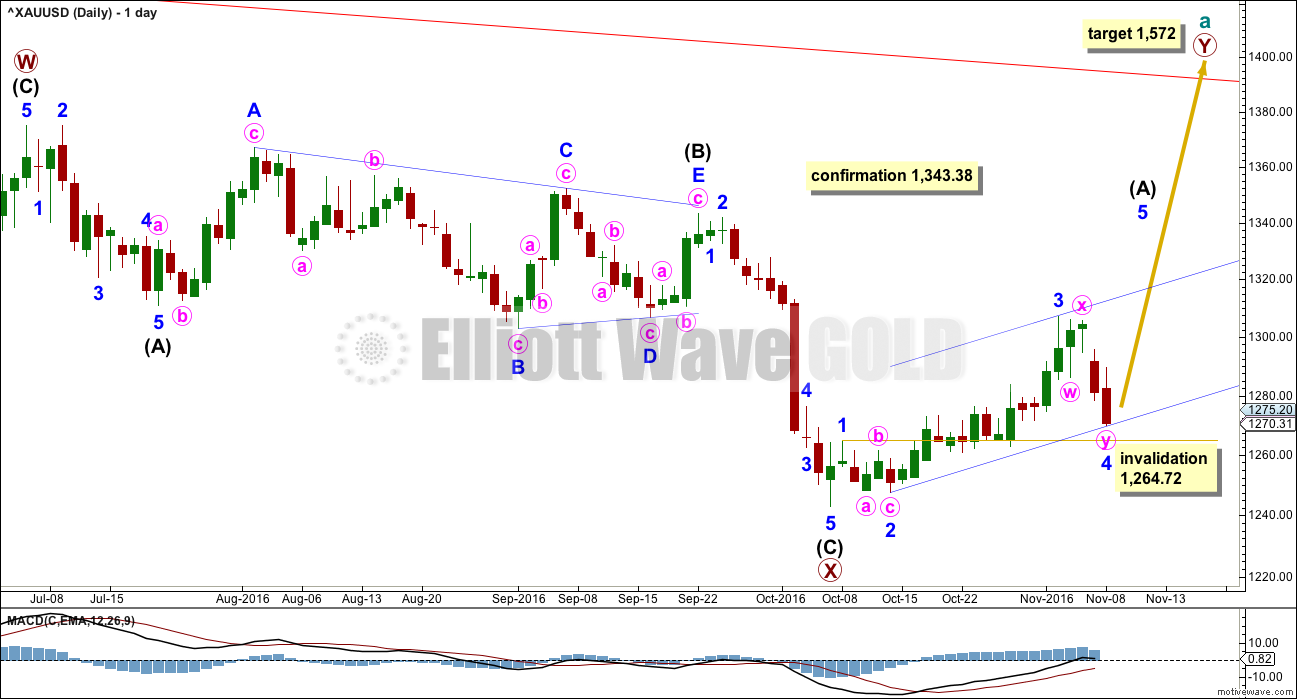
The zigzag downwards for primary wave X may be complete, at all time frames. A target for primary wave Y upwards would be about 1,569 where primary wave Y would be about even in length with primary wave W.
So far, within the five up for intermediate wave (A), minor wave 4 has moved lower today and may now be very close to an end. This wave count will remain valid while minor wave 4 remains above minor wave 1 price territory.
Minor wave 4 may not move into minor wave 1 price territory below 1,264.72.
Fourth waves are not always contained within channels. This is why Elliott developed a second technique to redraw the channel when the fourth wave breaches it. Draw the channel with the first trend line from the ends of minor waves 2 to 4, then place a parallel copy on the end of minor wave 3. The upper edge may show where minor wave 5 finds resistance.
HOURLY ELLIOTT WAVE COUNT
Click chart to enlarge.
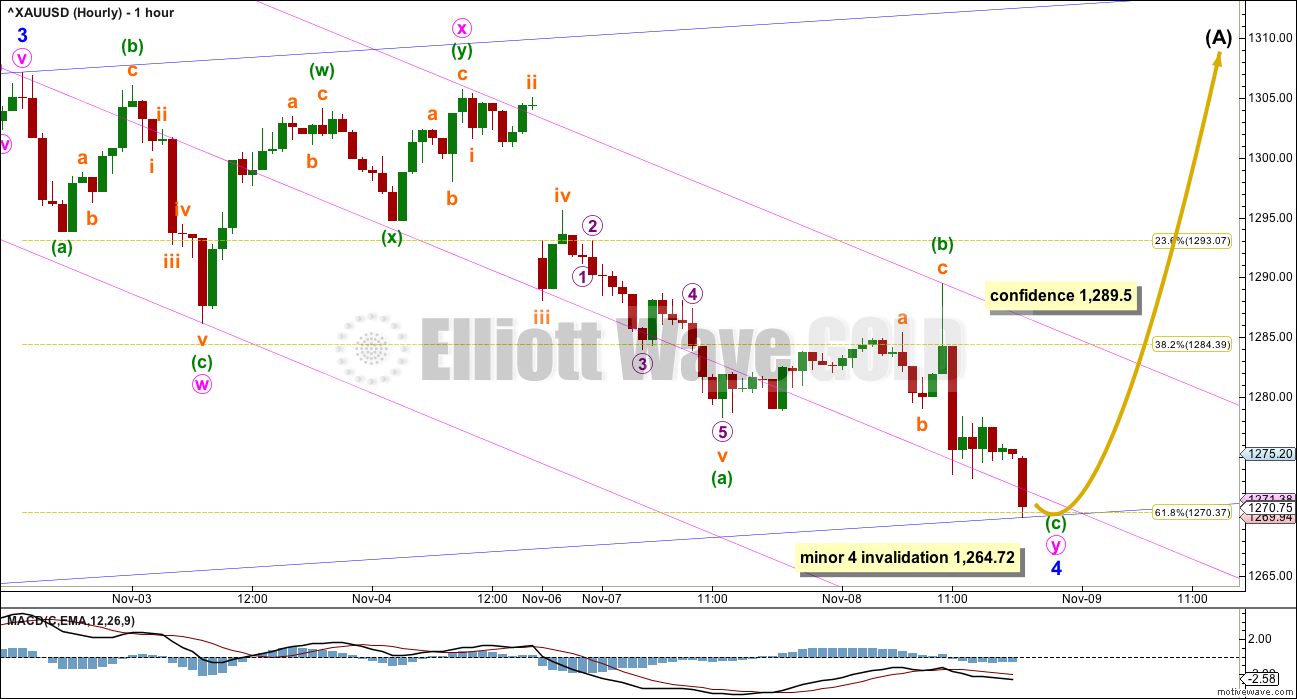
Minor wave 2 was a deep 0.78 single zigzag. Minor wave 4 now exhibits very little alternation as a deep 0.63 double zigzag. This has today reduced the probability of this wave count.
Minor wave 4 may end here very close to the 0.618 Fibonacci ratio of minor wave 3.
The pink channel is a best fit about minor wave 4. When it is breached by upwards movement, it may be the earliest indication of a possible trend change. A new high above 1,289.50 today would invalidate the alternate wave count below and provide some confidence in this main wave count.
If it continues any lower, minor wave 4 may not move into minor wave 1 price territory below 1,264.72.
ALTERNATE DAILY ELLIOTT WAVE COUNT
Click chart to enlarge.
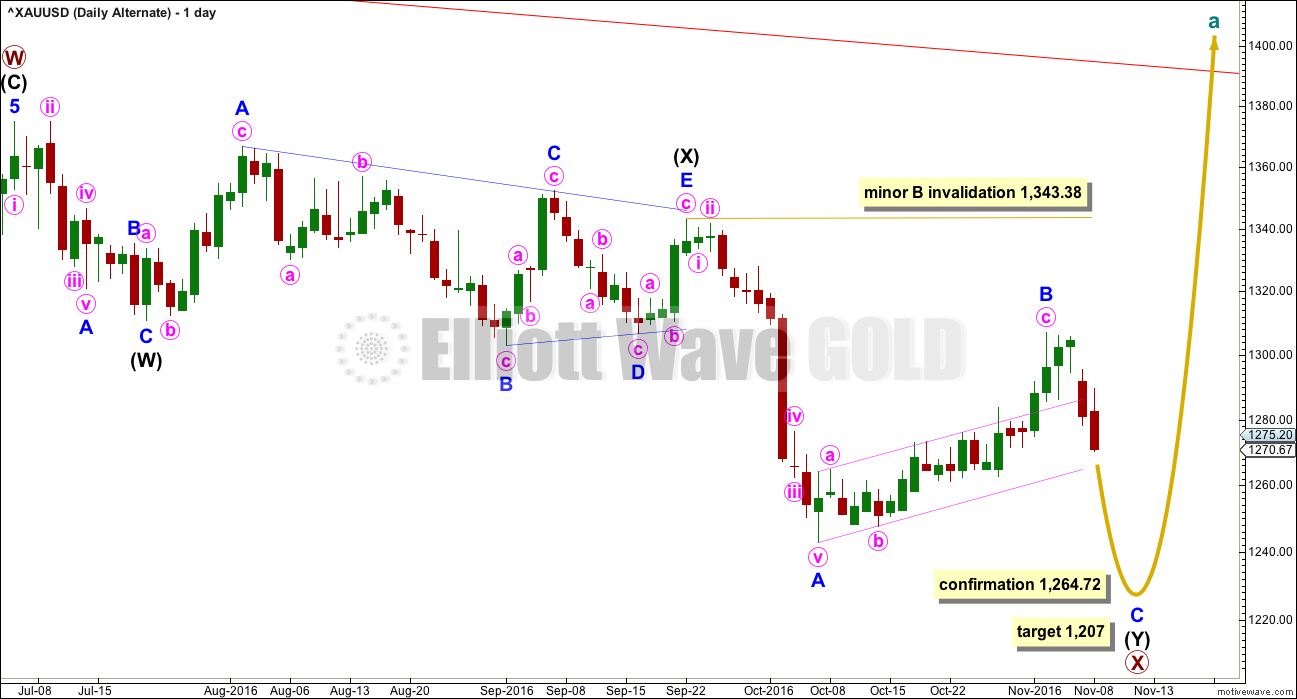
This wave count sees a correction downwards as incomplete.
Within multiple corrections labelled W-X-Y (X-Z), the rule states the maximum number of corrective structures is three. This maximum applies only to the corrective structures of W, Y and Z. Otherwise the maximum would need to be five, not three.
Within multiples, each corrective structure of W, Y and Z may only themselves be labelled as simple corrective structures: A-B-C, or A-B-C-D-E in the case of triangles. They may not themselves be labelled W-X-Y (X-Z). That would increase the maximum beyond three and violate the rule.
This rule does not apply to the joining structures labelled X. They may be any corrective structure including multiples.
The most common mistake for those new to Elliott wave or sometimes those who do not appear to have understood the rule, is to label long movements as W-X-Y-X-Z, with each of W, Y and Z also labelled as multiples. Such labelling of multiples within multiples violates the Elliott wave rule. Such analysis is of no predictive use and should not be seriously considered.
Here, the second zigzag in the double is relatively close to completion.
Minor wave B may now be complete. Gold may see a sharp reversal and a new wave down. At 1,207 minor wave C would reach equality in length with minor wave A. Minor wave C would be very likely to make at least a slight new low below the end of minor wave A at 1,242.87 to avoid a truncation.
At this stage, a new low below 1,264.72 would invalidate the main wave count and provide some confidence in this alternate.
ALTERNATE HOURLY ELLIOTT WAVE COUNT
Click chart to enlarge.
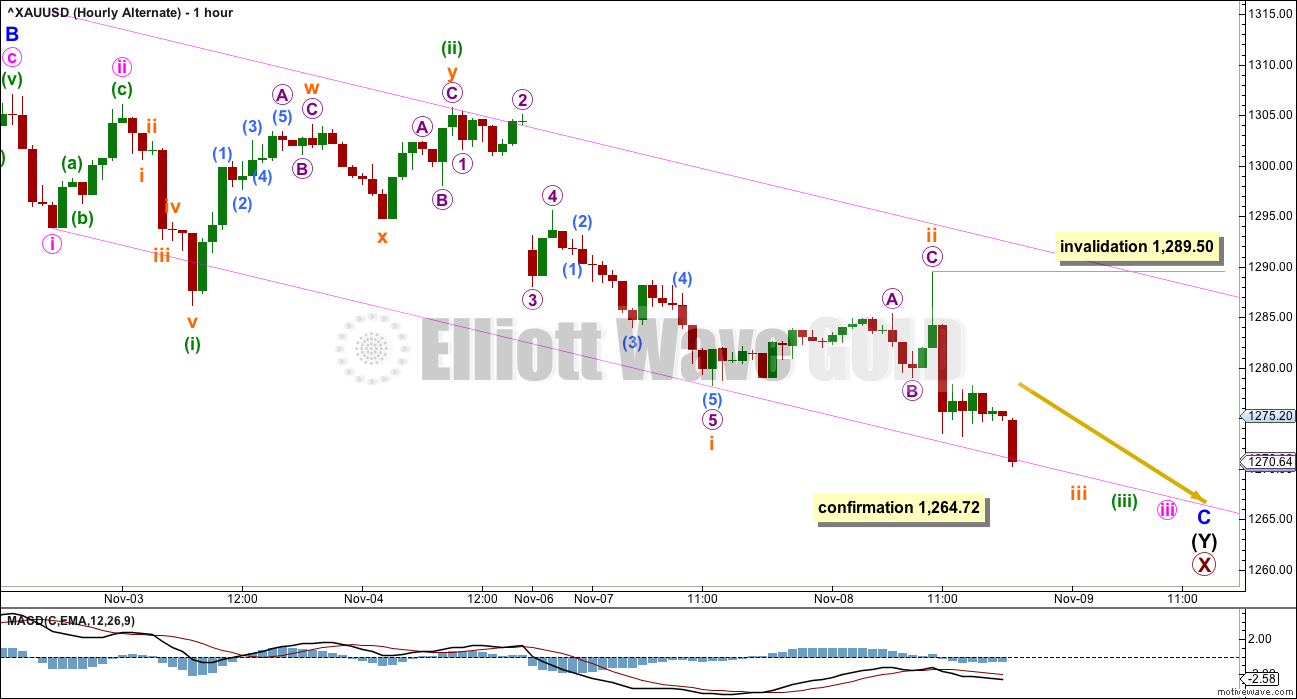
Upwards movement for minor wave B is seen in exactly the same way as upwards movement for the main wave count. A-B-C of a zigzag subdivides 5-3-5, exactly the same as 1-2-3 of an impulse.
Thereafter, the wave counts diverge.
If price makes a new low below 1,264.72, it cannot be a fourth wave correction within a continuing impulse. So at that stage the upwards movement must be over and would most likely be a three wave structure. With a three wave structure upwards, that would indicate the trend remains down.
Minor wave C may have begun with a series of overlapping first and second waves. Minor wave C must subdivide as a five wave structure, and so far it looks like it may be unfolding as an impulse.
The upwards spike labelled subminuette wave ii overlaps back into minuette wave (i) price territory, so this spike may not be minuette wave (iv). The degree of labelling within movement down from the high labelled minuette wave (ii) is moved down one degree. For this wave count today another overlapping first and second wave may be complete.
This wave count now has three overlapping first and second waves. It now expects to see a strong increase in downwards momentum as the middle of a third wave unfolds downwards.
The ends of any one of subminuette wave iii, minuette wave (iii), minute wave iii or even minor wave C may end with selling climaxes. Gold often exhibits particularly strong fifth waves. If this wave count is confirmed, then look out for surprises to the downside.
TECHNICAL ANALYSIS
WEEKLY CHART
Click chart to enlarge. Chart courtesy of StockCharts.com.
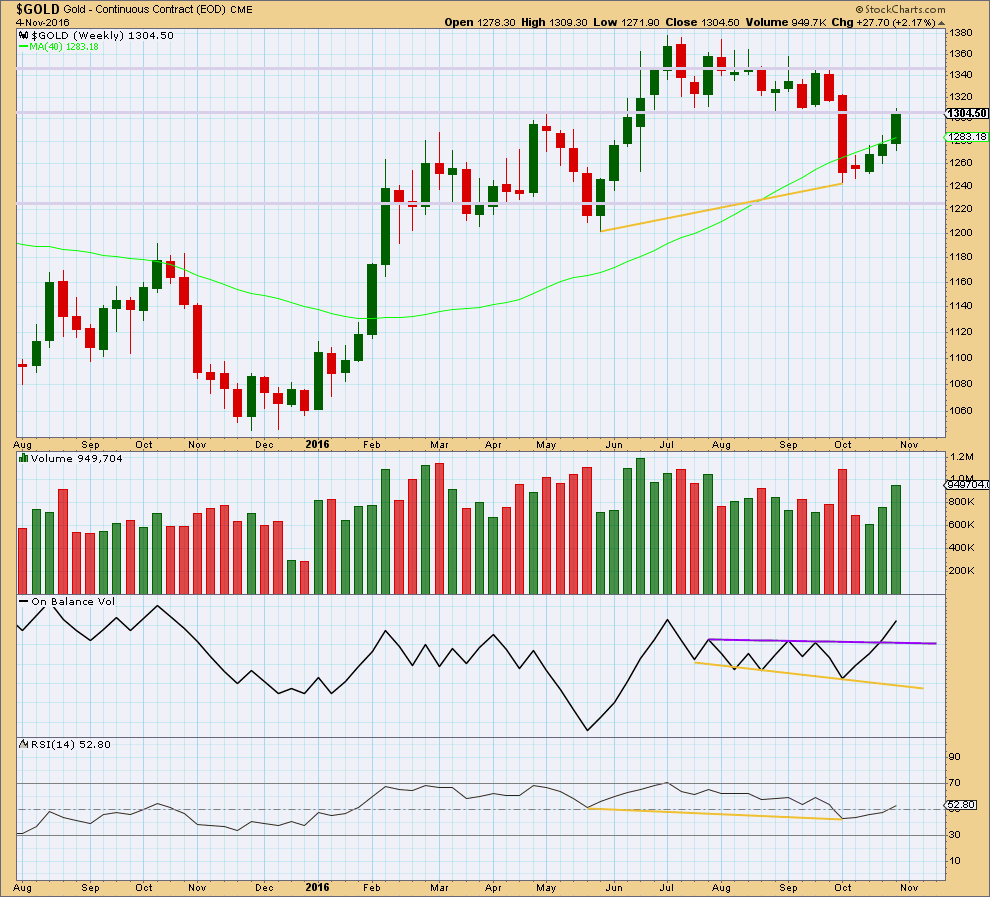
Following bullish divergence between price and RSI (yellow lines), price has been moving upwards for three weeks on increasing volume.
RSI at the weekly chart level is above 50, which is bullish. It has a long way to go before it would reach extreme, so there is plenty of room still for price to rise.
Price is finding some resistance at an area of prior support at 1,305 – 1,310. If price can break above 1,310, that would be a strong bullish signal. The next line of resistance would then be about 1,350.
DAILY CHART
Click chart to enlarge. Chart courtesy of StockCharts.com.
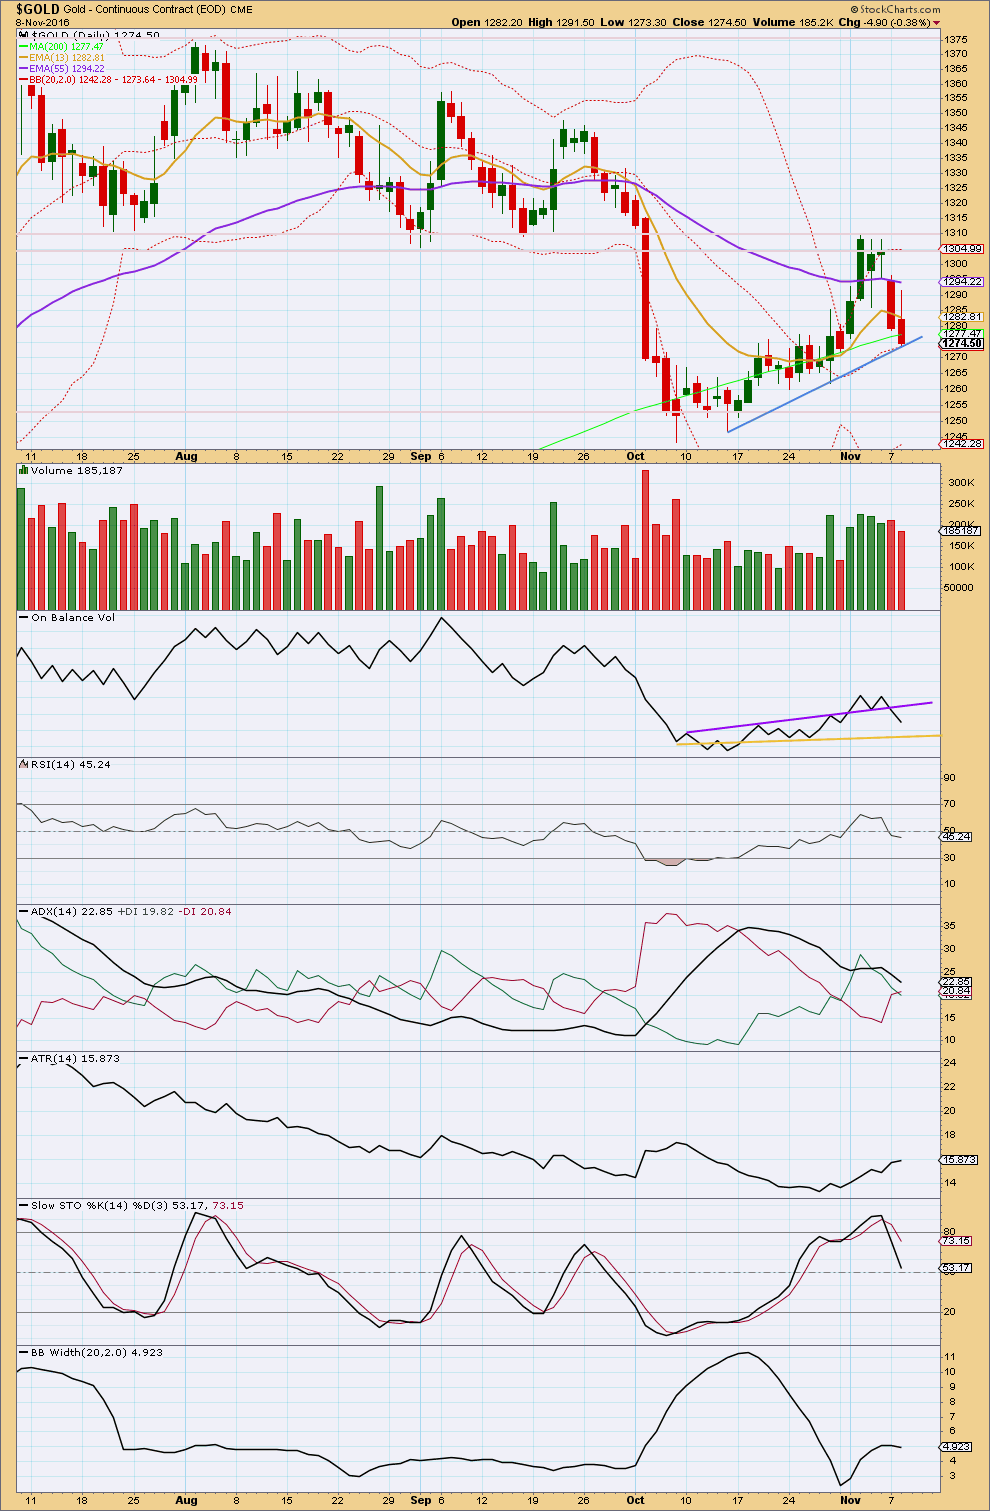
Another reasonably strong downwards day comes with a decline in volume. The fall in price is not supported by volume, so it should be suspicious. Price may now be at support at the blue line. This supports the main Elliott wave count over the alternate.
On Balance Volume did not find support at the purple trend line and has broken below this line. This gives a bearish signal and supports the alternate Elliott wave count. OBV may now find support at the yellow line, but this is some distance away.
RSI is still close to neutral. There is plenty of room for price to rise or fall.
Stochastics is returning from overbought.
ADX today indicates a potential trend change: the -DX line has crossed above the +DX line. ADX does not yet indicate a new trend: the ADX line is still declining.
ATR is increasing still as price now falls for two days. It is possible that this could be the very early stage of a new downwards trend.
Bollinger Bands do not yet indicate a trend as they are flat to slightly contracting as price moves lower.
These three indicators give very mixed signals today. It is not clear enough to conclude there is a downwards trend.
Price has reverted to the mean of the Bollinger Bands after closing above the upper edge for the last four days of upwards movement. This mid line along with the blue trend line may provide support for price here.
This analysis is published @ 07:10 p.m. EST.
It seems like every rally or pop is sold.
Couldn’t we be in for a much bigger correction as per attached chart?
IMO Hoping for a bigger ‘correction’ to play out seeking 1223/1195 & lower. Next up for now looks like heading for a break below 1268-67 for 1261-60…
This is essentially the bear / alternate wave count.
Yes, this remains possible.
The main wave count will see intermediate (A) over. The big spike up will be labelled minor wave 5.
Now intermediate (B) may not move beyond the start of intermediate (A). The invalidation point must move down to 1,242.87.
A couple of weeks or so of sideways movement for wave (B), then a resumption of the upwards trend.
Amazing how gold gave up all its gains and the stock market went from a huge down in pre market to positive for the day so far. Wow!
Lara, has the alternate increased in probability?
No 🙁 If anything IMO it’s reduced in probability. The wave up now fits neatly as a five, for the alternate it needs to be a three for wave B.
Hi Dreamer! Call it a fluke or just my good luck. Noticed the whipsaw early on and with news trickling in of Trump leading, Got a buy at 1270 and sold at 1335, holding 1335 sell looking for a break below 1281 for 1275. Lets see if this can get there~! Have a fine and profitable day….:)Thank you.
Nice call. Gold made a round trip today
So here’s another thought. I read recently that the uncertainty of Brexit in the U.K. has really impacted their GDP. The same will likely occur in the US at least for several months as it will take some time before we know the full extent that the policies of the Trump administration will affect business, taxation, etc. we know that businesses and financial markets hate uncertainty.
This will likely cause the FED to not raise rates in December as the market has been anticipating which could be bullish for gold.
The next few days are going to be interesting. From the overnight price shock high of 1,336.14, gold has already retraced to under 1,300. Trump calmed down his rhetoric during his speech and that seemed to calm the markets somewhat.
So let’s examine some options for gold based on the current EW counts:
1) The alternate count has not yet been invalidated, so caution is still in order until we get some follow through above the invalidation point of 1,343.38. Wouldn’t it be crazy if the alternate still played out?
2) This could be a blowoff top for Minor 5 to complete Intermediate wave A, which would mean that gold could meander sideways for a couple of months or so. Maybe until Trump gets inaugurated in January.
3) Gold could pause here and consolidate for a couple of days, then continue higher for a week or so to then complete Intermediate wave A. This would be similar to the Brexit movement
Any thoughts?
I do agree with the scenarios you outlined.
Once more, we are at the 1300+/- crossroads. The last time price tried to fall below 1300, it found it to be staunch support. At this juncture since 1300, which was supposedly support turned resistance, was breached without serious effort, it may once again prove to be strong support. I would think price may languish there for a while (taking a breather) before deciding which direction it would take next. My gut feeling is still the uptrend.
Now, if price decides to drop further, much more than 1300- then that will most probably be Intermediate B. But if not, and a very big IF, then I reckon Intermediate A had not completed at the high of 1336.14. We may then need to move price down by one degree, meaning 1336.14 is only Minor 1 of Intermediate A. The move down to 1300+/- will be all or part of Minor 2. In fact, this wave count is gentler on the path towards 1572. There is no need for sudden blow-offs.
The next few days would most probably bring some clarity.
Donald Trump has just been officially announced by CNN as the next US President 1 minute ago and Hillary Clinton has already called him minutes ago to accept that he won the Presidential race. 2:50 am EST
I will refrain from any political commentary here, it may be construed wrongly.
I expect the indices and equities will go down, and Gold will go up.
Let us all make $$$
Lara,
If Wave 5 of (A) has completed, may see a pullback of about $50+ for a (B)?
What is about the EURUSD Elliott Wave Analysis. Can we still stick on the target for end of this year from monthly chart?
Lara, with the upturn to $1337 ish is it possible that Minor 5 (thus intermed A) is complete already? Wouldn’t sharpness of the move be too quick for a minor wave –or is that not part of the consideration in elliott wave? Need your help.
PS – please do a weekly update for us too
That is a big help! Wondering if the crack down on large Rupee banknotes might be another catalyst for gold.
If you are interested in buying the Miners tomorrow, this may help…
Note that the Jr Miners pulled back for 2 days after the Brexit gap up
Thank you so much Dreamer for these charts.
I will chime in with this too: most price shocks (this is what today is) are either mostly or fully retraced. In this instance we are not expecting a full retracement, but it is a possibility that we must acknowledge.
Trading is mostly an emotional affair, in that it is a battle to remain unemotional in the face of two of the strongest of human emotions; fear and greed. ATM we must overcome greed. “I don’t want to miss out!”
Wait for the pullback.
I entered a long position yesterday, it became positive so I moved my stop to slightly above breakeven before I went to sleep. I was stopped out.
I have no loss, but nor do I have the profit I hoped for. I am aware greed is driving me, so I must wait patiently.
Tomorrow I will be up early. I will be using a new method that Cesar has devised to look for an end to the pullback, then an old method I have to look for an entry point. I will let you all know what I find.
If any other members find an entry point please share. Let us all band together to make $$$
So looking for a massive gap up in GDX, probably to around 27 or higher. Watch 27.7 as that is my target for Minor wave 3 to end. 27.70 is over a 15% gain! That means NUGT will be up a whopping 45%. Wow!
The pullback that we get for Minor wave 4 may be a buying opportunity if you want to get long. Minor 2 lasted 5 days and was a deep correction, so Minor 4 may also last 5 days or so but will likely be a shallow correction, like a flat or triangle. Good luck to all in this crazy Market.
By the way, based on the GDX count, I think Lara’s higher gold target is more likely.
Thanks Dreamer, amazing the way things unfold.
Donald Trump’s surprise much stronger than expected results so far tonight in yet the undecided US Presidential election has boosted gold up to 1,330 like the main bullish hourly wave count. Lara’s first target 1329 and if keeps rising then 1366, holy toledo, Mama Mia, who would of guessed, sort of like the overnight Brexit surprise. Good luck to all!
God help the world if Trump wins and prosperous trading for the miners investors no matter who wins.
My broker data has Gold up at 1,323.24. It looks like there will be a swift strong fifth wave up.
First target: 1,329 minor 5 = minor 3.
If price keeps rising then the second target: 1,366 minor 5 = 1.618 X minor 3.
If Trump prevails wonder what gold stocks will do? Opened high and sold off after Brexit.
Yep, if history repeats, tomorrow at the low of the day will be the best time to buy….
Wow, gold is making it’s move and it’s up. It’s looking like a surprise Trump win may be in sight. Sad day for the US if he wins…
I do tend to agree with that sentiment, but I am also aware that we have some Trump supporters in this membership.
We are all free to express our opinion on this, especially as for many of us (even outside the USA) it’s going to impact our lives.
But because this is politics I’ll just leave here a very gentle reminder that discussion is absolutely okay, as long as it is all very civil and polite.
My biggest opposition to Trump would be his attitudes to women…. what with me being a woman and all. I have female relatives in Texas, this is going to impact their lives.
I’m with you…Lara…not to mention Trump’s unstatesmanlike behavior. His capability as an international representative for the USA will likely be very questionable.
Although one of our members over at EWSM pointed out that if we are indeed in a bear market (and S&P behaviour today suggests we are) then whoever is in power for the next 4 years will be blamed for the economy doing all manner of awful things.
So in that regard, yeah, Trump may be the better candidate.
I would not have been able to bring myself to vote for him. But then I would have had problems voting for Clinton too.
So glad I’m down here in NZ. The weather is lovely today and I’m drinking bubbles… celebrating these markets finally moving!
I think we should divorce politics from trading. All of us have our own viewpoints, and nothing concrete may emerge from our ramblings.
Since everybody is in the mood, I would just like to look at the situation from a rational level headed perspective rather than single out some glaring omissions from particular individuals. Just as in trading, sentiment and emotions have to take the backseat. Pure logic and reason should rule. Moreover, don’t forget that much of the so called “news” we glean off the western media are often dubious. Just like trading advice, what they proliferate would only suit their own agenda, whatever that they may be. We hardly get a balanced view. Worse yet, we regurgitate the same and recipients often do not question the authenticity. This will be passed down, and the end result will be like the Tower of Babel.
For one, I don’t think America will be much worse than before. Years of empty promises and rhetoric had totally alienated the working class from the incumbent regime. For these folks, the realities of life are much closer to the heart than some lofty ideals such as racism and misogyny. Jobs and food on the table are what matter most. That they had responded so in the polls speaks of how much they view with sarcasm the manipulations and the selling out of the politicians. They want change, anything but the malicious irksome status quo. They deem it prudent to wake up before the bovine excrement (an euphemism, I can’t bring myself to express crass language) piles up.
Alan, from an outside point of view, I think you nailed the US voter sentiment. While the US has excelled in technology in recent decades creating new wealth, the middle class have been excluded for the most part and feel that their standard of living has declined. High paying blue collar jobs have disappeared as manufacturing has moved to other countries. So this is a vote against “the establishment” as folks look for change. And like you said, with “hope” for a better future, voters overlooked the candidates many shortcomings such as treating others with respect. So back to logic and trading profitably. ?
A big move out of the triangle is very close for GDX. Maybe it happens tomorrow with the election results. IMO the technical indicators look more bearish today, so the breakout may be downward.
~ RSI has moved below 50 and has broken the short term uptrend line
~ PRICE has had false breakouts up and down from the triangle so far
~ The highest volume days since the record down day volume in early October have also been on down days. This suggests a downward breakout may occur
~ OBV appears to be breaking downward from support and may have more room to fall
A downwards break from the triangle suggests that GDX will make a new intermediate low below 22.50
IMO favoring the Alternate Hourly to be in play. Gold price already got dumped below 20dma in the early get go. Gold price is weak below pivot with upside limiting to 1286/95 range, a pullback is expecting from within for a take out of 1268 and minor 4 invalidation 1264.72…. Lets see how this works for me. GL all!
Syed, you may be right….