
Last analysis expected an upwards correction was not over.
Price has overall moved higher but remains below the invalidation point.
Summary: A second wave correction may be over here or very soon. If it continues higher, price should find resistance about 49.25. The target for a third wave down from here is 33.24.
New updates to this analysis are in bold.
MONTHLY ELLIOTT WAVE COUNT
Click chart to enlarge.
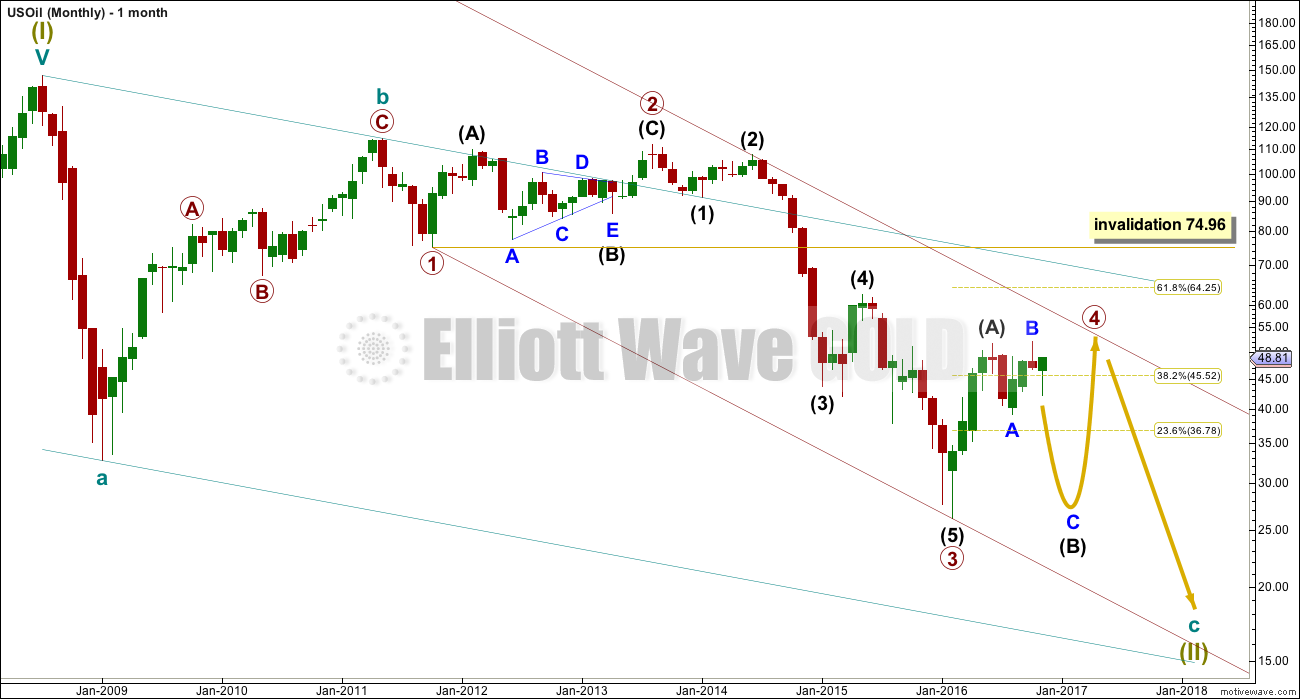
Within the bear market, cycle wave b is seen as ending in May 2011. Thereafter, a five wave structure downwards for cycle wave c begins.
Primary wave 1 is a short impulse lasting five months. Primary wave 2 is a very deep 0.94 zigzag lasting 22 months. Primary wave 3 is a complete impulse with no Fibonacci ratio to primary wave 1. It lasted 30 months.
Primary wave 4 is likely to exhibit alternation with primary wave 2. Primary wave 4 is most likely to be a flat, combination or triangle. Within all of these types of structures, the first movement subdivides as a three. The least likely structure for primary wave 4 is a zigzag.
Primary wave 4 is likely to end within the price territory of the fourth wave of one lesser degree; intermediate wave (4) has its range from 42.03 to 62.58.
Primary wave 4 may end if price comes up to touch the upper edge of the maroon channel. The upper edge of this channel has been pushed up to sit on the end of intermediate wave (2) within primary wave 3.
Primary wave 4 is most likely to be shallow to exhibit alternation in depth with primary wave 2. So far it has passed the 0.382 Fibonacci ratio at 45.52. It may now continue to move mostly sideways in a large range.
Primary wave 4 may not move into primary wave 1 price territory above 74.96.
DAILY ELLIOTT WAVE COUNT
Click chart to enlarge.
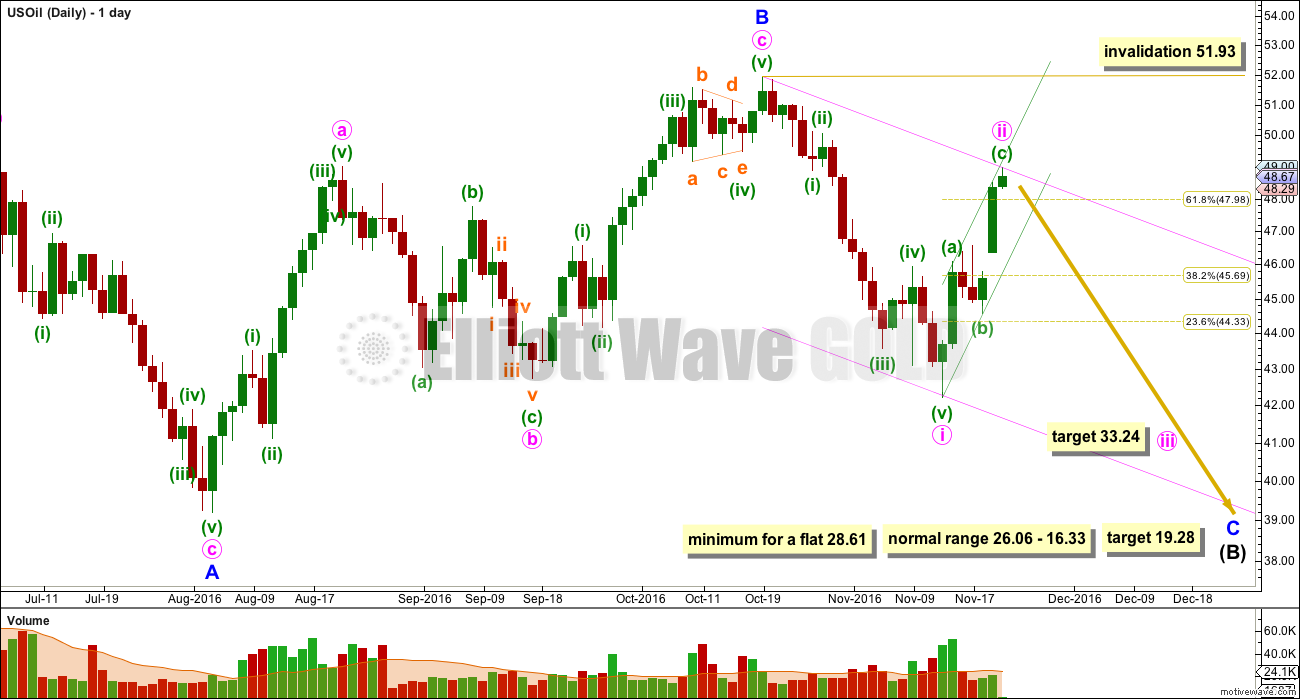
Intermediate wave (A) fits neatly as a double zigzag. This is classified as a three.
Intermediate wave (B) now looks like a flat correction. This is also classified as a three.
Within a flat correction, the minimum depth for intermediate wave (B) is 0.9 the length of intermediate wave (A) at 28.61. Intermediate wave (B) may make a new price extreme beyond the start of intermediate wave (A) below 26.06 as in an expanded flat.
Within intermediate wave (B), minor wave B is a completed zigzag structure.
Minor wave B is a 1.02 length of minor wave A. This would indicate a regular flat correction. Minor wave B has ended within the normal range of 1 to 1.38 times the length of minor wave A, from 51.67 to 56.41.
Normally, the length for minor wave C would be expected to be about equal with minor wave A, but this would not bring price down to the minimum requirement one degree higher for intermediate wave (B) to be 0.9 the length of intermediate wave (A) at 28.61.
The ratio used to calculate the target is 2.618 the length of minor wave A at 19.28.
Minor wave C downwards must subdivide as a five wave structure. It is unfolding as an impulse.
Within minor wave C, the current upwards movement may be a deep second wave correction for minute wave ii. Minute wave ii looks like a complete zigzag that is slightly deeper than the 0.618 Fibonacci ratio. It may be over here.
At 33.24 minute wave iii would reach 1.618 the length of minute wave i.
Minute wave ii may not move beyond the start of minute wave i above 51.93.
TECHNICAL ANALYSIS
DAILY CHART
Click chart to enlarge. Chart courtesy of StockCharts.com.
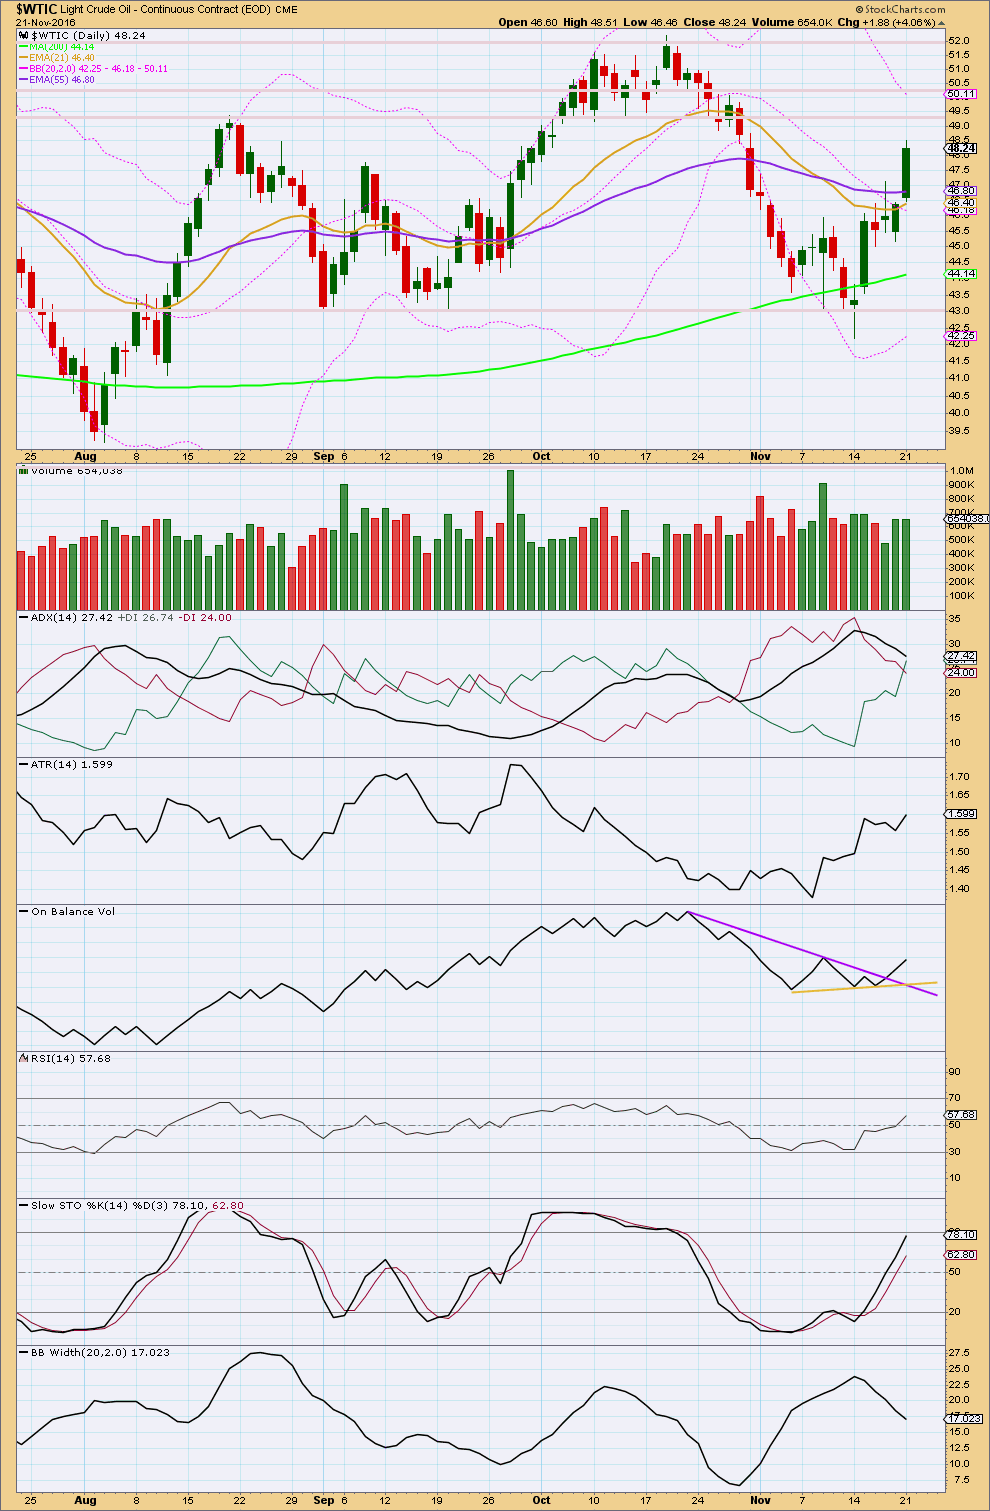
Price is bouncing strongly up from support about 43.00, with a spike below this point. There was a Morning Doji Star and a Bullish Engulfing candlestick pattern at the last low, which are reversal patterns.
Price may find resistance about 49.25 and thereafter about 50.25.
The last two days of upwards movement show a decline in volume. The bulls may be tiring. This does not signal a trend change here. It only indicates weakness.
ADX is declining, indicating no clear trend. The +DX and -DX lines have just crossed indicating a possible trend change from down to up.
ATR is increasing, indicating a trend. But Bollinger Bands are contracting while price is moving higher, so this does not look like a healthy sustainable trend.
On Balance Volume gives a weak bullish signal with a breach of the purple resistance line. This line is steeply sloped and only tested three times, so it does not have good technical significance.
RSI is not extreme and does not exhibit divergence with price. There is room for price to continue higher.
Stochastics is nearing overbought, but it is not there yet. There is room for price to continue higher.
At lower time frames, there is some weakness at the end of today’s upwards movement. Along with declining volume and contracting Bollinger Bands this suggests an end to upwards movement is close by.
This analysis is published @ 03:05 a.m. EST.
Nice call on oil!