
Last analysis expected downwards movement.
Price has moved overall lower for the week.
Summary: Overall, the mid term trend for Oil still looks to be down. A second wave correction is likely to have ended four sessions ago. Downwards movement should show an increase in momentum for the next week. The only concern today is a strong upwards session for the 28th of November with strong support from volume.
New updates to this analysis are in bold.
MONTHLY ELLIOTT WAVE COUNT
Click chart to enlarge.
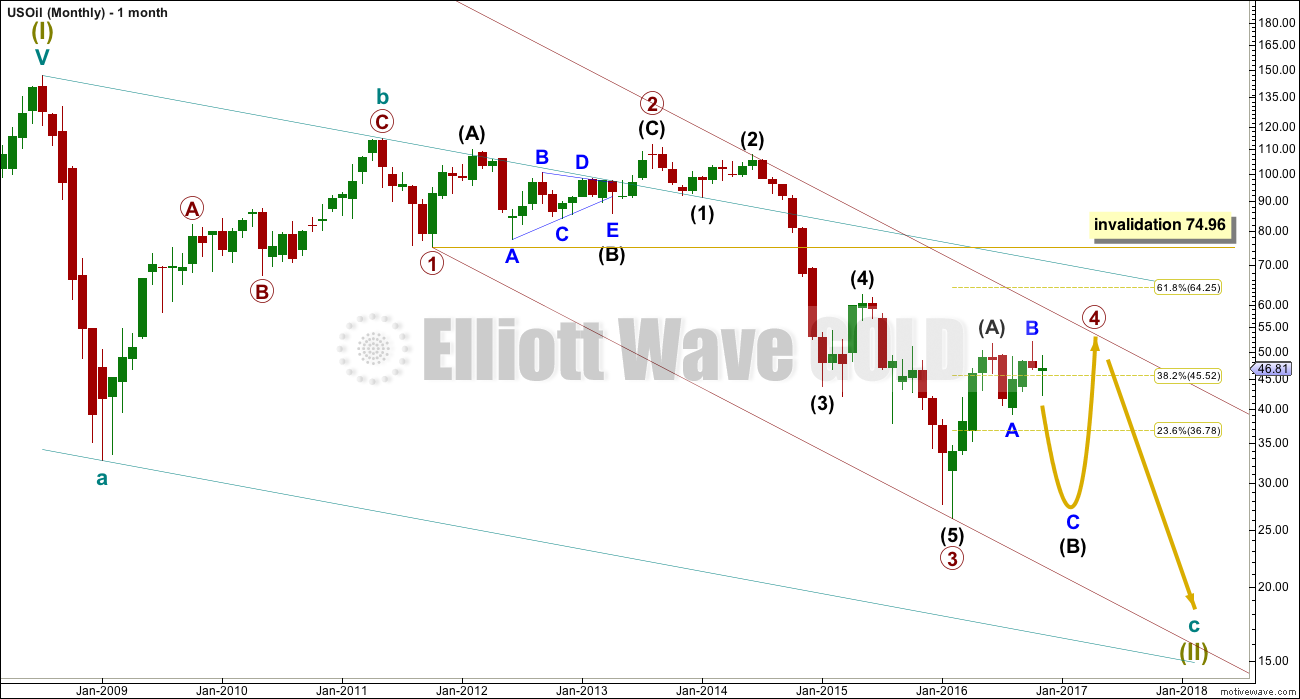
Within the bear market, cycle wave b is seen as ending in May 2011. Thereafter, a five wave structure downwards for cycle wave c begins.
Primary wave 1 is a short impulse lasting five months. Primary wave 2 is a very deep 0.94 zigzag lasting 22 months. Primary wave 3 is a complete impulse with no Fibonacci ratio to primary wave 1. It lasted 30 months.
Primary wave 4 is likely to exhibit alternation with primary wave 2. Primary wave 4 is most likely to be a flat, combination or triangle. Within all of these types of structures, the first movement subdivides as a three. The least likely structure for primary wave 4 is a zigzag.
Primary wave 4 is likely to end within the price territory of the fourth wave of one lesser degree; intermediate wave (4) has its range from 42.03 to 62.58.
Primary wave 4 may end if price comes up to touch the upper edge of the maroon channel. The upper edge of this channel has been pushed up to sit on the end of intermediate wave (2) within primary wave 3.
Primary wave 4 is most likely to be shallow to exhibit alternation in depth with primary wave 2. So far it has passed the 0.382 Fibonacci ratio at 45.52. It may now continue to move mostly sideways in a large range.
Primary wave 4 may not move into primary wave 1 price territory above 74.96.
DAILY ELLIOTT WAVE COUNT
Click chart to enlarge.
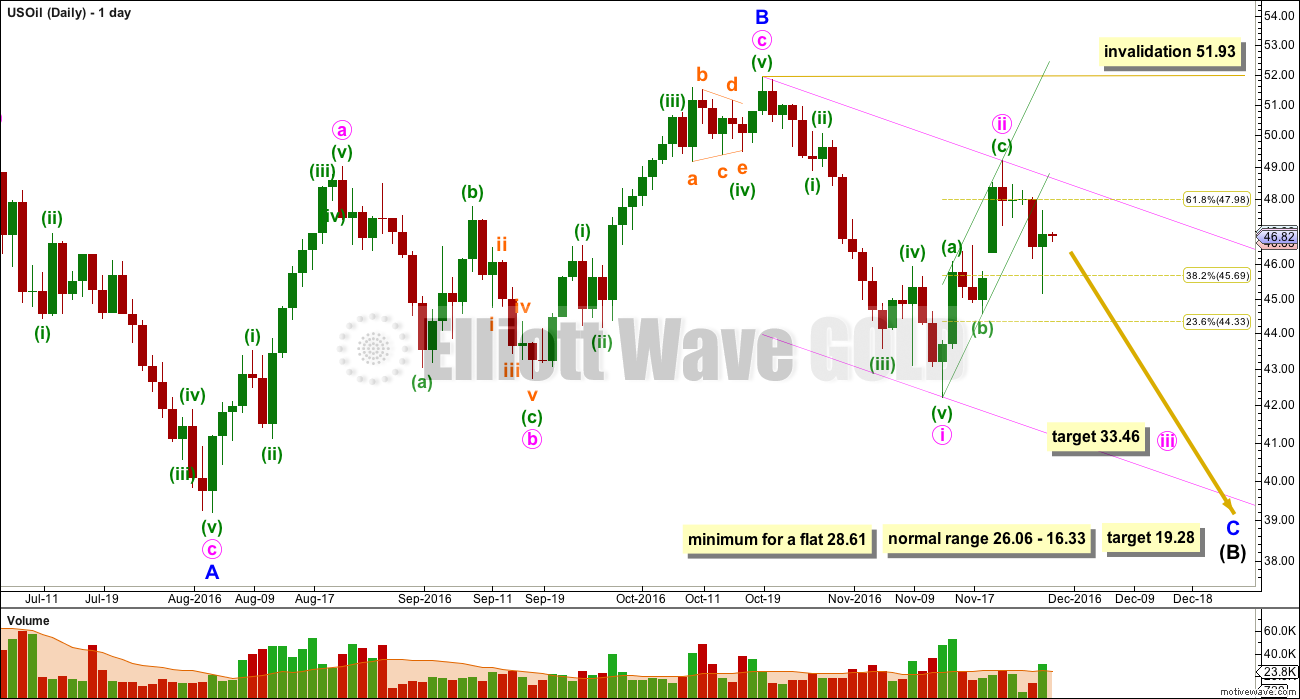
Intermediate wave (A) fits neatly as a double zigzag. This is classified as a three.
Intermediate wave (B) now looks like a flat correction. This is also classified as a three.
Within a flat correction, the minimum depth for intermediate wave (B) is 0.9 the length of intermediate wave (A) at 28.61. Intermediate wave (B) may make a new price extreme beyond the start of intermediate wave (A) below 26.06 as in an expanded flat.
Within intermediate wave (B), minor wave B is a completed zigzag structure.
Minor wave B is a 1.02 length of minor wave A. This would indicate a regular flat correction. Minor wave B has ended within the normal range of 1 to 1.38 times the length of minor wave A, from 51.67 to 56.41.
Normally, the length for minor wave C would be expected to be about equal with minor wave A, but this would not bring price down to the minimum requirement one degree higher for intermediate wave (B) to be 0.9 the length of intermediate wave (A) at 28.61.
The ratio used to calculate the target is 2.618 the length of minor wave A at 19.28.
Minor wave C downwards must subdivide as a five wave structure. It is unfolding as an impulse.
Within minor wave C so far, the downwards wave labelled minute wave i looks like a five and now minute wave ii upwards looks like a three. So far, with a five down and three up, it looks like the trend direction for Oil is down.
The green spinning top candlestick for the session of the 28th of November may have been a backtest to test resistance at the lower edge of the green channel.
This wave count expects to see some increase in downwards momentum for the next week.
At 33.46 minute wave iii would reach 1.618 the length of minute wave i.
Minute wave ii may not move beyond the start of minute wave i above 51.93.
TECHNICAL ANALYSIS
DAILY CHART
Click chart to enlarge. Chart courtesy of StockCharts.com.
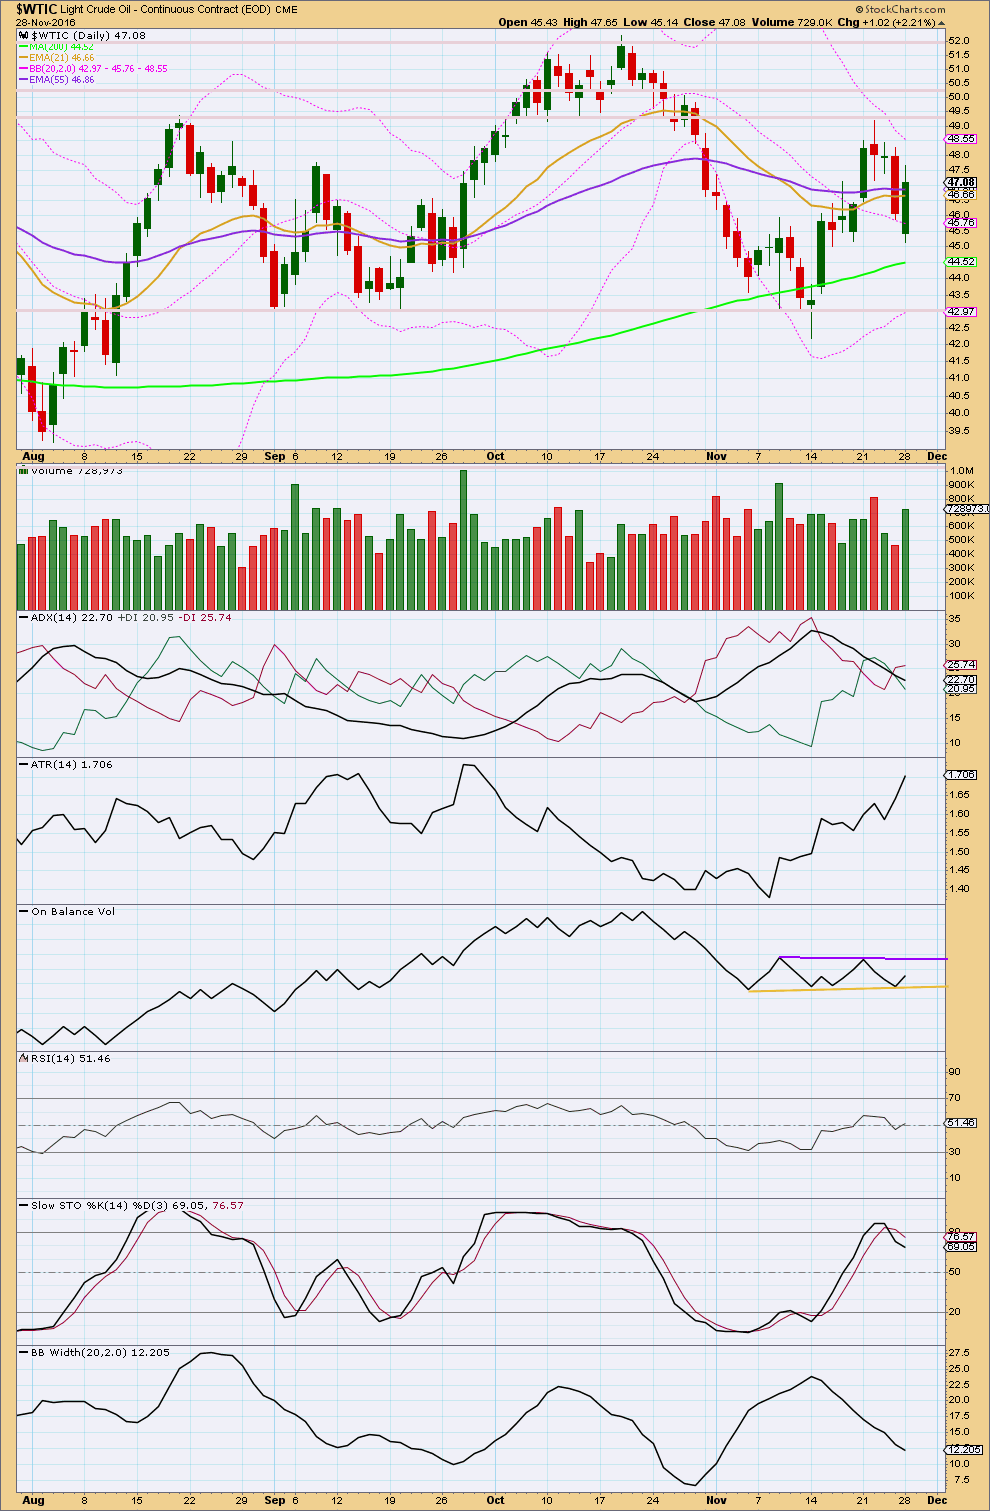
The strong red daily candlestick for the 25th of November did not have support from volume. Now the strong green daily candlestick for the 28th of November does have support from volume. This suggests that bulls may have energy left to push price higher here.
Resistance should still be expected about 49.25.
While price has essentially been moving overall higher since the last swing low on the 14th of November, ATR has been increasing. ATR suggests an upwards trend may be in place.
ADX disagrees though and indicates the market is consolidating: the +DX and -DX lines are whipsawing about each other.
Bollinger Bands agree as they contract.
On balance, it is concluded that this upwards movement is most likely a counter trend movement. The mid term trend may still be down.
On Balance Volume trend lines are redrawn. Resistance may be expected at the purple line and support at the yellow line. A break out of this range may indicate the next direction for price.
This correction has brought Stochastics up to overbought. If price does move a little higher before it turns, if any divergence is exhibited between price and Stochastics, then expect an imminent reversal. A downwards reaction is a reasonable expectation about here.
RSI is neutral. There is room for price to rise or fall.
This analysis is published @ 09:15 p.m. EST.
Ups, oil hits $42.40 on the january contract today. I guess in Lara terms, the daily, the weekly and the monthly wave count has been invalidated, and now the wave count that could be right this time, if ever, means that we should now join the bulls and buy into this overbought territory because the new wave count means oil is now going to $58.05. Before it was going to $19.28, but now it is going to $58.05. JAAA.
My bet, it is going to be wrong again. Who knows what’s gonna happens? Certainly Elliott Wave is not helping.
Updated classic TA:
Firstly the decline in volume today from yesterday indicates bulls are tiring. But volume is still relatively heavy, and during Oils trends it can fluctuate somewhat. This is an annoying tendency for this market, so this one thing on its own can’t be read with too much weight.
On Balance Volume is giving a bullish signal today with a break above the purple resistance line. Give that signal reasonable weight, it’s usually a good one.
ADX indicates an upwards trend, ATR agrees, Bollinger Bands agree. Assume the trend is up now.
Neither Stochastics nor RSI are extreme yet, the trend has room to continue higher.
Overall the picture is looking very bullish here for Oil.
Today that is.
Or… something else is happening.
Back to the old problem of B waves. Here it could be a continuation of minor wave B within intermediate (B).
At 58.05 minute c = 1.618 X minute a. Minor B is a flat correction. Minute c must complete as a five wave structure.
Short term within minute wave c the correction for subminuette iv may not move into subminuette i price territory below 49.19.
What that means is a new low short term below 49.19 would indicate that this sharp upwards thrust may be over.
This is either a very very deep second wave correction, or something else is happening.
Updated chart of count above here.
Target for minute iii = 2.618 X minute i
We have reach as far as $51.80 dollar per barrel today on the January Contract for West Texas Oil Futures. We are very close to breach the $51.93 level and invalidate the daily and monthly Elliott Wave Count.
Lara, we need an update now, urgent.
Thanks
Dear Lara,
Could you pls update your view on crude oil market.
Yes, I’ll post a chart today in comments.
this is turning into a flat minute wave 2 with more upwards to go I think
Agree.
I also agree that it is likely that price will continue somewhat upwards. However, I don’t see a flat for Minute ii. Am I missing something?
Given the strength of the upward movement in price today surpassing the high of Nov. 22nd, I favor Lara’s suggestion that Minute ii developing as a double zigzag, with Minuette W as a complete zigzag. In Minuette Y, so far, I can see an incomplete subminuette a developing as a 5 wave structure, suggesting another zigzag which must terminate at or below 51.91 if this count is to be valid.
I’ve gone flat for oil until this OPEC meeting is over.
I’m very bearish oil, but the big risk is that the markets will become exuberant whatever the outcome and stop me out at a much higher level before resuming the downtrend.
Oil is finding support at the 200 day MA. Watch also the short support line on On Balance Volume.
Price breaking below the 200 day MA and OBV breaking below the support line would be a good bearish signal. If that happens go short (if members aren’t already).
For now the small concern is volume. But Oil doesn’t always have clear volume with its trends; example the first two days of the last wave down, 20th and 21st October, didn’t look clear. That could have been read as price consolidating.
That spike on Monday entirely due to “great expectations” regarding an OPEC consensus on production cuts. It is quite clear all the talking heads pushing optimism regarding a deal are totally clueless about the long standing animosity between the Saudis and the Iranians. Much of what is going on in Syria is nothing more than a proxy war between these two. The chances of a snow-ball in you-know-where are greater than accommodation between them, and this despite the fact that Iran would probably benefit by agreeing to a production cap of some sort by an increase in price. They will absolutely refuse to any cut in production just cuz its what the Saudis want. Take it to the bank. Oil is going lower.
Lara, I am new to EW theory and maybe I don’t understand something, but, on hourly chart, first movement for minute wave iii is a zigzag… how can it fit into your count?
It depends on which corrections within it you count at which degree.
Sometimes fourth waves are much quicker than second waves for commodities. This happens because a fifth wave within the impulse (either the final fifth wave of the same degree, or the fifth wave to end the third wave within the impulse) is a very strong extension. When fifth waves do that they effect the fourth wave that comes before of the same degree, or after of one degree higher. They cause the fourth wave to be very brief and shallow. This gives what should look like a five a strong three wave look.
I’ve seen Gold do this very often, and Oil behaves pretty much the same.
With all that said though I understand your concern. Yes, that movement looks like a three.
So I could have it wrong, it could be wave X within a double zigzag and this second wave correction could be moving higher.
And of course the other entirely viable explanation is it’s a wave 1-2, 1 for a new impulse down.
In other words, the three you see (now a five but overlapping) is an incomplete impulse.
Thanks a lot!