
Again, downwards movement continues as expected.
The target and minimum requirement remain the same based on Elliott wave structure.
Summary: The target for the next wave down is at 19.28. Downwards movement is supported by volume. In the short term, oversold indicators suggest a small consolidation may arrive soon but not necessarily the end of the downwards trend.
New updates to this analysis are in bold.
MONTHLY ELLIOTT WAVE COUNT
Click chart to enlarge.
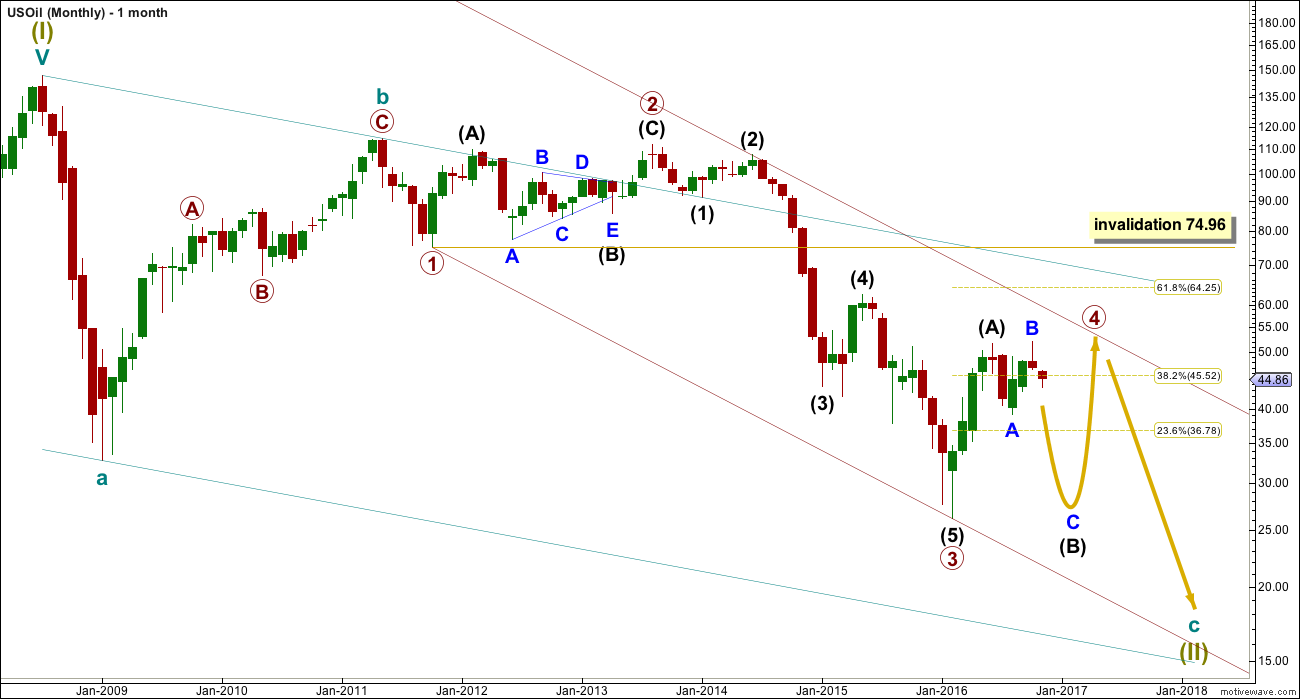
Within the bear market, cycle wave b is seen as ending in May 2011. Thereafter, a five wave structure downwards for cycle wave c begins.
Primary wave 1 is a short impulse lasting five months. Primary wave 2 is a very deep 0.94 zigzag lasting 22 months. Primary wave 3 is a complete impulse with no Fibonacci ratio to primary wave 1. It lasted 30 months.
Primary wave 4 is likely to exhibit alternation with primary wave 2. Primary wave 4 is most likely to be a flat, combination or triangle. Within all of these types of structures, the first movement subdivides as a three. The least likely structure for primary wave 4 is a zigzag.
Primary wave 4 is likely to end within the price territory of the fourth wave of one lesser degree; intermediate wave (4) has its range from 42.03 to 62.58.
Primary wave 4 may end if price comes up to touch the upper edge of the maroon channel. The upper edge of this channel has been pushed up to sit on the end of intermediate wave (2) within primary wave 3.
Primary wave 4 is most likely to be shallow to exhibit alternation in depth with primary wave 2. So far it has passed the 0.382 Fibonacci ratio at 45.52. It may now continue to move mostly sideways in a large range.
Primary wave 4 may not move into primary wave 1 price territory above 74.96.
DAILY ELLIOTT WAVE COUNT
Click chart to enlarge.
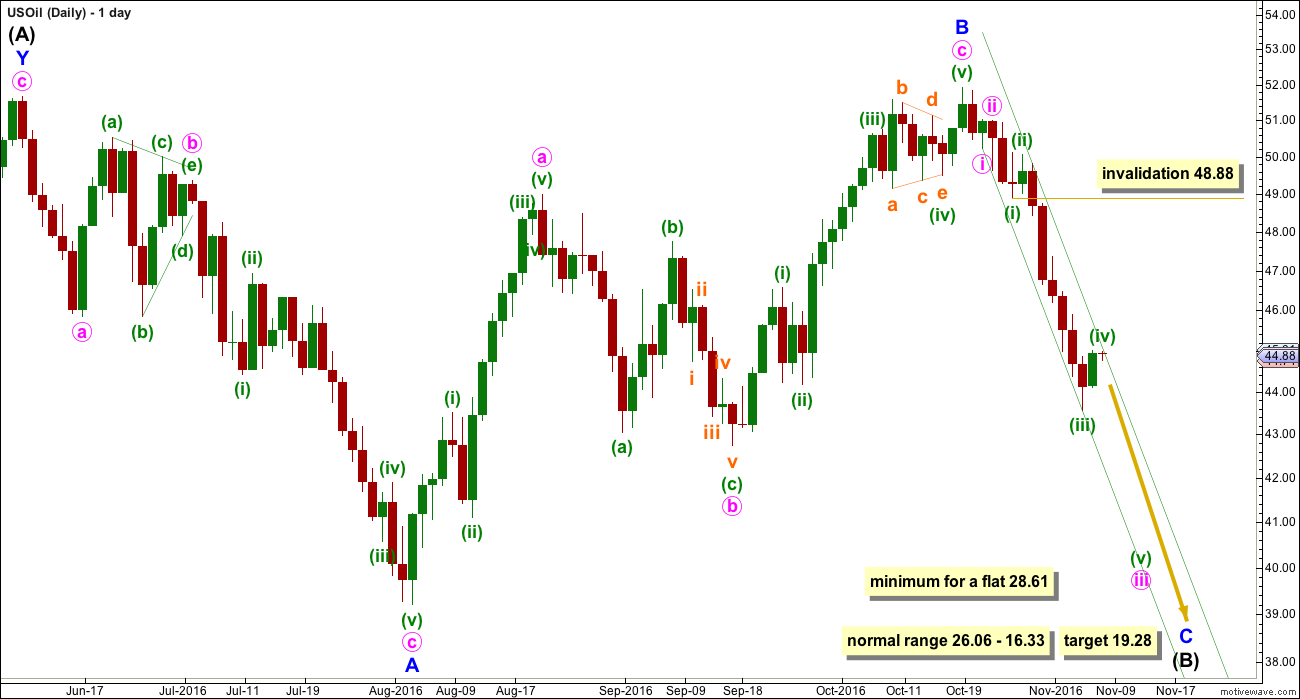
Intermediate wave (A) fits neatly as a double zigzag. This is classified as a three.
Intermediate wave (B) now looks like may have completed as an expanded flat correction. This is also classified as a three.
When both A and B waves subdivide as threes, the larger structure one degree higher is either a flat or triangle. Within a triangle though, no part of intermediate wave (B) should move beyond the end of intermediate wave (A) above 51.67. A new high above 51.67 may have eliminated a possible triangle unfolding at this stage for primary wave 4.
Primary wave 4 looks like it may be unfolding as a flat correction if my analysis of intermediate wave (A) is correct.
Within a flat correction, the minimum depth for intermediate wave (B) is 0.9 the length of intermediate wave (A) at 28.61. Intermediate wave (B) may make a new price extreme beyond the start of intermediate wave (A) below 26.06 as in an expanded flat.
Intermediate wave (B) is unfolding as a flat correction. Within intermediate wave (B), minor wave B is a completed zigzag structure.
Minor wave B is a 1.02 length of minor wave A. This would indicate a regular flat correction. Minor wave B has ended within the normal range of 1 to 1.38 times the length of minor wave A, from 51.67 to 56.41.
Normally, the length for minor wave C would be expected to be about equal with minor wave A, but this would not bring price down to the minimum requirement one degree higher for intermediate wave (B) to be 0.9 the length of intermediate wave (A) at 28.61.
The ratio used to calculate the target is 2.618 the length of minor wave A at 19.28.
Minor wave C downwards must subdivide as a five wave structure. It is unfolding as an impulse. So far, within minor wave C, minute waves i and ii are complete and minute wave iii is incomplete.
Within minute wave iii, minuette waves (i) through to (iv) look complete. If minuette wave (iv) moves higher, it may not move into minuette wave (i) price territory above 48.88.
The steep green channel is a best fit about minor wave C. If this channel is breached by upwards (not sideways) movement, that shall be the earliest indication that something may be wrong with this wave count. At that stage, short positions should be exited. However, this channel is too steep to have reasonable technical significance. It may be breached only for price to then turn and continue lower. The minimum requirement for intermediate wave (B) at 28.61 has not yet been met.
TECHNICAL ANALYSIS
DAILY CHART
Click chart to enlarge. Chart courtesy of StockCharts.com.
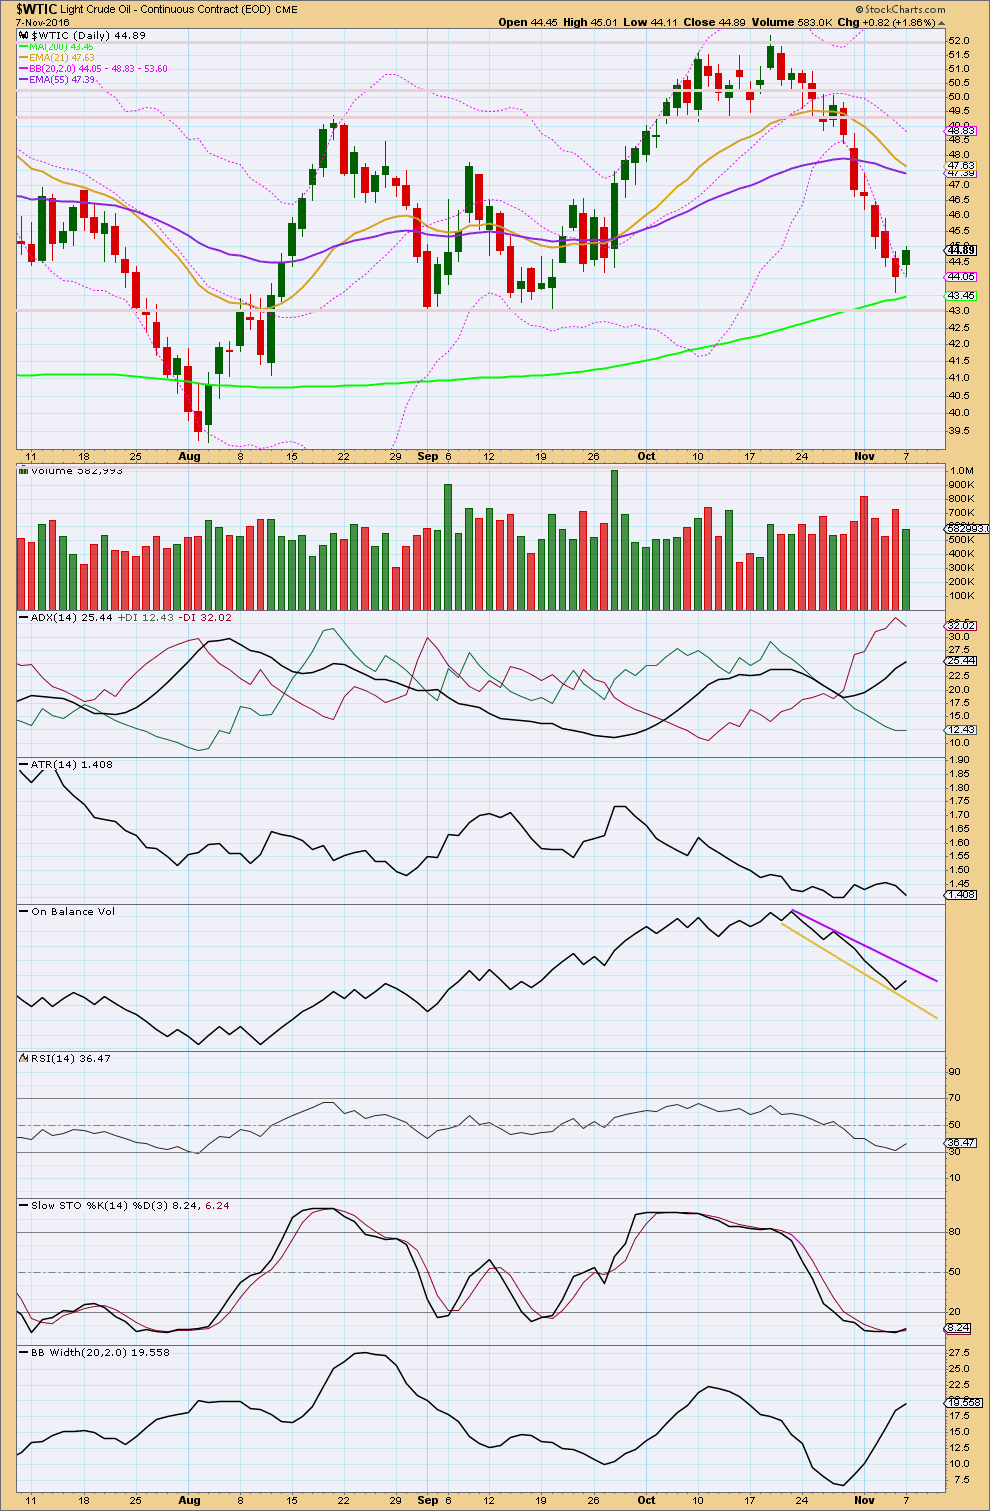
Recent downwards days are showing stronger volume than recent upwards days, supporting the fall in price. The last session completed an upwards day with a decline in volume, so this looks like a small counter trend movement.
ADX is still increasing and is not yet extreme. It indicates a downwards trend is in place.
However, ATR is declining. There looks to be something wrong with this trend because a healthy sustainable trend should have increasing range and not declining.
However, Bollinger Bands are widening as price falls. There is normal volatility to this trend.
With two of these three indicators in agreement, and price obviously trending, it should be assumed there is a downwards trend in place until price tells us there is not. When the short term moving average turns up, that would indicate a trend change.
Price is finding support now at the 200 day moving average and the horizontal support line about 43.
RSI has just bounced up from almost oversold. There is room for price to fall further, but not much more, before a more sizeable correction. Look out for an interruption to this trend soon.
With volume indicating there is not yet support for upwards movement, expect some more downwards movement. But at this stage, classic technical analysis would be expecting a consolidation to last a few days.
Oil can continue with RSI and Stochastics strongly oversold for weeks when it is trending strongly. During the last big wave down for Oil, on the 8th of July RSI moved into oversold. But a mid term low was not found until 24th of August, over a month later. Just because RSI is oversold now does not mean this trend must end, only that a small correction is likely within the trend.
This analysis is published @ 02:29 a.m. EST.
Still holding onto my short position for Oil. Waiting for either the target at 19.28 to be met, or enough weakness to be evident to require an earlier exit.
Neither conditions are met yet.
Redraw the best fit channel slightly. Warning: this is only of minimal use as it’s too steep to have enough technical significance.
Moving my stop to just above the invalidation point 45.94, the last swing high labelled minuette (iv). Protecting some profits.
If this market shows enough weakness to prompt me to exit I will be posting that information here first in comments to allow members to also exit first.
If you are holding onto a short position for Oil then keep an eye on comments.
Thank you, Lara. I really appreciate these updates to your weekly analysis!
You’re very welcome Curtis.
While Gold has been a nightmare to analyse of late at least the Oil analysis became clearer recently and allowed us a trend to profit from.
Now that Gold is down to just one wave count I expect that should be the same case there. Finally a trend and a clearer analysis. We may have not entered at the high, but we should get the meat of it.