
Upwards movement was expected for the short term, but this is not what happened. Price moved sideways to complete an inside day that closed red.
Summary: Upwards movement is expected for about two or seven days to 1,187, and that may complete a small correction. Thereafter, price may again fall.
New updates to this analysis are in bold.
Last monthly and weekly analysis is here, video is here.
Grand SuperCycle analysis is here.
DAILY ELLIOTT WAVE COUNT
Click chart to enlarge.
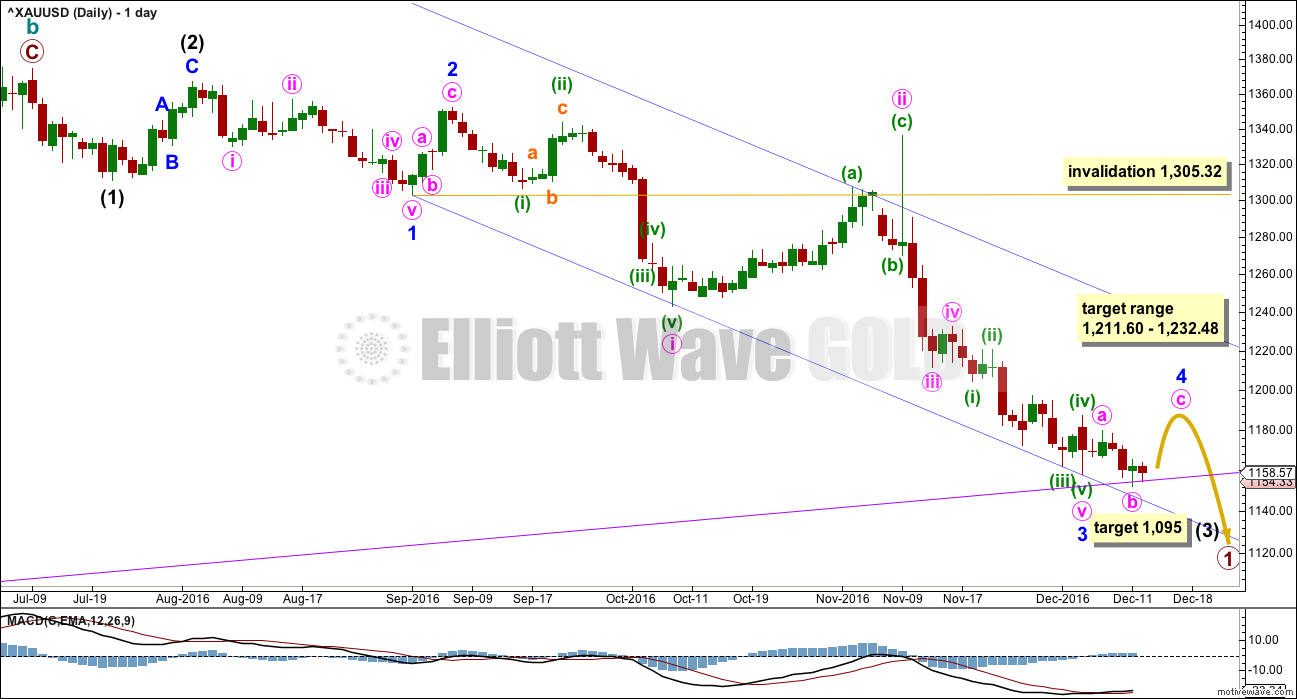
Price may be now in a small consolidation for minor wave 4.
The middle of the third wave may be complete for primary wave 1.
This wave count still suffers from a problem of disproportion between minute wave ii and the two prior second wave corrections one and two degrees higher. Minute wave ii should be quicker than minor wave 2 and especially intermediate wave (2). The fact that it is not must reduce the probability of this wave count.
If minor wave 3 is over, then it has no Fibonacci ratio to minor wave 1.
Ratios within minor wave 3 are: minute wave iii has no Fibonacci ratio to minute wave i, and minute wave v is 2.52 short of 0.618 the length of minute wave iii.
Minute wave v fits as a five wave impulse on the hourly chart even though it does not look quite right on the daily chart.
The blue channel here is a best fit. Draw the first trend line from the ends of minor waves 1 to 3, then push a parallel copy up to contain most of this movement except the spike for minute wave ii. Minor wave 4 may find resistance at the upper edge of the channel if it gets that high.
Minor wave 2 was a deep 0.77 zigzag lasting four days. Minor wave 4 may be a more shallow flat, combination or triangle. These tend to be longer lasting structures than zigzags, so at this stage an expectation of a Fibonacci eight or thirteen sessions would be reasonable. So far it has lasted six and is incomplete.
Minor wave 4 may end within the price territory of the fourth wave of one lesser degree. Minute wave iv has its range from 1,211.60 to 1,232.48. This expectation looks now to be too high at this stage. If the target on the hourly chart is breached, then this range may be used.
Minor wave 4 may not move into minor wave 1 price territory above 1,305.32.
The target for intermediate wave (3) is at 1,095 where it would reach 4.236 the length of intermediate wave (1).
HOURLY ELLIOTT WAVE COUNT
Click chart to enlarge.
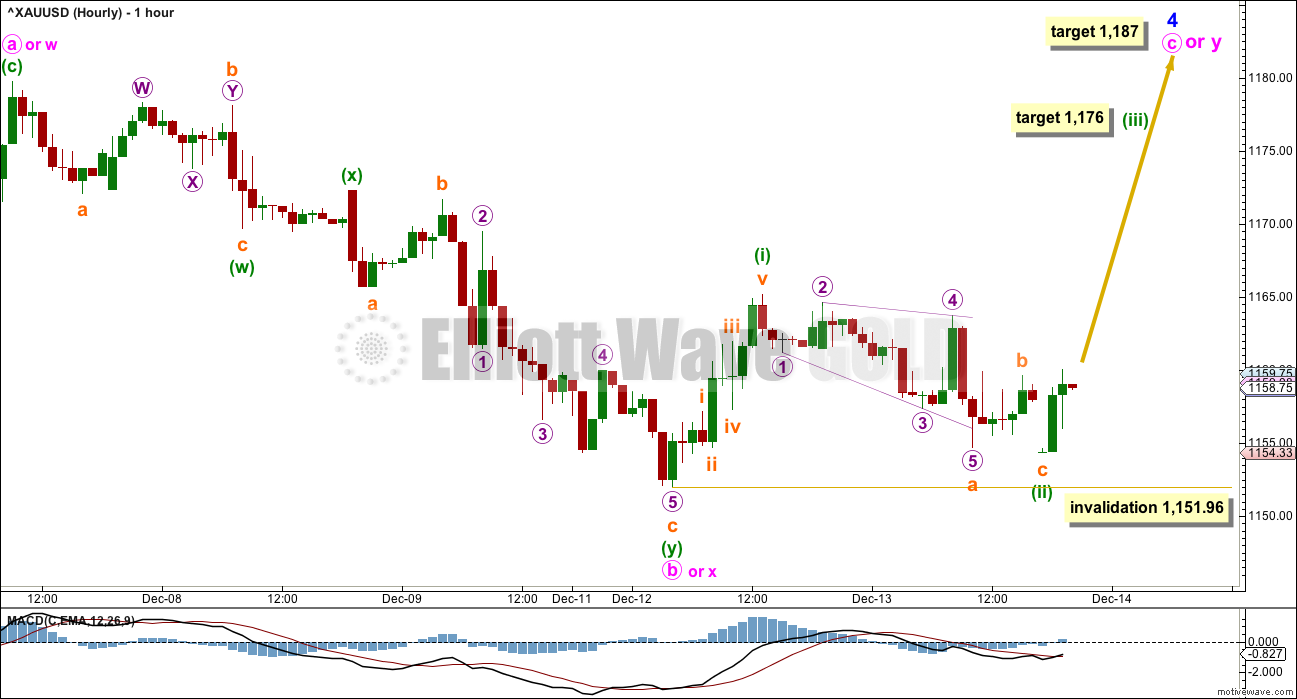
Minor wave 4 is least likely to unfold as a zigzag, so it is unlikely at this stage to be over at the high labelled minute wave a.
If minor wave 4 unfolds as the most likely flat, combination or triangle, then within it minute wave a is most likely to be a zigzag. This is complete.
When A waves subdivide as threes, there is no invalidation point for the following B wave because they may make new price extremes beyond the start of the A wave as in expanded flats and running triangles. The most common range for minute wave b would be from 1 to 1.38 the length of minute wave a at 1,158.03 to 1,149.77. Minute wave b is now within this range and is a 1.28 length of minute wave a.
If minor wave 4 unfolds as a flat correction, then within it the minimum requirement for minute wave b is 0.9 the length of minute wave at at 1,155.62. This has been met.
If minor wave 4 unfolds as a triangle, then there is no minimum nor maximum length for minute wave b within it. It must only subdivide as a three. Minor wave 4 may be unfolding as a running triangle.
If minor wave 4 unfolds as a combination, then the first structure within the combination may be a complete zigzag labelled minute wave w. The double combination now would be joined by a three in the opposite direction labelled minute wave x, which now looks complete. The second structure in a possible double combination may now be either a flat or triangle labelled minute wave y. If minute wave y unfolds as an expanded flat, then it may include a new price extreme beyond its start below 1,151.96. If the invalidation point is breached, then a combination would be indicated; but that looks unlikely at this stage though because the upwards movement labelled minuette wave (i) looks like a five and not a three.
It is still impossible to tell at this stage which Elliott wave structure minor wave 4 will complete as, only to say it is least likely to be a zigzag. There are still over 20 possible structures it may be, so it must be understood that as it continues this analysis at the hourly chart level must be flexible and that the labelling of minor wave 4 may still change in coming days.
At this stage, it looks most likely (about 50%) that minor wave 4 is unfolding as an expanded flat correction. Within the expanded flat, minute wave c must continue higher and must subdivide as a five wave structure. At 1,187 minute wave c would reach 1.618 the length of minute wave a. Within minute wave c, minuette wave (ii) may not move beyond the start of minuette wave (i) below 1,151.96.
Minute wave c may last another two days to see minor wave 4 total a Fibonacci eight days. If it cannot complete in just two more days, then it may continue for a further five to total a Fibonacci thirteen.
ALTERNATE DAILY ELLIOTT WAVE COUNT
Click chart to enlarge.
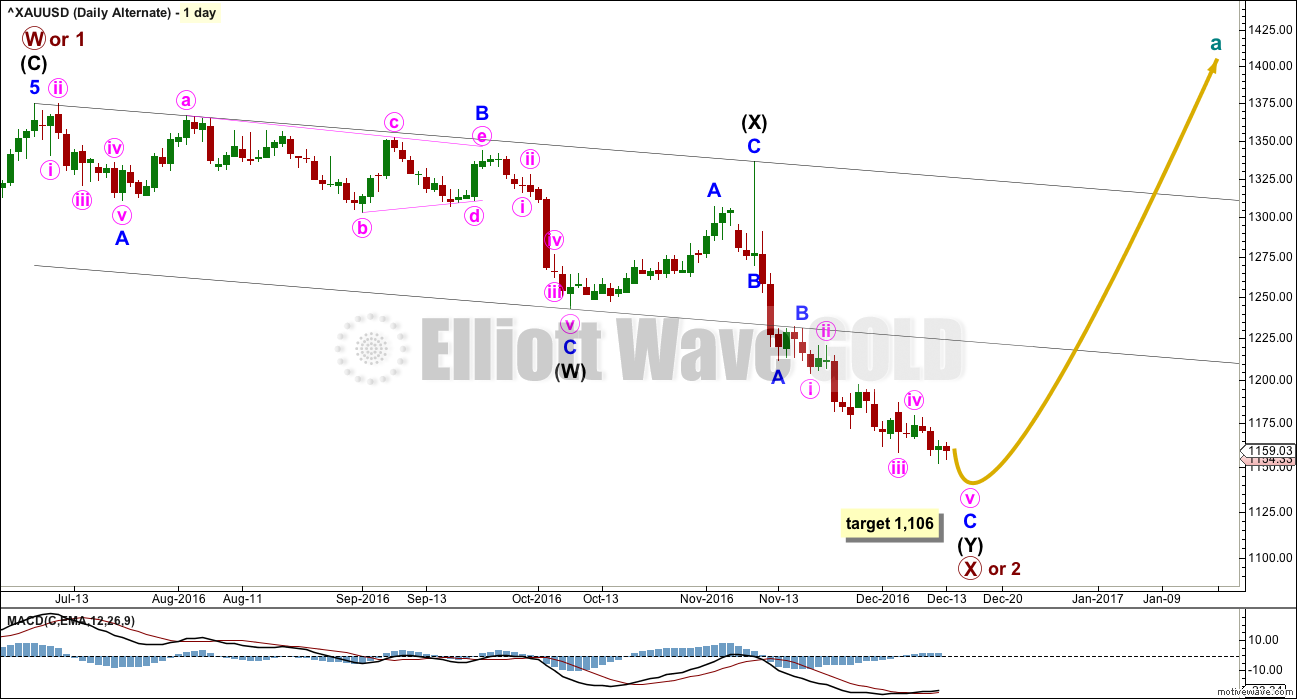
The larger structure of primary wave X (or primary wave 2) may be either a double zigzag or a double combination. The second structure in this double for primary wave Y may be either a zigzag (for a double zigzag) or a flat or a triangle (for a double combination).
If the next wave up is primary wave 3, then it may only subdivide as an impulse.
It is my judgement at this stage that it is more likely primary wave X will be a double zigzag due to the relatively shallow correction of intermediate wave (X). Although intermediate wave (X) is deep at 0.71 the length of intermediate wave (W), this is comfortably less than the 0.9 minimum requirement for a flat correction. Within combinations the X wave is most often very deep and looks like a B wave within a flat.
However, there is no minimum nor maximum requirement for X waves within combinations, so both a double zigzag and double combination must be understood to be possible. A double zigzag is more likely and that is how this analysis shall proceed.
Within the second zigzag of primary wave X, intermediate wave (Y) is now incomplete at the hourly chart level. At 1,106 minor wave C would reach equality in length with minor wave A.
ALTERNATE HOURLY ELLIOTT WAVE COUNT
Click chart to enlarge.
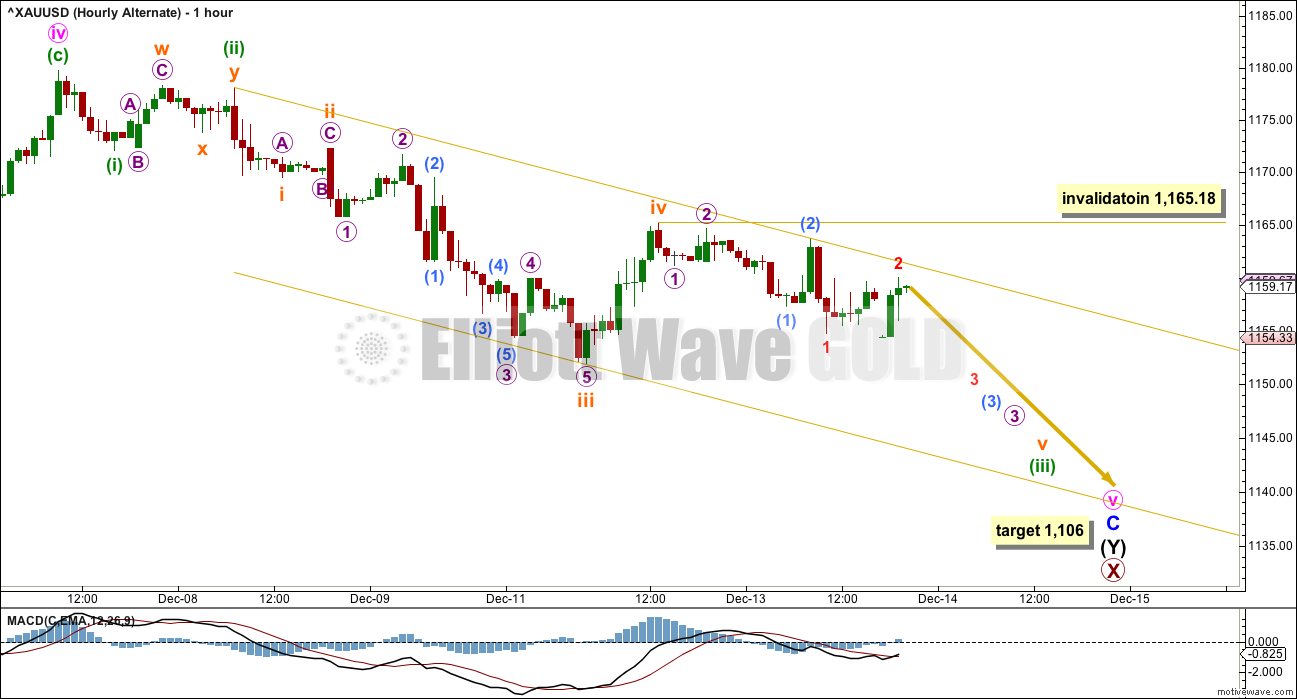
There is so much overlapping within the downwards wave labelled minute wave v, it is still not possible to see this as either a complete impulse nor a complete ending diagonal. The conclusion must be that more downwards movement is required to complete the structure if this alternate wave count is correct.
The lack of momentum, the overlapping, and the breach of the channel that was drawn on this hourly chart for last analysis have all further reduced the probability of this wave count, which is still not supported by classic technical analysis.
Subminuette wave iii may now be complete. Subminuette wave iv may not move into subminuette wave i price territory above 1,169.47.
The target remains the same. At 1,106 minor wave C would reach equality in length with minor wave A.
TECHNICAL ANALYSIS
WEEKLY CHART

Click chart to enlarge. Chart courtesy of StockCharts.com.
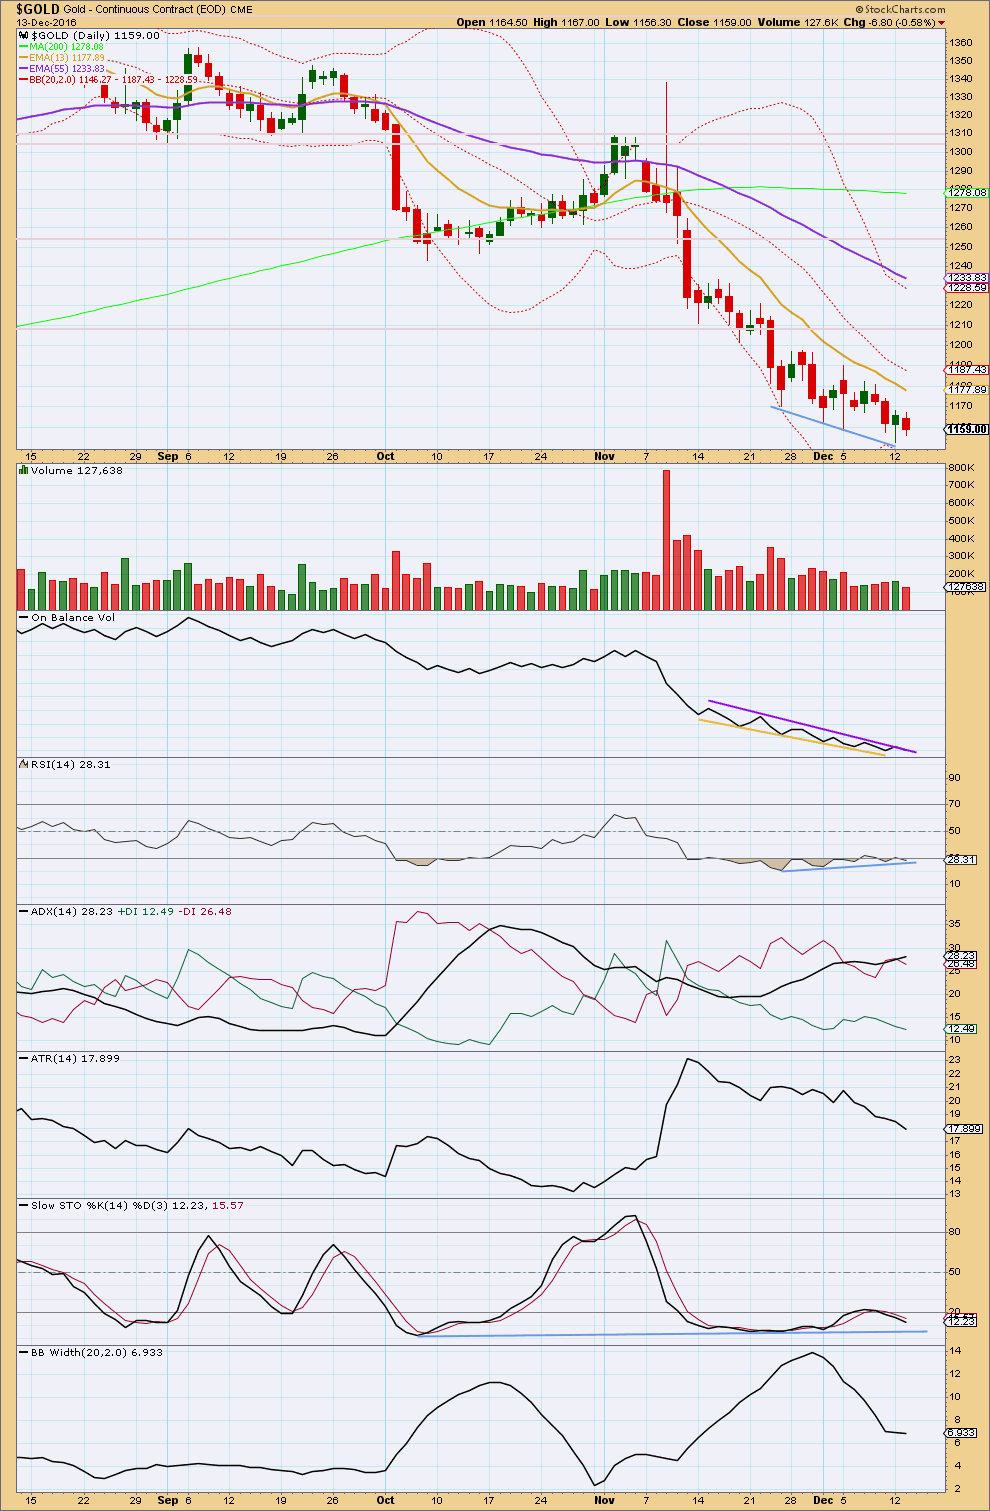
Price is falling as volume is declining. The fall in price is not supported by volume. Price is falling of its own weight, and it can continue to do this for some time. But for a healthy sustainable trend volume should be supporting the movement and that is not the case here.
There is no support line here or close by for On Balance Volume.
RSI is not yet extreme. There is still a little room for price to fall further.
DAILY CHART
Click chart to enlarge. Chart courtesy of StockCharts.com.
A small inside day moved price overall lower to close red, and this does not have support from volume as it declined. Volume is declining as price moves slowly lower over the last several days.
On Balance Volume has provided resistance today. A break above the purple resistance line would be a reasonable bullish signal.
RSI is extreme and there is triple bullish divergence with price at recent lows. This supports the main Elliott wave count over the alternate, fairly strongly, and it is difficult to see how price could fall strongly lower from here. If price does make new lows, it is unlikely to be by much or for long at this point.
ADX still indicates a downwards trend is in place. ATR still disagrees as it is declining. Bollinger Bands are contracting. This trend looks tired and weak. It would be very reasonable to expect either some consolidation for a week or so, or a trend change about here.
Stochastics also is extreme and exhibits divergence with price.
The larger trend may be now down as the 200 day moving average has rolled over and is now pointing down. This also supports the main Elliott wave count.
Both the mid and short term averages are pointing down and price is below all three. The trend is down.
GDX DAILY CHART
Click chart to enlarge. Chart courtesy of StockCharts.com.
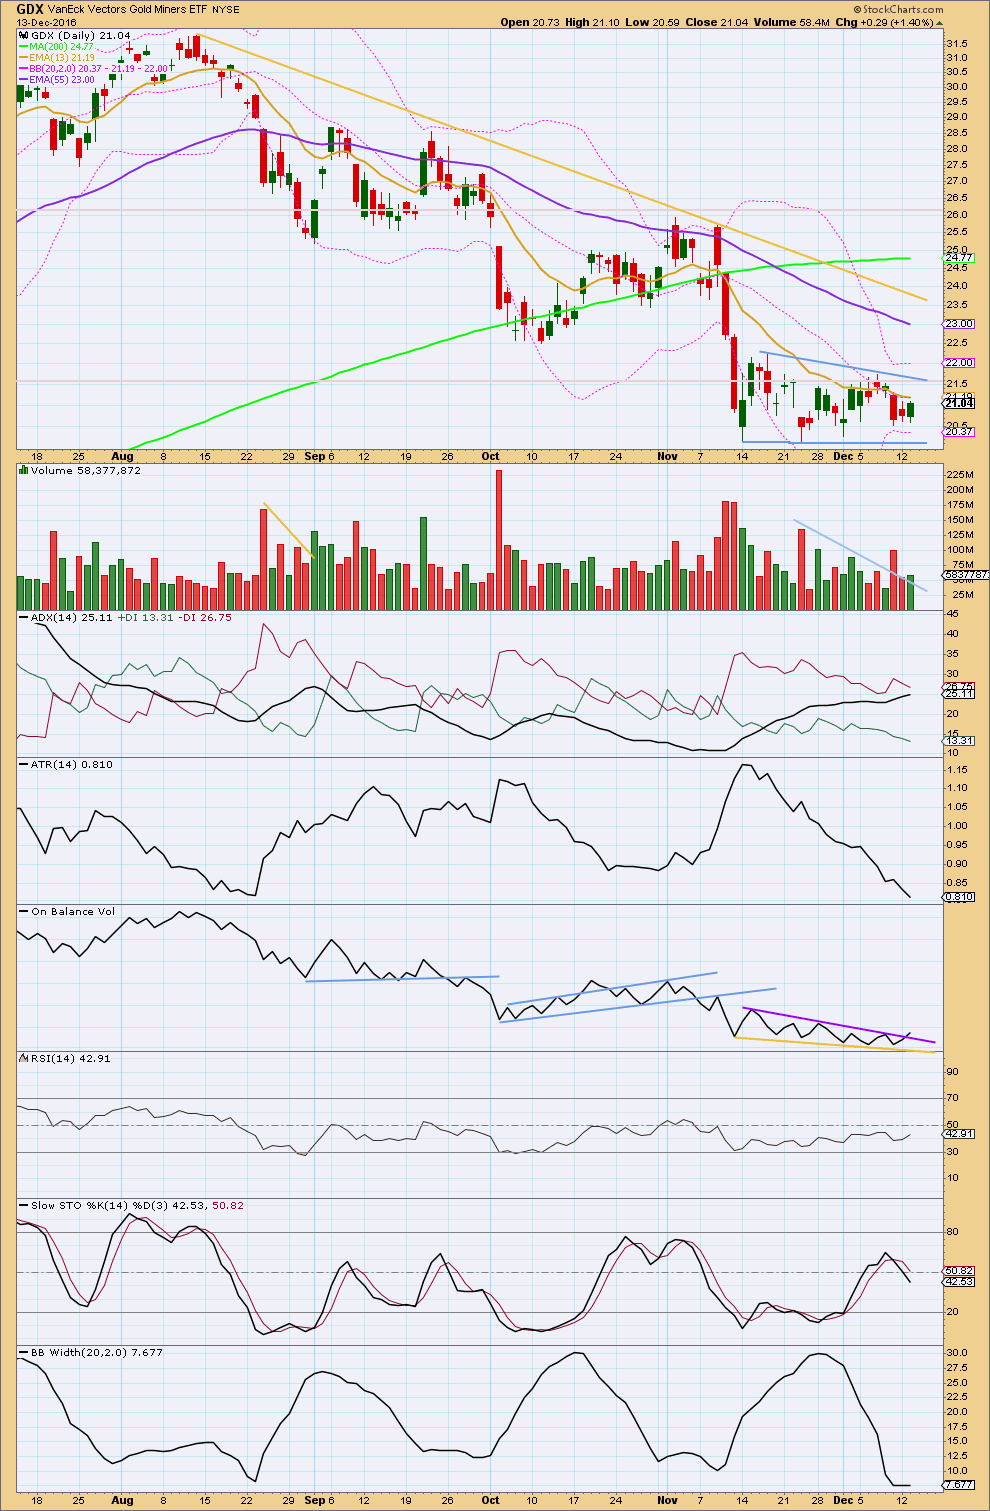
Price is moving essentially sideways and is range bound for GDX. Resistance is about 22.25 and support is about 20.15. During this range bound period, it is the downwards day of the 23rd of November that has strongest volume (ignoring the first day of the 14th of November) suggesting a downwards breakout may be more likely than upwards. This technique often works for Gold (not always). It remains to be seen how reliable it is for GDX.
Monday’s downwards session comes with a decline in volume, so the fall in price is not supported. Now Tuesday’s upwards session comes with a small increase in volume offering some small support for a rise in price.
ADX today has slightly increased again indicating a possible downwards trend still. ATR is clearly declining. Bollinger Bands are clearly contracting. Price is consolidating. This market is not currently trending. A bear flag pattern may be forming, delineated by blue trend lines. This is a continuation pattern. It is supported by declining volume.
Using the measure rule, a target of about 14.50 would be expected. First, to have confidence in this target, a downwards breakout needs to be seen below the lower blue trend line. If this is accompanied by a spike in volume, it would be given more weight. But note that for a downwards breakout stronger volume is not always necessary as the market may fall of its own weight.
On Balance Volume today may be breaking upwards above resistance at the purple trend line. This in conjunction with some small increase in volume for the session is a bullish indicator. Price may break out of the pattern upwards. This signal contradicts the implications of the flag pattern, which expects a downwards breakout.
Looking at how GDX has behaved with On Balance Volume trend lines recently (blue lines on OBV), it is noted that on the 27th of September a downwards breakout correctly predicted the next direction for price four and five days later, and on the 8th of November another downwards breakout by OBV correctly predicted the direction for price two days later.
However, on the 19th of October an upwards breakout did not necessarily correctly predict the next direction for price. Price did move higher to a new high on the 2nd of November, but this was still within a larger consolidation and the trend remained down.
In conclusion, this signal today from OBV for GDX is given some weight, but an upwards breakout from the flag pattern would still be required by price for reasonable confidence in an upwards breakout.
While the mid term trend is down and the short term trend is flat, the larger trend may still be up for GDX with the 200 day moving average still pointing upwards.
This analysis is published @ 09:05 p.m. EST.
[Note: Analysis is public today for promotional purposes. Member comments and discussion will remain private.]
I am a bit worried about the immediate bullish case owing to bearish engulfing candles in both Gold and Silver and bullish ones in several of their inverse indices. I was expecting a big move due to the intense BB compression and it is certainly starting to look that we have a break to the downside underway.
With the steep drop below 1151.96, the Hourly Main Count has been invalidated. If the Main Count is still valid, then Minute C got to be reworked. I suggest that Lara’s Minute B (at 1151.96) is actually minuette w of Minute B, with the high at 1165.18 as minuette x. Minuette y has to be 5 waves, targeting 1144.60 (Minute B = 1.618 * Minute A). Minute C will then target the 2.618 Fib, ending around 1200.
At this stage, the price movement may fit the Alternate Count better. This means price will hit a bottom after a further 4th and 5th wave (minuette 4 & minuette 5).
Or this.
I’ve finally found a solution for the wave down as a five.
Minute b is now 1.38 the length of minute a, right at the edge of normal. It can still move lower though.
After a strong movement for a price shock like this one price tends to reverse. The structure on the 5 minute chart for minuette (c) is now a complete five wave impulse, I’d expect the reversal imminently.
Lara. For the Alternate count, minuette 3 will also end at the same point as Minute B of the Main. I surmise that how high the rebound becomes will provide some clarity between the two. For the alternate count, this has to be shallow such that it should not enter into minuette 1 price territory (1172.10). For the Main, price ought to move higher.
A solution found… after the drop? That’s ironically funny! With a strong lack of confidence in the alternate, expectations of consolidation, tired bears, double divergence, Gold loses over 1.5%, GDX drops to 20.07, and it’s another big gain for the DUSTERS… currently at 13.6%.
Big moves in the US Dollar… at 102.19, USD/ JPY at 117.25 and the 10 year treasury at 2.55%.
Hard to envision a bounce in gold and if so, I would assume it would be short lived… in Syed’s camp.
If there’s something that you saw before this drop in price to herald it, any kind of technical indicator, then sharing that here before it happened would have been useful.
Having a go at me for getting it wrong… not so useful.
I can only make judgements on what I see.
IMO nothing much above 1165 now; anticipate a steady decline to 1123/1101…
Hi Dreamer ,
Lara gave us 2 counts but I could not accept the Bear count ( now the Main ) for reason also expressed by Allan . So there is a blind spot in GOLD , I tried to find out from YEN , which happens to move lock step with GOLD by the Hour , the last few weeks . I am trying to read GOLD’s moves from USDJPY . Lara will read the GOLD moves for us , and her charts will be my final arbiter . No concurrence , no go.
So far I’m waiting for USDJPY to drop to 114 ( GOLD bounces ) , and we are now at that point now , …….. then reverses Up to 118 ( GOLD falls ) , then drop deep into 111 ( GOLD bounces multi- week ) .
The USDJPY Daily count by EWI says the same but the drop is not to 111 , but another 10 % lower to 99 . A 10% drop in FX is considered a lot . The time taken to fall to 99 fits better with a fall in SP500 I am expecting . I mentioned drawing 2 trend lines (TL) in the SP500 from 1810 , for SP500 to fall from the top TL ( almost touching now ) to the bottom TL , which can form an Ending Diagonal or ED ( like a Rising Wedge ) or a parallel channel . From visualising now , I think 1810 is a Primary 4 , from “666”, the pit of the US SubPrime crash . So from 1810 Up wards it is Primary 5 , and it is tempting to see if P5 will end everything in an ED .
Back to USDJPY’s fall to either 111 or 99 , the SP 500 fall will be from say sub 3 to 4 of P5 . The fall in SP500 will cause a fall in NIKKEI , starts the YEN carry trade unwind , makes the weak YEN even stronger than the mighthy USD . This is necessary for GOLD to really rally hard the last leg, from Lara ‘s (X) or 2 , of the Alternate count .
Your question , it is still possible if USDJPY falls to only 111 .
Whatever it is , it is tradeable if it just get there .
When we get a decent bounce , we will rely on Lara’s GOLD chart again to tell us more details
Whatever we say now , the FED ‘s annoucement of the 2017 ‘s rate hike Plan will change the expectation if it causes Spikes . For example , while waiting for USDJPY 114 to end , the Volatility can just spike upwards and then get 118 done in a second ! Then we will say that GOLD has already bottomed at Lara’s (X) or 2 !
Can’t say that won’t happen , I saw it in BrExit and Trump’s victory . A few expected turns moves just becomes the Spike .
Lara will surly know whether your chart qualifies , whether allowable , allowable but rare , not allowable .
Thank you Dreamer for giving us the GDX charts . Really appreciates your effort .
Oop ! 114 is considered done , it is spiking Up towards target 118 and GOLD falls . We see how high USDJPY bounces , expecting it to reverse for GOLD to rally next , or ……… !
Regards ,
Raymond
Silver has built a nice bottom base in 4 hour period with neckline at 17.23. It needs to break out of this base with full 4 hour candle above and not touching to declare a valid BO.
Lara,
I know that you have often found EW rule violations with CaptainEwave counts, but his updated count for Gold may offer a “fresh” look at the move down from the top. Looking at the move down as a simple ABC may be a great option for the BULL count.
As you know from my recent failed attempts, I have been looking for other BULL options without going down to near 1,100 as I think that is too much of a breach of the support cluster that exists around the 1,150 level. This looks like it could be a valid option. Thoughts?
Raymond, this may be more in line with your thoughts also based on some of your recent comments.
Oh yes, that works. A larger zigzag down. Then the triangle can fit, and I’d rather see a triangle there.
I think this works better than the double zigzag I’ve been working with for the alternate.
COT USD :
https://www.wellenreiter-invest.de/cot-daten/us-dollar-index
Hi , Lara and fellow members ,
The above link is the latest ( last weekend ) weekly USD COT report in graphic form . I don’t have a USDJPY COT , so the USD will do here .
Red : Large Speculators , say Hedge Funds , dumb money .
Blue : Commercial , smart money .
Green : Retailers , ignore , small volume , usually follows red .
Gray : Price , read right scale , say now at below 102 for the USD index.
Red and Blue are at mirror image about the 0- line . So one Buys , the other Sells .
Essentially it is like a game between these two at the table with blue as the banker.
The red Hedge Funds are price followers , making money during trending , till the blue Commercials trigger a Reversal , and take their money . Note how red follows gray .
The last time the blue was this short ( left scale , at -60000 contracts ) was in DEC 2015 , they triggered a reversal , causing the red to sell ( red drops ) , they , buy ( blue rises ) . Note the red falls with the gray Price , being price followers . GOLD rallied , we enjoyed that run . Now , blue is at the same level . Will they trigger a Reversal taking advantage of the FED ‘s announcement . Briese knows how to read the trigger point , I don’t . So I have to wait till it has happened .
Also note another reversal on June/ July . That is when GOLD pulled back , till now . GOLD and USD are still inversely correlated .
Scroll down below for COT for other popular assets . Erdol is OIL .
On GOLD , I will bet on Lara’s Alternative ( former Bullish ) , I think it is the correct one after checking USDJPY , SP500 , etc . Her (X) or (2) is very closed , especially if the FED’s announcement in the new few hours causes Spikes that will short- circuit patttern moves and time in just a second what will normally take hours and days .
Kind Regards , best of luck to those trading .
I thank Lara again for building and leading this site .
Even tho bleeding now , I know I will make money with her mastery of the EW .
She is really that good , after reading so many EW charts by so many Elliotticians for so many years .
Raymond .
Thanks Raymond. I just checked the Japanese yen cots, added 30k plus on the commercials on the bullish side. The dollar has about 70k shorted, 10 k long. There does seem to be quite a play on dollar weakness by the commercials
Often during a change of direction there is a whipsaw to stop out long stops, so wouldn’t surprise me if that happens tomorrow for gold. If the fed raises too quickly markets will drop. The Europeans already showed there cards, they stand by to make the euro weaker (commercials long euro as well). If the market drops, gold will benefit from a weaker dollar. The fed is in a quandary since raising rates will make American exports more expensive with a stronger dollar, going the opposite direction of most currencies.
http://www.cftc.gov/dea/futures/deacmesf.htm
http://news.goldseek.com/COT/1481315527.php
Still waiting for a breakout. It may come with Wednesday’s 2PM EST Fed announcement. All 3 paths shown are still possible.
Thank you very much for reliably posting your GDX charts Dreamer. I know many members appreciate it, and I do too 🙂
Dreamer,
Can we buy you a drink as you begin re-working the GDX chart due to price invalidation.
Coffee or Scotch? Should you provide your address, you may receive cases as opposed to bottles.
Thanks for your work, Dreamer!
As you re-work the GDX chart due to price invalidating Minuette 2 and other points, would you prefer coffee or Scotch.
Thanks Stephen, good to see that you are getting into the holiday spirit! PRICE has spoken… I hope longs with a short term trading strategy were able to exit their trade when price failed to exceed the upper triangle trend line!
The BULL isn’t dead yet, but it’s certainly on life support!
If you choose Scotch, might I recommend Dewars white label? 🙂 🙂 🙂