
Again, upwards movement was expected to complete a small consolidation before price fell further.
The consolidation was already complete and price has made a new low.
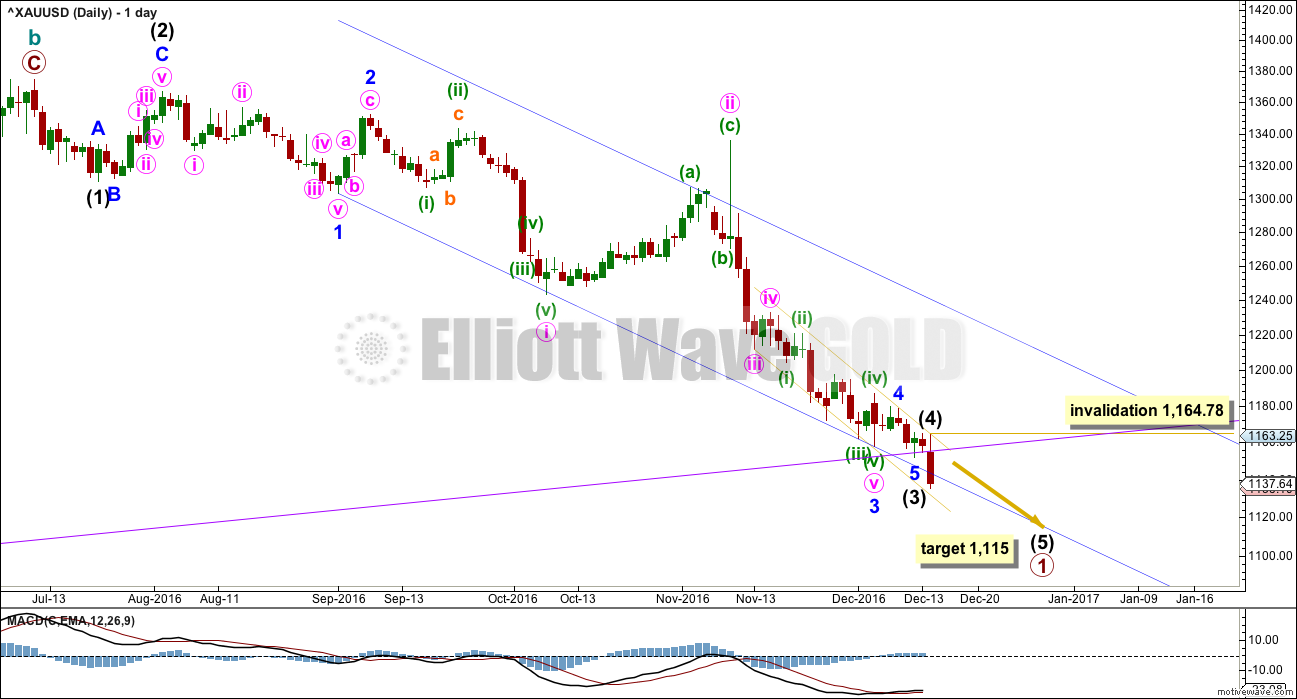
Summary: The target for downwards movement to be interrupted is at 1,115. A break above the yellow best fit channel and then above 1,164.78 would indicate either a trend change or a consolidation has arrived.
New updates to this analysis are in bold.
Last monthly and weekly analysis is here, video is here.
Grand SuperCycle analysis is here.
DAILY ELLIOTT WAVE COUNT
Click chart to enlarge.
Primary wave 1 may be close to completion. With today’s strong downwards movement to new lows, the structure within primary wave 1 is reanalysed today for this main wave count.
Corrections are more brief and shallow than expected.
The purple trend line is copied over from weekly charts. Downwards movement for this session has now broken below this important support line, so this line may now provide resistance forcing upcoming corrections to be shallow.
There is no Fibonacci ratio between intermediate waves (1) and (3). At 1,115 intermediate wave (5) would reach equality in length with intermediate wave (1).
Ratios within intermediate wave (3) are: there is no Fibonacci ratio between minor waves 3 and 1, and minor wave 5 is 1.92 longer than 0.382 the length of minor wave 1.
Ratios within minor wave 3 are: there is no Fibonacci ratio between minute waves i and iii, and minute wave v is 2.52 short of 0.618 the length of minute wave iii.
Ratios within minute wave v are: there is no Fibonacci ratio between minuette waves (i) and (iii), and minuette wave (v) is 0.62 longer than equality in length with minuette wave (i).
Within intermediate wave (5), no second wave correction may move beyond the start of its first wave above 1,164.78.
This wave count still has a problem of proportion between minute wave ii and minor wave 2 and intermediate wave (2). Minute wave ii should be more brief than second wave corrections one and two degrees higher, and a triangle may not be seen for a second wave in this position because second waves may not subdivide as triangles.
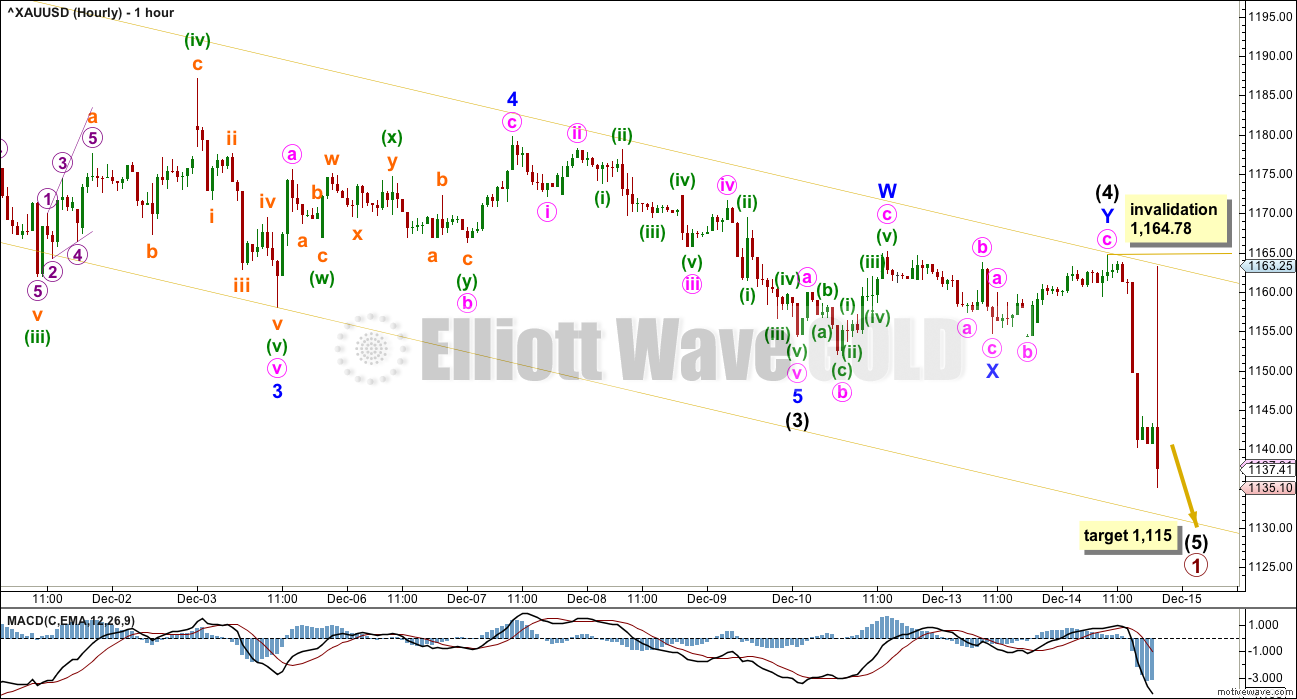
HOURLY ELLIOTT WAVE COUNT
Click chart to enlarge.
The spike on the last hourly candlestick is not seen on any other data feed so far, so it may disappear tomorrow. This sometimes happens with BarChart data. If it remains, then it will be labelled as the first second wave correction within intermediate wave (5).
Intermediate wave (4) fits as a double flat correction lasting three days. This is quicker than the eight days for intermediate wave (2). Often Gold’s fourth waves are surprisingly quick and shallow, and this looks like what has happened here.
Within intermediate wave (5), no second wave correction may make a new high above its start at 1,164.78.
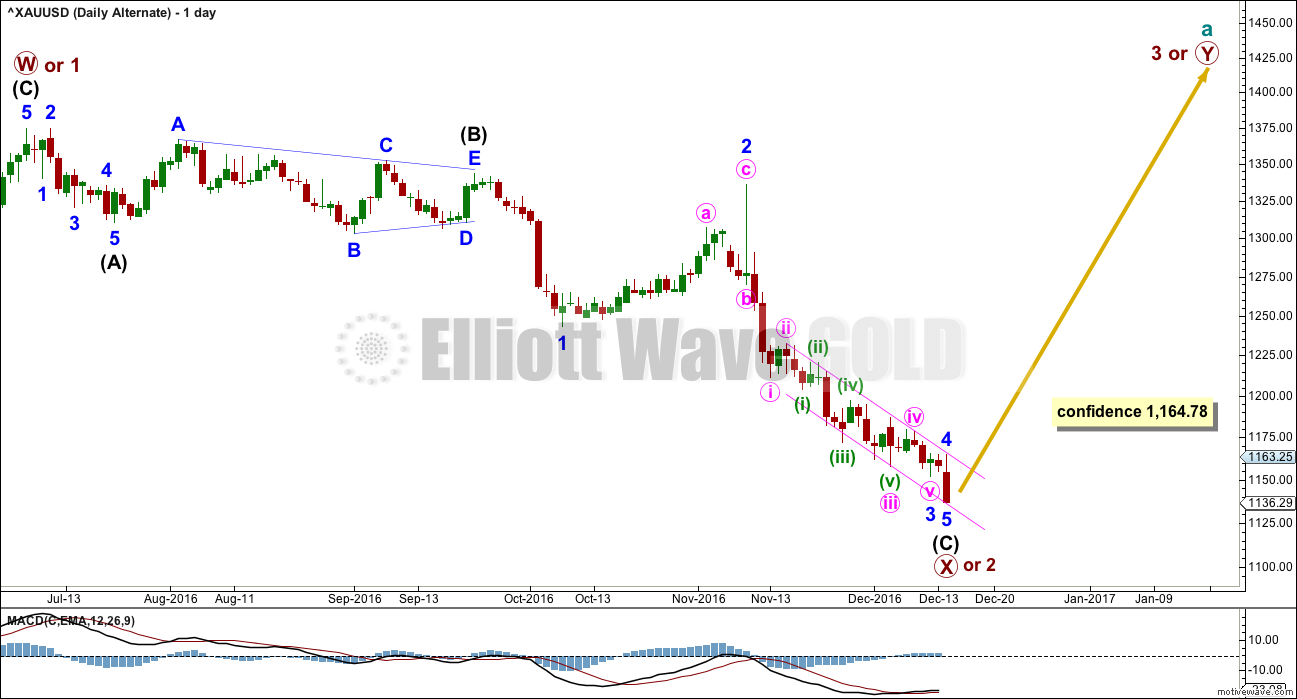
ALTERNATE DAILY ELLIOTT WAVE COUNT
Click chart to enlarge.
Downwards movement for primary wave X or 2 fits as a single zigzag, which may possibly be complete. However, this wave count requires some upwards movement from price to break above 1,164.78 before any confidence may be had in a trend change at primary degree.
Within downwards movement, this wave count sees a triangle labelled intermediate wave (B). This has a better fit than trying to see this as first and second waves (a second wave may not subdivide as a triangle). This wave count does not suffer from the problems of proportion that the main wave count does.
Primary wave X or 2 is now a 0.73 correction of primary wave W or 1. This is now a very deep correction.
Initial confidence in a trend change may come with a breach of the upper edge of the small pink channel.
There is no Fibonacci ratio between intermediate waves (A) and (C).
Ratios within intermediate wave (C) are: minor wave 3 has no Fibonacci ratio to minor wave 1, and minor wave 5 is 1.55 longer than 0.146 the length of minor wave 3.
Ratios within minute wave iii are: there is no Fibonacci ratio between minuette waves (i) and (iii), and minuette wave (v) is 0.62 longer than equality in length with minuette wave (i) (this piece of movement is seen in the same way as the main wave count; for the main wave count it is a fifth wave and here it is a third wave).
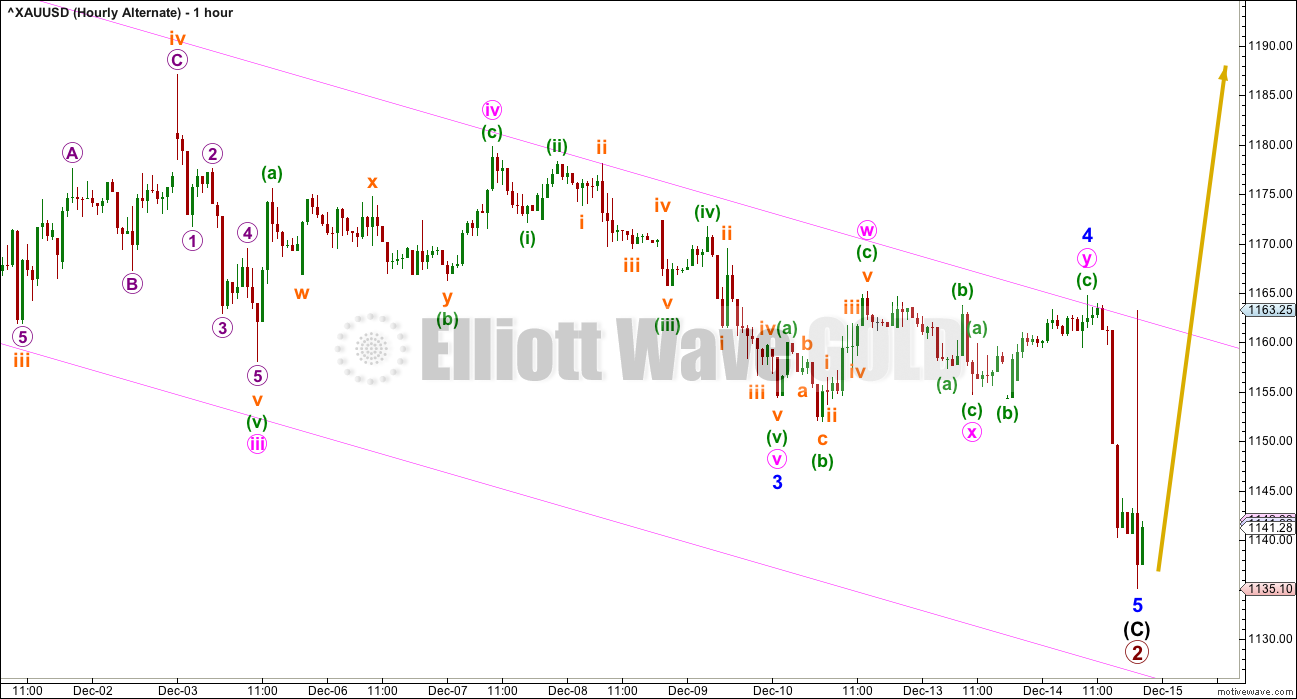
ALTERNATE HOURLY ELLIOTT WAVE COUNT
Click chart to enlarge.
Price may continue downwards while it remains within the pink best fit channel.
Subdivisions of the last piece of movement are seen in the same way for both wave counts.
It is possible that for both wave counts downwards movement is over. This alternate expects a trend change where the main wave count expects a consolidation.
TECHNICAL ANALYSIS
WEEKLY CHART

Click chart to enlarge. Chart courtesy of StockCharts.com.
Price is falling as volume is declining. The fall in price is not supported by volume. Price is falling of its own weight, and it can continue to do this for some time. But for a healthy sustainable trend volume should be supporting the movement and that is not the case here.
There is no support line here or close by for On Balance Volume.
RSI is not yet extreme. There is still a little room for price to fall further.
DAILY CHART
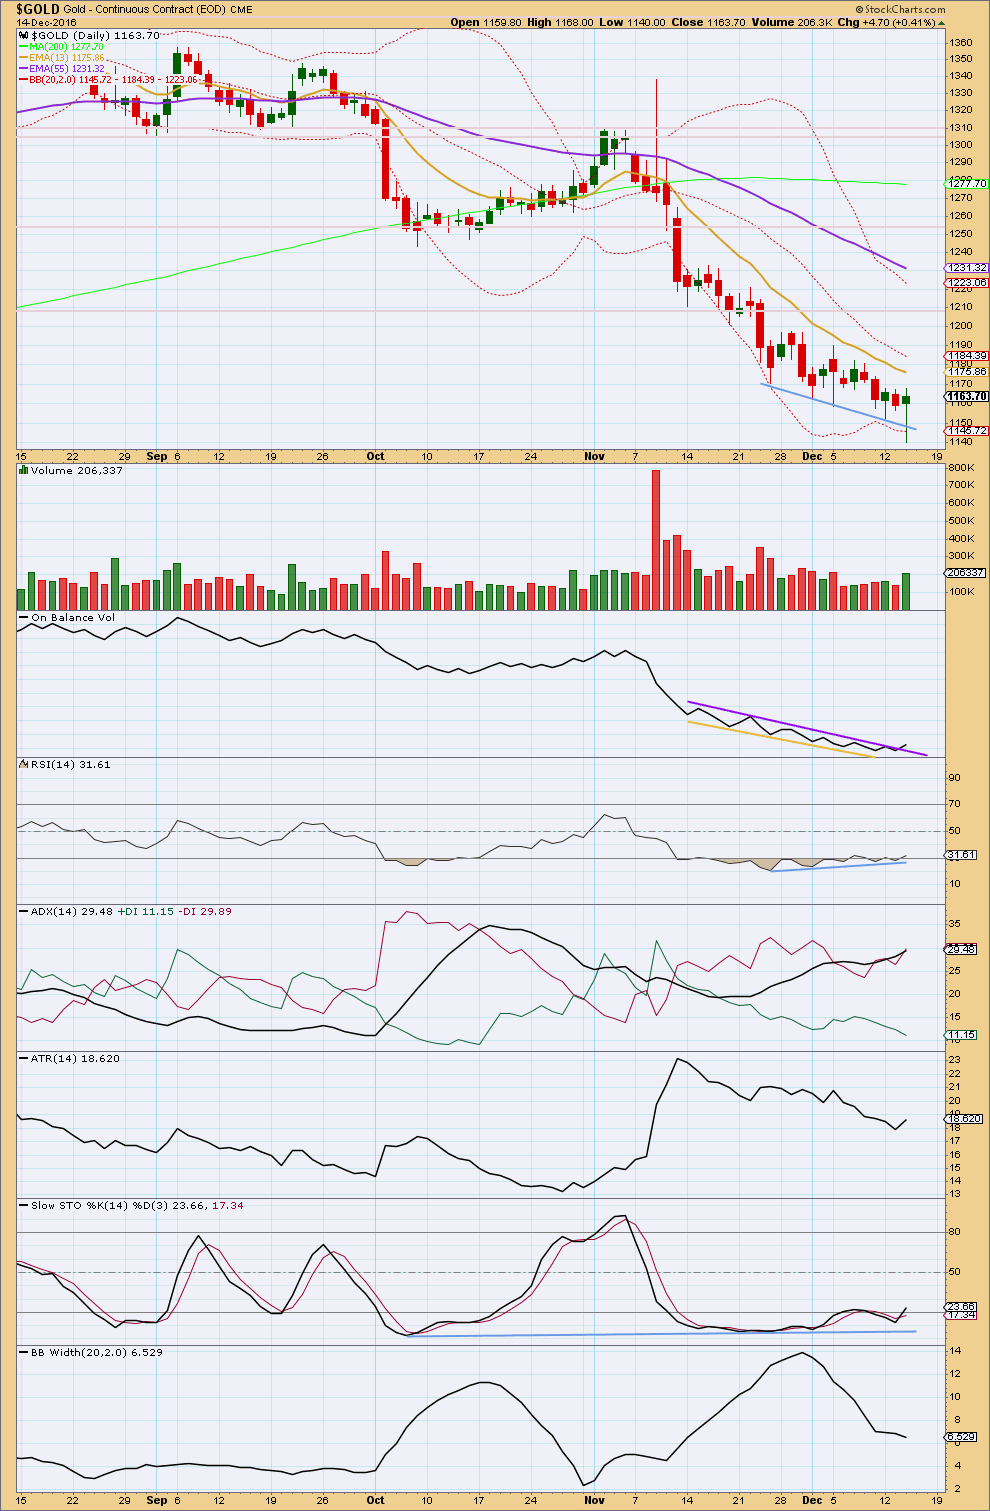
Click chart to enlarge. Chart courtesy of StockCharts.com.
A new low today comes with yet further divergence from RSI.
On balance, volume today was upwards and it shows some increase, and the long lower wick of this daily candlestick is bullish. The rise in price during the session was supported by volume.
On Balance Volume may be beginning to break above resistance. Because there is some leeway in how this trend line is drawn, a clearer break would be required for confidence in this signal. If this break becomes clearer tomorrow, then it would be a reasonable bullish signal. That would support either the alternate Elliott wave count or the main Elliott wave count in seeing primary wave 2 beginning.
ADX is still increasing, indicating a downwards trend, but it is not yet extreme.
ATR is still overall in disagreement; it is overall declining. Bollinger Bands are still contracting. This trend still looks tired.
Stochastics now has clearer double divergence with price at lows while it was extreme.
GDX DAILY CHART
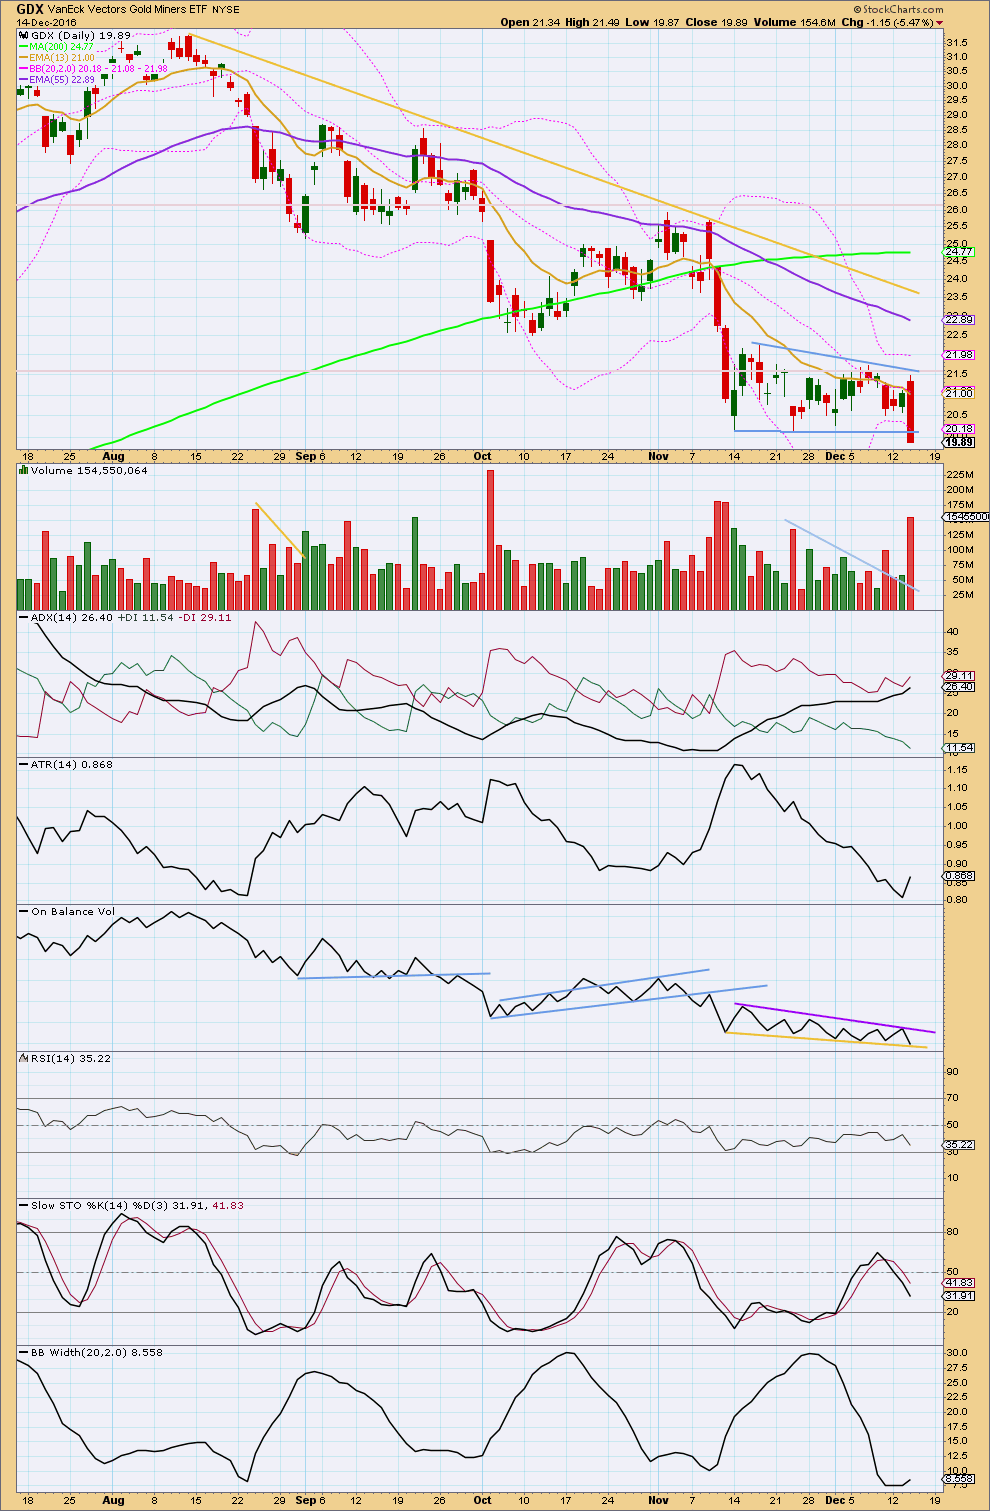
Click chart to enlarge. Chart courtesy of StockCharts.com.
GDX today has broken below support at 20.15 on a downwards day with an increase in volume. This is very bearish.
Using the measure rule, a target about 14.50 is expected.
ADX indicates a downwards trend is in place.
ATR shows some increase today. The trend may be beginning again after consolidation within the bear flag pattern.
Bollinger Bands may be beginning to show some increase.
On Balance Volume has still not broken below support. If it can break below the yellow trend line, then more confidence may be had in the target being met. A break above resistance would be a bullish signal. The purple resistance line is today slightly adjusted to sit along the last high.
This analysis is published @ 08:58 p.m. EST.
Hi ,
Refer to my last email .
Lara taught us that a (iv) Pullback is best kept within level (i) .
So the USDJPY’s pullback may only be to 116 , where (i) is located,
not as deep as 114 . It means the GOLD bounce will be shorter in duration .
Sorry about that .
The main point remains , from correlation check , GOLD has not bottomed yet .
Lara ‘s GOLD count will catch it .
Regards ,
Raymond
.
That large spike that appeared in BarChart data yesterday is still there today. Now I know this is not found in other data feeds, but it is in the one I’m using. So it’s part of the wave count.
It fits nicely as a second wave correction.
I’m leaving the invalidation point up at the start of minor 3 to allow for the possibility that it may extend further, that the degree of labelling within minor 3 may need to be moved down one degree, this may be only minute i or minor 3. If that’s the case then the target would be inadequate.
Minor 3 if it’s over there has no Fibonacci ratio to minor 1.
Minor 4 may not move into minor 1 price territory above 1,135.10. As long as the small correction currently underway does not move above that price point then the degree of labelling here will be correct. If price makes a new high above 1,135.10 then I’ll move the degree within minor 3 down, and the target would need to be recalculated.
Now that price has broken below the lower edge of the yellow best fit channel it’s finding resistance there.
This trend is still not quite over. Indicators are extreme and there are signs of weakness with multiple divergence with RSI, that tells us the trend is nearing its end but obviously as has been proven over this last week it is not able to pinpoint the turning point.
Hi ,
A quick note from my observation , so that you will consider seriously that GOLD may not have bottomed yet , despite the bounce I see now, and you may see later .
a) USD : The USD Daily may have completed 3 and starting a Pullback to 4 .The USD hit all the FX , not just GOLD a few hours ago , another flush- out day .
b ) USDJPY : EWI has a (iii) expected on its 2- Hourly chart , and I think it is done . So a Pulllback to (iv) is the next move
c) SP500: is still on its Pullback to (iv) on its Daily chart
Now , are all these going to sync ? ……. very roughly . It is only GOLD and USDJPY that are tied together as mirror image .
IF the USD pulls back to its previous Four at 99 + , then that may take a week or more ? . This is only an assumption . The USDJPY may then pullback to say 114 .
So GOLD may bounce for a week or more , but likely not from from its bottom yet ..
There will be another hit when USDJPY resumes its final move to (v) . This is the only thing I’m sure .
All risky guess work . IF things change drastically after I switched off , all these mean nothing .
I will look at Lara’s GOLD chart later when it is published .
Regards ,
Raymond .
Hi Verne ,
I have the USD Daily chart in front of me . It is mirror image of the EURO .
Yesterday and today green candles in the USD is the (iii) of 5 Up .
The 4 low was at 99.40 . So there is (iv) Down and (v) Up yet to come , to complete 5
The old target of USD is at 105 , now just about 103.20 . Of course this target is just indicative .
I held EUO ( doubled short EURO ) for years to Buy USD and prepared for EURO to test Parity . But this is long term play .
Best of luck to you .
Raymond
I was taking a short nap for the past week…anything new going on with GOLD?!?!
Oh, I see Janet Yellen opened her mouth again and the sheeple of the world have reacted!
Does EW have a wave count for when she speaks?
LOL!!!!!!!
I am looking long and hard at that Euro candle below the BB and I do wonder. One of the few candle reversal patterns that has still be working reasonably well is the hammer at the end of a long down-trend. We have one in the Euro today. If the dollar still has another wave up we could get some divergence with the Euro as the dollar makes a new high and the Euro makes a higher low.
Do you mean at the daily chart level Verne?
So far it’s not a hammer. It may have been when you made your comment, but the real body is too large now. The lower shadow has to be at least twice the height of the real body.
Yep. I did morph I’m afraid. I should have waited for the close. Hopefully the long lower wick is indeed bullish. I will wait to see what develops tomorrow before I nibble on the long side. UUP also cavorting well above its upper BB today.
There you have it! This kind of upper BB cavorting is as frisky as it gets. I expected it to stay pinned for a day or two but instead we got a moon shot. Second close back below should be a wrap. I say SHOULD, because I have been seeing repeated violations of reversion to the mean after this kind of extreme price action in lots of charts that simply refuse to do so.
Hi Verne ,
Take a look at the link I posted on the NUGT and DUST spread . Note that the 2 lines cannot cross .
All the best ,
Raymond .
Thanks Raymond! I’ll take a peek!
When did you post It? I don’t see it on this thread.
Sorry I can´t see the link or post mentioned… Can you support?
It may have been in a comment that was in moderation because it had more than one link.
It’s released now.
All righty then! I did take a look at that interesting DUST/NUGT chart. The contention that they cannot cross may be forgetting a little detail, namely, the infamous reverse split! That little subterfuge would I am afraid permit NUGT to “fall” substantially farther…
Hi ,
Last week , Dreamer posted a YEN ( $FXY ) multi- year chart superimposed with GOLD to show that GOLD and YEN ( JPYUSD ) move together . I have been watching their Hourly lockstep moves for a few weeks and realize that GOLD has no chance unless YEN strengthens . YEN measures the USD as well as the yield differential between Japan and the US , really a one – sided contest . But YEN is still considered a safe haven ?!?! The YEN carry trade unwind is a very strong market force .
Check this Monthly chart and note that GOLD needs multi- months to rally out of its bear trend now : 1375 first , ……. then 1500 !
http://www.traderplanet.com/articles/view/170484-watch-for-a-bounce-in-the-yen/
A monthly impulsive [c] wave coming ?
A 15 – 20 % YEN rally move is big deal . Some market stress is coming .
That’s EW saying from the person who counts it and it looks simple and correct .
Rally from DEC to MAY next year , like the last GOLD rally ?
Well- covered by Lara’a Alternate, the old- Bull count resurrects !
Cheer up , guys !
Regards ,
Raymond .
Can gold turn here???
Past history of gold may be clue here???
In 1999 gold turn bullish going up by 28%. Then retraced back 15%,
Current 2016 gold action may be similar to 1999 to 2000.
Gold up from low of 1045 to 1377 almost 31%. Now correcting around 18.4%.
It appears as gold moves up in bull trend that started in 1970 the corrections are expected to be higher and higher.
Gold may be near completing its correction soon. What will follow is Lara’s alt wave move to or above 1400.
Exiting my short NUGT positions. I am also taking the money and run on my short Euro trade as it has plunged beneath the lower BB this morning. Of course things could remain extreme or become even more so but that is quite hard to imagine.
Hi Lara and fellow members ,
Here are some more evidence to support that last nite GDX sell-off maybe the final flush – out .
The Bollinger Band of GDX in constricting and will expand for a big move . Which way ? This suggests Upwards : The NUGT and DUST spread is throating , and will expand : http://stockcharts.com/h-sc/ui?s=GDX&p=D&yr=0&mn=6&dy=0&id=p76449990515
The % Bullishness has not dropped to new Low : http://stockcharts.com/h-sc/ui?s=%24BPGDM&p=D&yr=1&mn=6&dy=0&id=p01411147165
The GS ratio (red ) is pointing Down, a positive sign for the previous metals family . The black overlay is GOLD. The same can be said of the GDX : GOLD ratio : http://stockcharts.com/h-sc/ui?s=GLD%3ASLV&p=D&yr=5&mn=0&dy=0&id=p10615265769
The free week chart of USDJPY Hourly has reached the last Hourly move Up . I think EWI will be calling for a major reversal any hour today , US time . I agree, up to a point .
I have a more cautious stand for later , when USDJPY has dropped to the 111 level . For now till then , it is a trading Buy coming for me too . But not yet , till I see your chart .
IF at USDJPY 111 , the USDJPY does not start another rally ( Gold falls again ),
then it will be a longer term holding Buy , which is more important to me . Your Alternate ( previous Bull) count will have won , as far as I am concerned . I have always believe this is the correct count , but will respect your Main ( Bearish ) count at the background , till the test at USDJPY at 111 later . Or some other tests like SP500 .
Last nite Pullback in SP500 was a (iii) to (iv), Daily chart . The next rally will be a (v) , cutting an upper resistance trendline . Based on the Count I’m following , (v) will be a 3 ( from 1810 ) . It should pullback by 80 to 100 points to a 4 , at its lower TL of a parallel channel or an Ending Diagonal . This magnitude of drop should be multi- months , enough for GOLD to try 1375 . Until this as final proof , I will still follow your Alternate Count , looking for your ” (X) or 2 ” to stay secured .
We just have to do our own due diligence during critcal turns and trade what we believe . No blame game then .
Many thanks Lara , for being so cool throughout the sell- off .
Many sites don’t even have Alternative count , no pre- charting after the Close , no invalidation line ( you pioneered this , I believe ! ) . Maybe GOLD is not trying enough for you . You were once an FX trader ?
Great work , Lara !
Regards ,
Raymond
I still trade, mostly FX. But now also Gold and S&P500 because I spend so much time analysing them.
Open interest on the CFTC is now down to close to where it was last
December. From trade stocks and commodities with the insiders, pg. 83 “More market bottoms and excellent buy points have been formed when open interest is low than at any other time.”…Larry Williams.
The commercials are definitely not a science for capturing turns precisely, but in conjunction with other tools they can be a important input for making decisions for the medium term.
Above chart from jack chan published on gold-eagle website.
http://www.gold-eagle.com/article/gold-price-and-silver-price-updates-64
You can also get the chart here every Friday afternoon
http://snalaska.com/cot/current/charts/GC.png
Thanks, there is also one on goldseek.com released at 3:30 on Friday. It includes the silver, gold and dollar COTs, along with options added.
Here’s an updated look at the GDX Bollinger Bands.
One other thought:
Last year in December, the Fed raised rates for the first time in years and what happened? Gold and GDX went up for 6 months.
It may happen again, so we still need to be cautious, but open to the bullish possibilities
For both wave counts an end to this wave down will be expected sooner rather than later. Targets will be slightly different; 1,115 for the main and now 1,064 for the alternate.
But thereafter they’ll both expect a big move up. The main for a second wave correction and the alternate a new bull market.
Here’s the revised GDX hourly BULL count
Wow, what an exciting day! As gold moved down, GDX looks like it broke downwards from the triangle option that I had shown.
Important support has been overshot, so the BULL is on life support. That said, I still think the bull has a chance if it reverses upward within the next few days. It’s important that we don’t get a full weekly candle below support.
If you look back at Lara’s last GDX analysis on November 14th, the BEAR count is still intact. The BULL count now needs a rework.
Showing my reworked BULL count here for Lara and others to review. I still think it has a reasonable chance at proving itself, although I will be watching closely for any breakdown. When a triangle is in the 4th wave position, the following 5th wave is often fast and shallow.
Revised Daily GDX count
Hey, that looks really good Dreamer 🙂
I like the fourth wave triangle there, it fits very neatly. If that’s the case it should be almost all over for GDX.
However, classic TA for GDX is looking very bearish so that should be the highest probability count.
Yes indeed. DUST printed a monster bullish engulfing candle and penetrated its upper BB. With all the extremes on display in so many charts lately, I would not be surprised to see it pinned there for a few more sessions.