
A small inside day fits the preferred expectations for Gold, but all Elliott wave counts still remain valid. Targets remain the same.
Summary: It still looks like another new low may unfold before Gold either turns or begins a time consuming consolidation. The target is either 1,116 – 1,114 or now more likely about 1,075.
New updates to this analysis are in bold.
Last monthly and weekly analysis is here, video is here.
Grand SuperCycle analysis is here.
MAIN ELLIOTT WAVE COUNT
FIRST DAILY CHART
Click chart to enlarge.
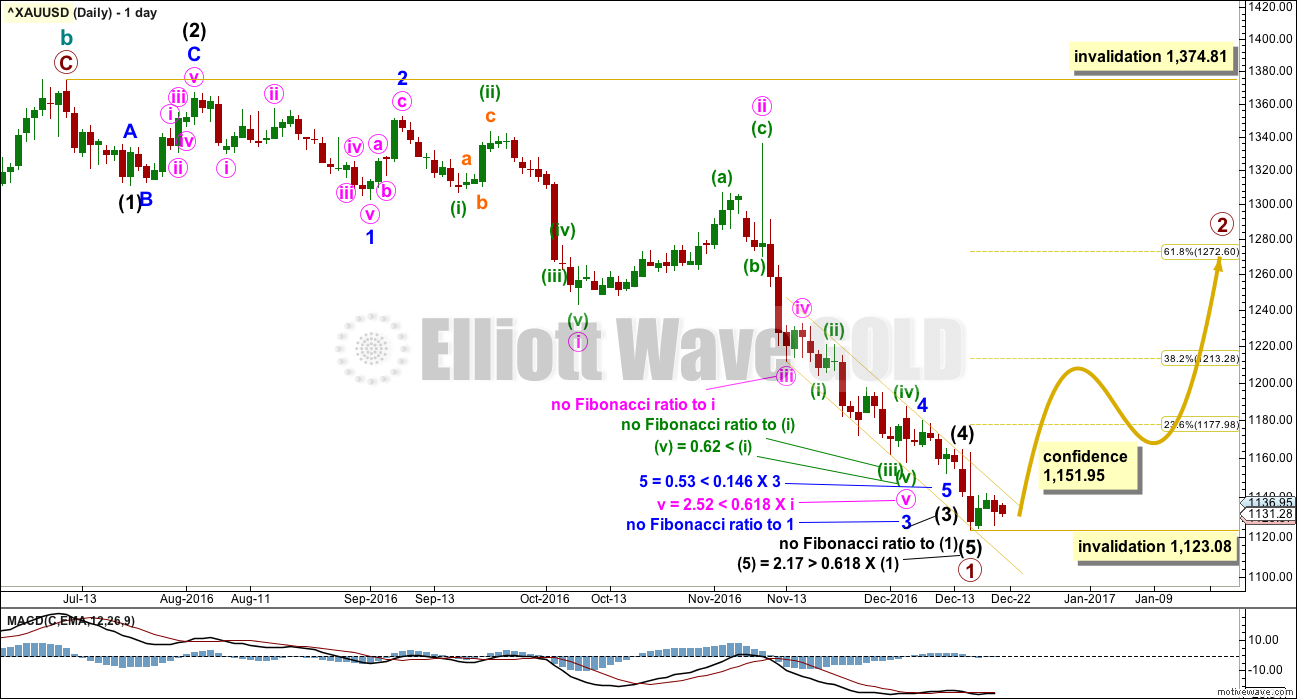
With the many corrections along the way down since the 14th of November, there are multiple ways to see this downwards movement. Both this main Elliott wave count and the alternate below will look at two different ways to see this movement.
For this main wave count, the first way to see this downwards movement is how it has been labelled as it unfolded. Within this wave down, minuette wave (iii) within minute wave v within minor wave 3 within intermediate wave (3) has a three wave look to it, but on the hourly chart fits well as a five.
Fibonacci ratios are noted on both this daily chart and the second daily chart below. There is not enough of a substantial difference in Fibonacci ratios between the two wave counts to increase or decrease the probability of one over the other.
This wave count still has a problem of proportion between minute wave ii and minor wave 2 and intermediate wave (2). Minute wave ii should be more brief than second wave corrections one and two degrees higher, and a triangle may not be seen for a second wave in this position because second waves may not subdivide as triangles.
If this wave count is correct, then there may have been a large trend change at the end of last week. Primary wave 2 may have begun. It should last several weeks and may not move beyond the start of primary wave 1 above 1,374.81.
Primary wave 2 would most likely end about the 0.618 Fibonacci ratio of primary wave 1 at 1,273.
HOURLY CHART
Click chart to enlarge.
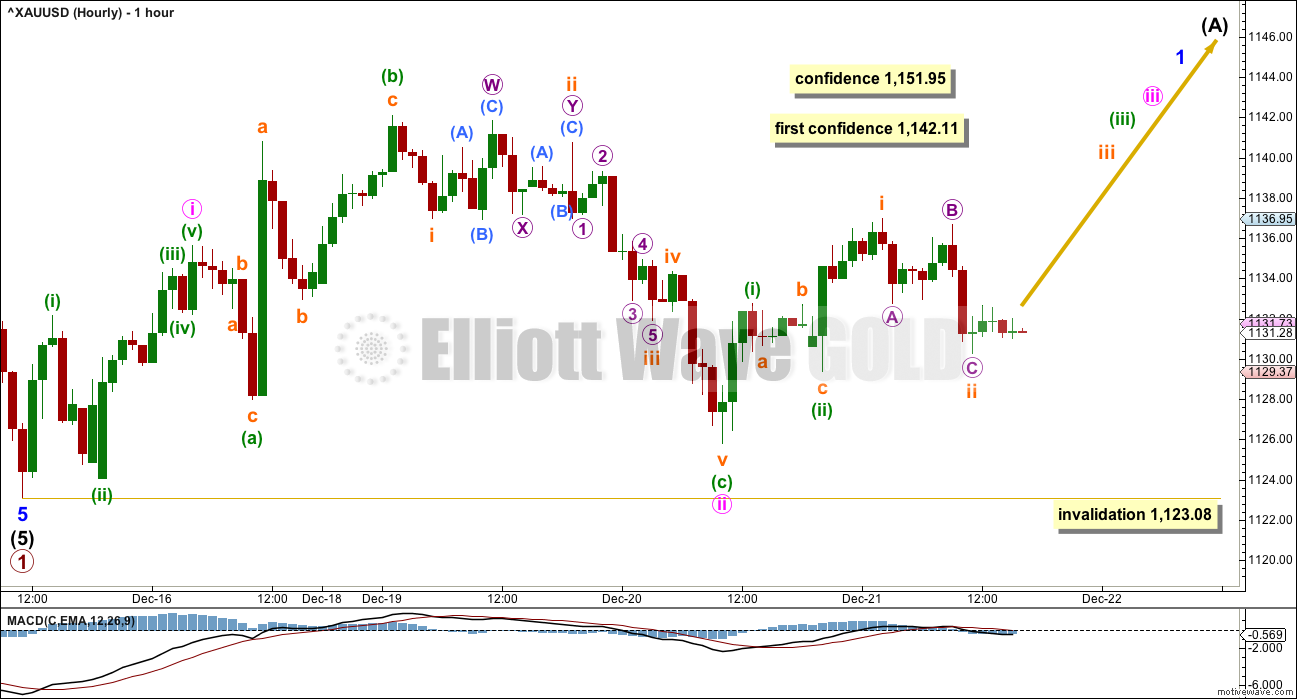
If a new trend upwards at primary degree has begun, then it should begin with a five up at the daily chart level. So far, at the hourly chart level, this wave count looks forced.
Minute wave i is seen as a five wave impulse. Within minute wave i, minuette wave (iii) looks like a three and not a five. This is sometimes acceptable when fifth waves within impulses extend as they force the fourth wave, which comes just before, to be more brief than their counterpart second waves giving the whole impulse a three wave look because the second wave correction is much more time consuming than the fourth wave. At the five minute chart level, this may have been what happened in this instance. However, it does look like the wave up from the low labelled minuette wave (ii) to the high labelled minute wave i should be seen as one complete five wave impulse and not two as necessary for this wave count.
Minute wave ii may be now complete as an expanded flat correction. Within minute wave ii, minuette wave (b) is a 1.85 length of minuette wave (a). This is longer than the common range of up to 1.38 but within the allowable convention of up to 2.
Minuette wave (c) has no Fibonacci ratio to minuette wave (a).
A new high now above 1,142.11 would provide a little confidence in a trend change. A breach of the best fit yellow channel, drawn the same way on all charts, would provide reasonable confidence. Finally, a new high above 1,151.85 would provide further confidence in a trend change.
This wave count now sees three overlapping first and second waves upwards. If a low is in place for Gold, then it should be beginning to move upwards more strongly. The fact that price is not behaving as expected for this wave count today must reduce its probability.
SECOND DAILY CHART
Click chart to enlarge.
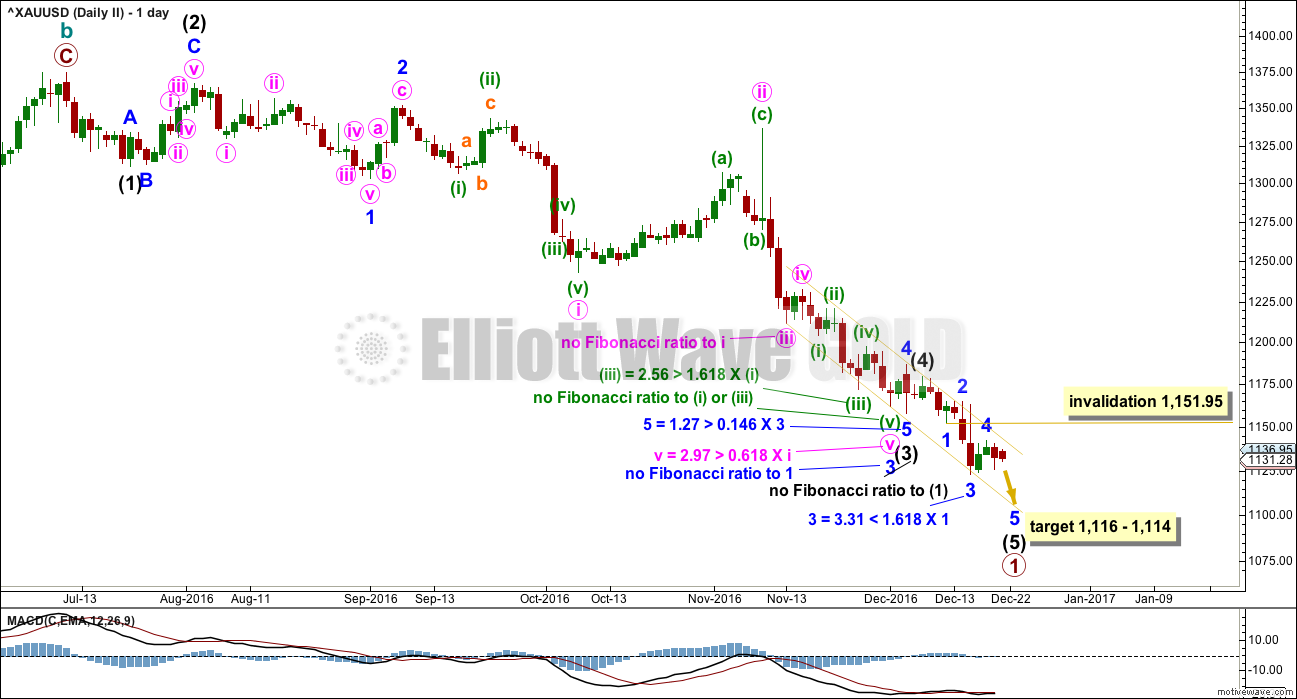
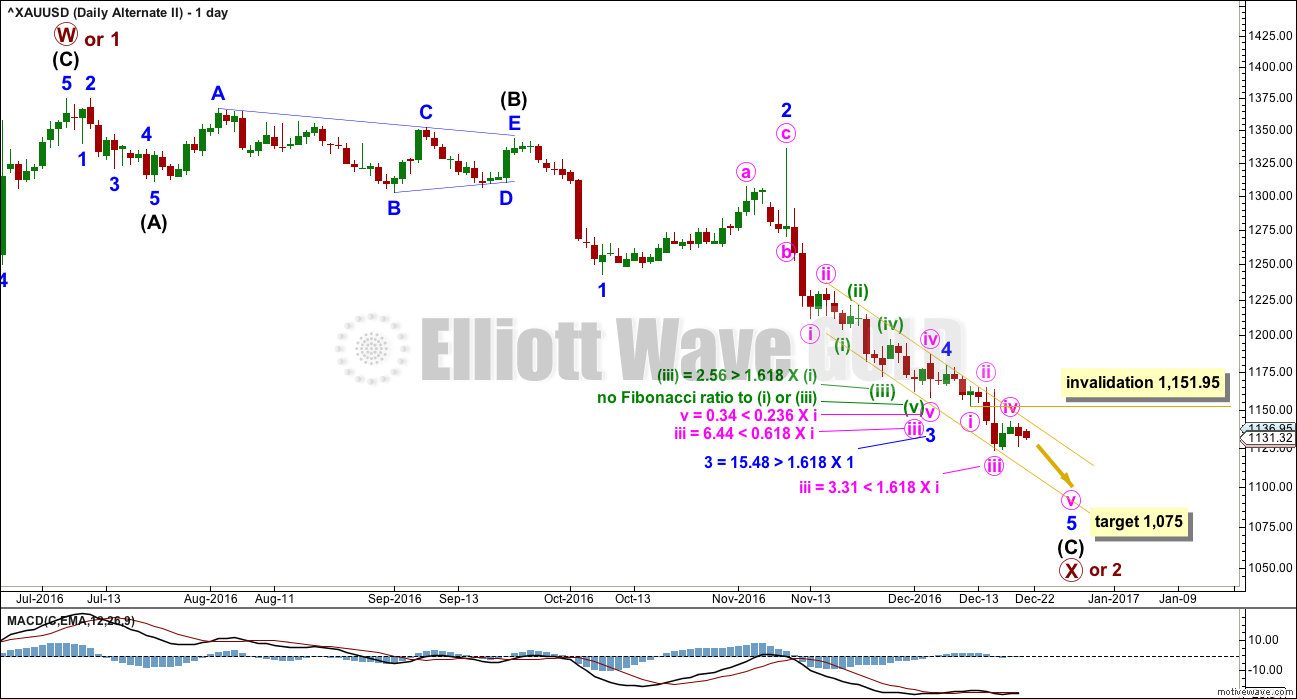
This second idea is identical up to the spike labelled minute wave ii within minor wave 3 within intermediate wave (3). Thereafter, the subdivisions are seen differently.
Fibonacci ratios are again noted on the chart for members to compare with the first daily chart. There is no substantial difference in Fibonacci ratios between the two charts to identify one as having a higher probability than the other.
Minute wave v within minor wave 3 is seen extended; on the daily chart, seeing it this way has a perfect look. It will also fit on the hourly chart. Minute wave v now looks like a five wave impulse. This must increase the probability of this second chart over the first.
Within this labelling, intermediate wave (4) is seen over earlier. Now intermediate wave (5) is an incomplete five wave impulse, so a final fifth wave down for minor wave 5 is required.
Within intermediate wave (5), the correction of minor wave 4 may not move into minor wave 1 price territory above 1,151.95.
At 1,116 intermediate wave (5) would reach equality in length with intermediate wave (1). At 1,114 minor wave 5 would reach equality in length with minor wave 1. This gives a $2 target zone calculated at two wave degrees.
It should be expected that Gold will most likely make new lows while price remains within the yellow channel and keeps finding resistance at the upper edge. When price breaks above the channel, then Gold has most likely turned.
With price continuing to remain within the yellow channel today, it looks like the downwards trend is intact. Expect new lows.
ALTERNATE ELLIOTT WAVE COUNT
FIRST DAILY CHART
Click chart to enlarge.
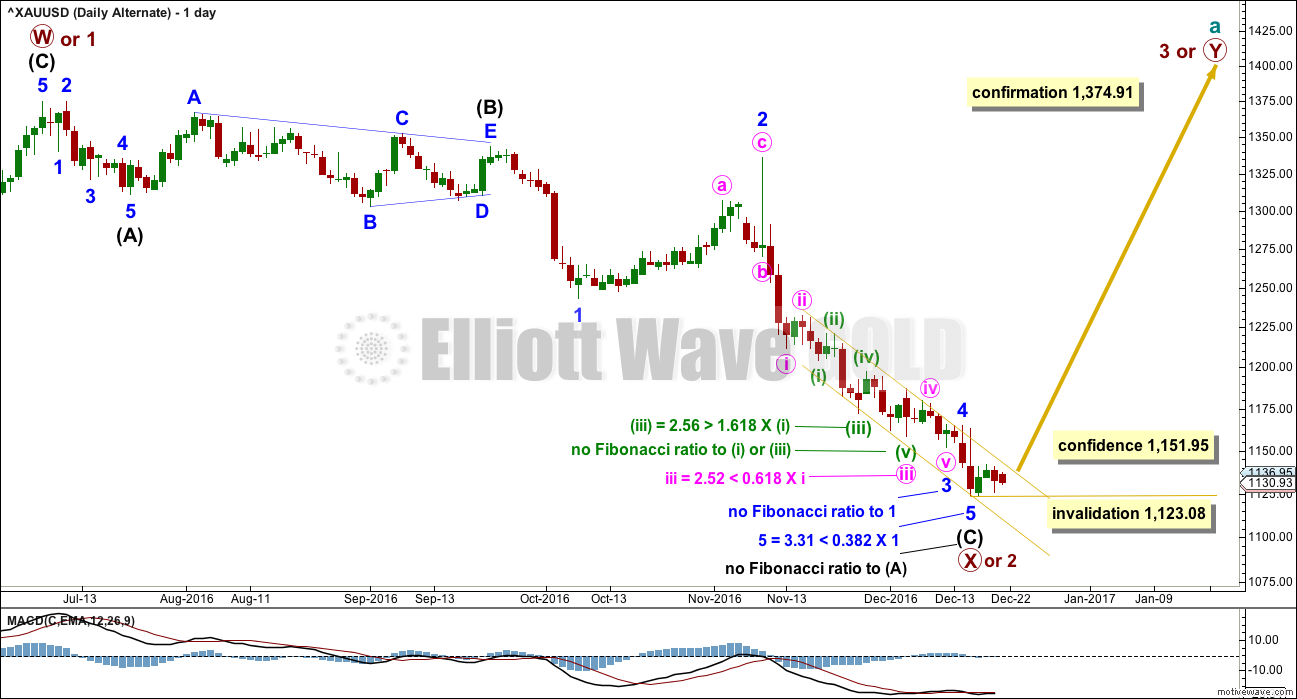
Downwards movement for primary wave X or 2 fits as a single zigzag.
Within downwards movement, this wave count sees a triangle labelled intermediate wave (B). This has a better fit than trying to see this as first and second waves (a second wave may not subdivide as a triangle). This wave count does not suffer from the problems of proportion that the main wave count does.
Primary wave X or 2 is now a very deep correction.
Two daily charts will be published for the alternate wave count, in the same way as two charts are published for the main wave count.
This first daily chart does not have as neat a fit as the second chart below. The key difference is within minute wave iii of minor wave 3 of intermediate wave (C).
Within this wave, minuette wave (iii) may be seen as over here, or it may also be seen as over at the next low (in the same way as the first chart for the main wave count). With this labelling another possibility is considered. This also fits on the hourly chart.
Now minuette wave (v) within minute wave iii within minor wave 3 does not have as good a look on the daily chart. This movement looks like a three, but it should be a five.
The second daily chart for the alternate, published below, has a slightly better fit.
The next wave up for the alternate wave count is either a third wave for primary wave 3 or a second zigzag for primary wave Y. This alternate wave count expects that Gold remains within a bull market, that the wave down from the 6th of July, 2016, is a very deep correction.
SECOND DAILY CHART
Click chart to enlarge.
If minuette wave (v) of minute wave iii of minor wave 3 of intermediate wave (C) is moved up to the prior low, now it looks like a five and not a three. This wave count for the alternate has a higher probability than the first daily chart for the alternate.
Now a final fifth wave down is required for minute wave v of minor wave 5 of intermediate wave (C). Minute wave iv may not move into minute wave i price territory above 1,151.95.
Fibonacci ratios for this idea are not as good as for the first alternate daily chart, so this reduces the probability of this wave count. Of all four daily charts, this one has the worst Fibonacci ratios.
The previous target at 1,118 now looks like it is not low enough from analysis at the hourly chart level. At 1,075 minor wave 5 would reach equality in length with minor wave 1.
HOURLY CHART
Click chart to enlarge.
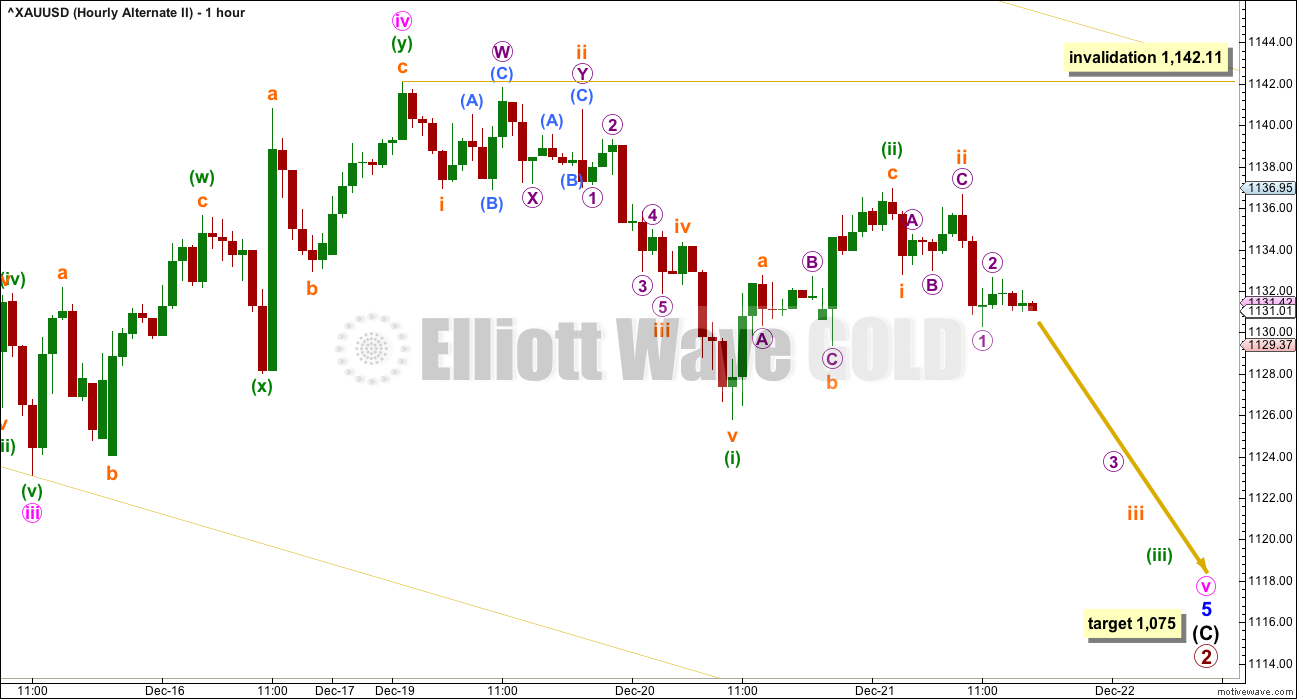
If a final fifth wave down is required, then this is how it would fit on the hourly chart. This idea also works for the second daily chart for the main wave count.
Upwards movement may be a small fourth wave correction here labelled minute wave iv, which may be complete as a double zigzag.
This provides poor alternation with the single zigzag of minute wave ii.
The final fifth wave down may now be underway. Minute wave v must subdivide as a five wave structure. It looks like it may be unfolding as an impulse.
Minuette wave (i) fits as a five wave impulse in the same way as this downwards movement is seen for the first hourly chart. Now upwards movement for today’s session fits best and looks like a three.
With fives down and threes upwards, it looks like the downwards trend is still intact.
To allow room for the whole structure of minute wave v to complete the target is recalculated.
This wave count expects now to see an increase in downwards momentum in the next few days.
Within minute wave v, no second wave correction may move beyond the start of its first wave above 1,142.11.
TECHNICAL ANALYSIS
WEEKLY CHART
Click chart to enlarge. Chart courtesy of StockCharts.com.
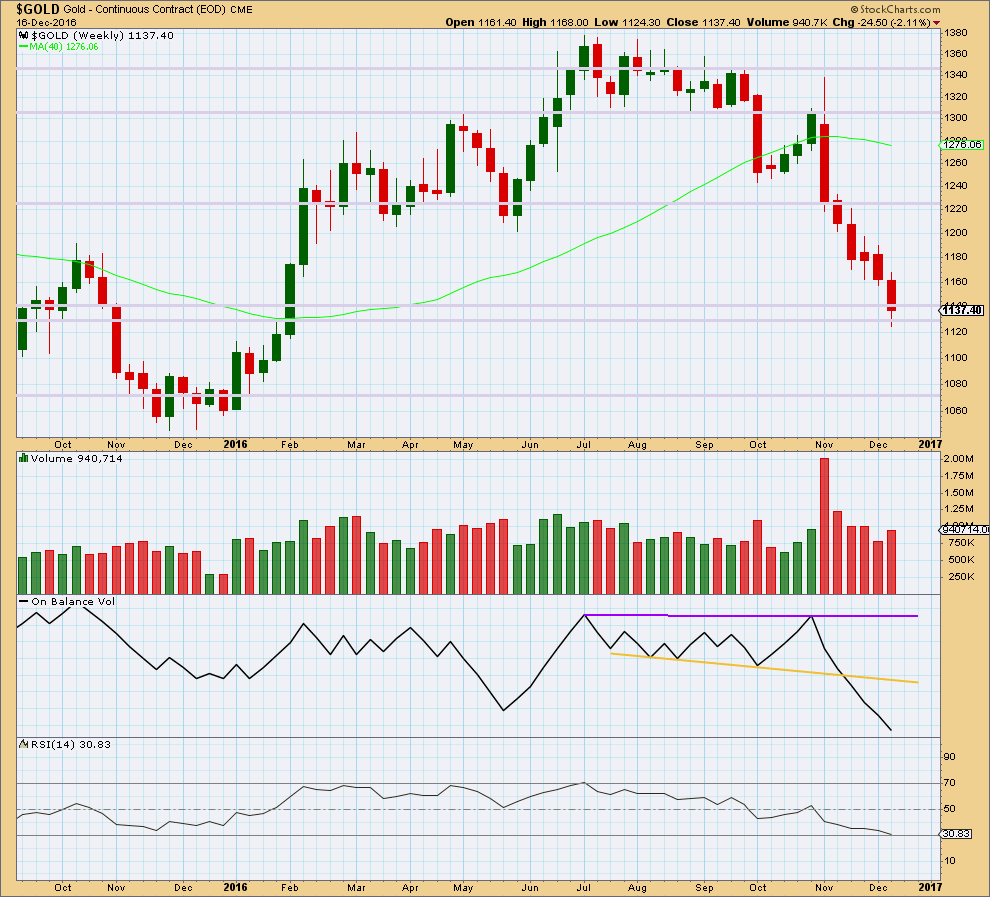
Price continued lower last week with slightly increased volume from the week before. The fall in price has some support last week from volume, but it is still lighter than the two prior weeks.
There is no support line for On Balance Volume at this point.
Price is at a prior area of strong support.
The longer lower wick on last weekly candlestick is slightly bullish, but we have seen this before and it did not portend a trend change.
RSI is almost oversold at the weekly chart level. This should halt the fall in price here, or very soon indeed. RSI tends to not remain oversold for long at this time frame.
DAILY CHART
Click chart to enlarge. Chart courtesy of StockCharts.com.
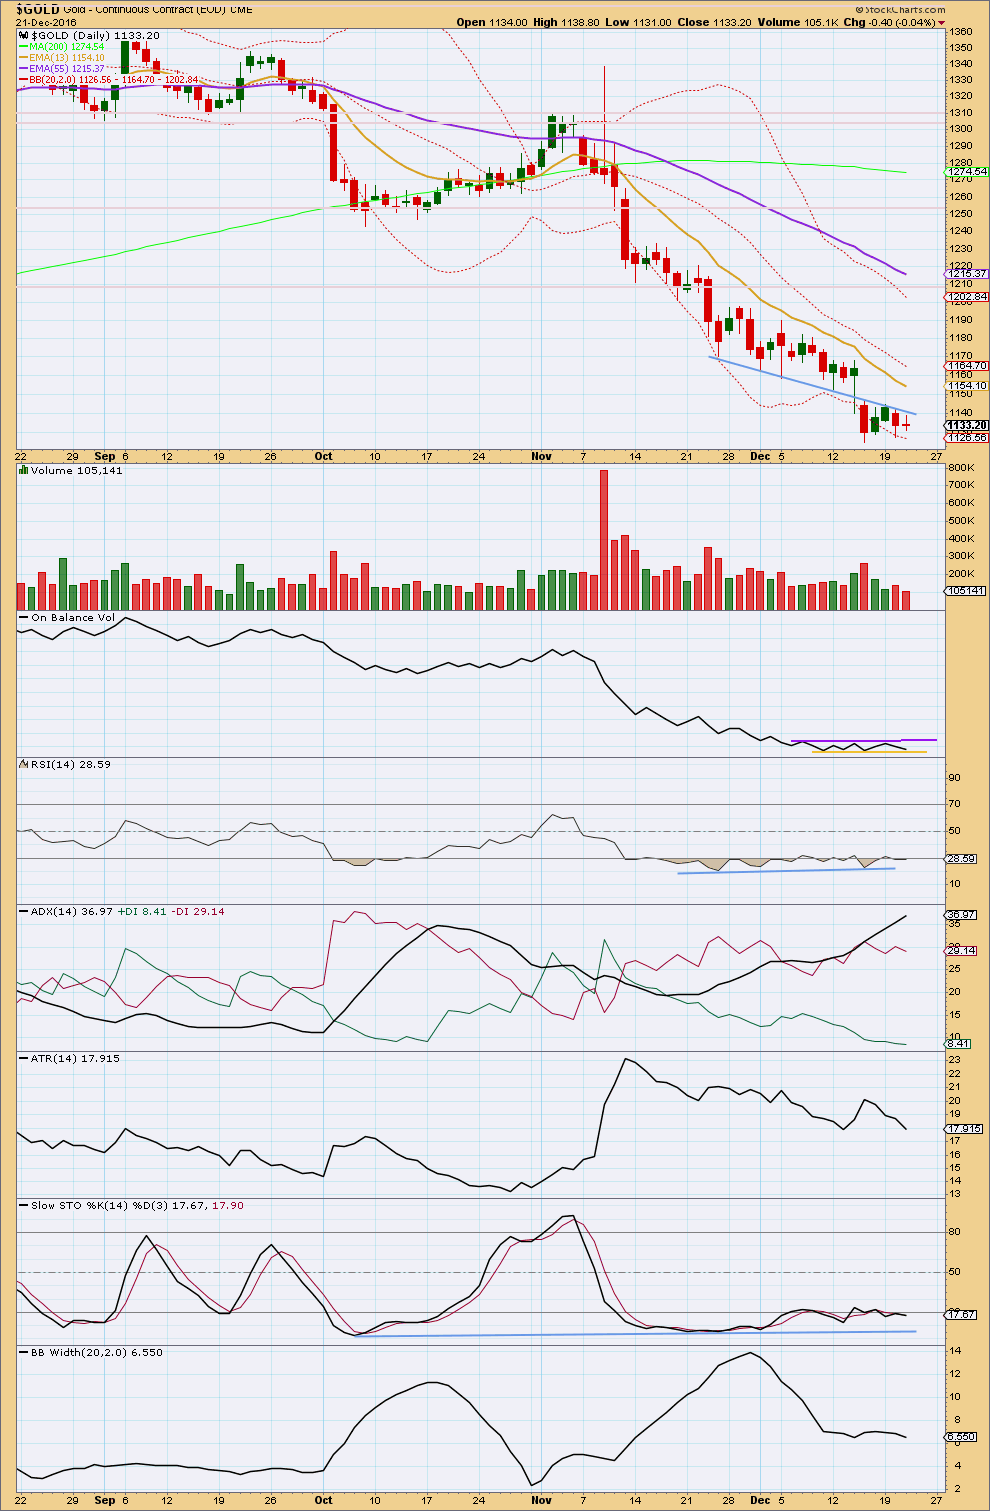
Another small range day completes an inside day, a red doji candlestick. Price continues to find resistance at the blue trend line. A doji represents a pause; on its own, it is not a reversal pattern. There is no candlestick reversal pattern at the last low five days ago.
All three long, mid and short term moving averages are pointing downwards. Price is below all three. The trend is downwards.
Volume today is lighter. With price moving overall sideways this is not concerning; it may only be a small pause in the trend.
Trend lines for On Balance Volume are redrawn today. A break above resistance or below support may indicate the next direction for price.
ADX is now extreme above 35 and the black ADX line is above both the +DX and -DX lines. This trend is extreme, but this does not preclude further lows. It indicates that an end to the trend is closer, but this will not pinpoint when price turns.
RSI is oversold and exhibits mid term divergence with price. This can develop further to multiple divergence before a low is found.
ATR is declining and Bollinger Bands are steady.
This trend is extreme and looks tired. But it must be accepted that price may continue lower while price remains within the yellow channel on Elliott wave charts and below the blue trend line on this chart. There is no indication yet of the low in place.
GDX DAILY CHART
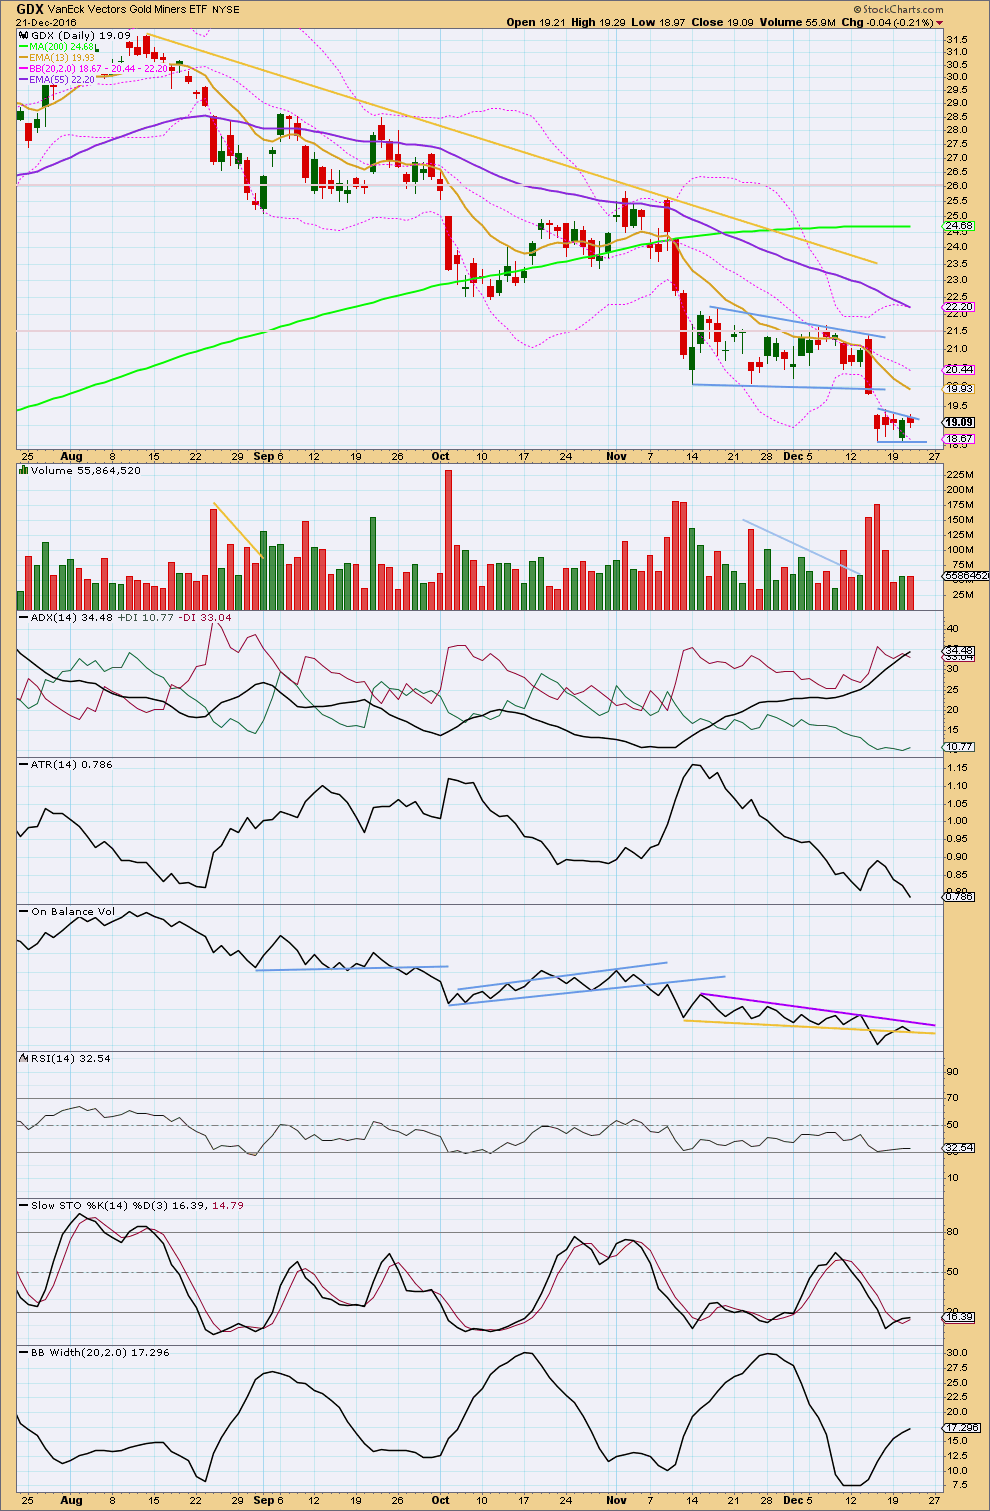
Click chart to enlarge. Chart courtesy of StockCharts.com.
The target at 14.50 calculated from the larger flag pattern using the measure rule may still be met.
The gap out of that pattern should continue to provide resistance.
Now a smaller flag pattern looks like it is unfolding. A shorter term target from this may be about 15.8.
ADX is nearing extreme now for GDX. The trend is not over, but it is getting closer to an end.
ATR is declining. Bollinger Bands are still widening though, so there is some volatility still in this market.
On Balance Volume is again at support at the yellow line. Another breach below this line would be a weak bearish signal.
RSI is not yet oversold. Stochastics is, but this may remain extreme for reasonable periods of time during a trending market.
The short and mid term trends for GDX are down; the short and mid term moving averages are pointing downwards and price is below both. The longer term 200 day moving average may be rolling over.
This analysis is published @ 08:07 p.m. EST.
I would have thought today with a thin market that the gold price would be pushed down a bit, guess even the big guys took a break. Merry xmas and happy new year to all.
I sure hope this is a deep second wave for the white metal. I am getting pretty close to my stop at 15.62 If we have indeed had a trend change we should be getting up a good head of steam…not taking a snooze! 🙂
It looks like it’s going to make a new low Verne. I don’t see much weakness in this downwards move for Silver at this stage, and the move does look impulsive. I count 13 down now on the hourly chart.
I like using ETSI to indicate weakness with divergence after reaching extremes. With ETSI I’m seeing a little divergence at the last low, but only single and not much.
A big THANK YOU to Dreamer this morning. No sooner had I glanced at my charts than I saw his comment and chart for a triangle forming in Gold.
It fits perfectly. It’s supported by MACD hovering now at zero. It explains Gold’s lethargic movement for the last few days. It adheres neatly to it’s trend lines.
This changes the target expectation.
Gold’s fifth waves out of it’s fourth wave triangles are often surprisingly short and quick. The initial target at 1,118 or 1,116 – 1,114 are now looking right.
When the fifth wave down out of the triangle is complete then Gold should reverse swiftly and strongly, leaving us all in no doubt that a low is in.
That’s what would be expected from this wave count anyway. Let’s see how this plays out.
Lara ,
In the USDJPY Hourly chart , I ‘m watching for a possible ” abcde ” from (iii) to (iv ) .
The mirror- image for (iii) , its recent peak 118.66 ,……. is GOLD ‘s recent bottom 1123.61 , also a (iii) . For USDJPY , the “a” starts at 116.54 ( GOLD mirror image reading at 1142.39 )
It is also the same at the USD Hourly chart , looking for its (iv), and then a rally to its reversal Top in its final rally move to (v) .
IF the ” abcde” for USDJPY and GOLD plays out , then all three , USD, USDJPY , and USD will confirm their respective (iv) at about the same time . The USD’s (iv) is just a Flat abc , not a ” abcde ” tho . Nothing is confirmed yet at this hour of my watch . .
And it will be most interesting if SP 500 also confirms its (iv) Pullback is finished tonite . Then all four inter- markets will be taking off to their respective (v ) ,……… and reverse ? Interesting ! Still speculative .
In search for GOLD’s final reversal Bottom , my target for USDJPY ‘s coming reversal Top is at 120 / 120.50 , its final (v) .
Your proposed final reversal Bottom at 1114 /6 is good for me , the Fib 78.60 % retrace of the whole works is about there .
We should know about the ” abcde” for (iv) very soon . I’m looking for its ” de” now and will switch off .
“e” will be (iv) in GOLD and USDJPY , that needs retagging . Still worth a shot checking it out in a few hours . We will know if it gets invalidated . Slow holiday season market .
Many thanks for all your charts , Lara , all high density counting . You work real hard for us members , deeply appreciated . I’m comfortable with your 2 scenarios .
And Dreamer’s GDX chart , many thanks .
Best Regards ,
Merry Christmas everyone ,
Raymond ,
Merry Christmas to you too Raymond 🙂
I’m gearing up for it… I travelled from Northland to the Bay of Plenty yesterday and am now with family 🙂 Good times.
I can see that little triangle too in USDJPY. I think I can see on in NZDUSD also.
I don’t keep up with the “news”, so can anyone tell me if there’s a news release due that everyone is expecting will move the markets before Christmas? That could be a whipsaw: out of these triangles then quickly reversing.
Yikes! Are those grave stone dojis being printed by both GLD and SLV?!
I think its too early in the session to say
I have a feeling I am going to get stopped out on a manic fifth down just before price turns around and heads for the moon.! *Sigh* 🙂
Verne, you may like this.
https://goldtadise.com/?p=390479
With the triangle scenario shown below for gold, I would expect the recent low @ 18.59 to hold for GDX.
A break below 18.59 for GDX likely means that GDX and gold go much lower.
I think you’re right about that last little triangle for GDX Dreamer. Nicely done.
I’m going to remove my trend lines on my GDX chart for that last pennant. It’s sloping slightly downwards anyway, so it wasn’t a good one.
Lara, Alan, what about a triangle?
I like this idea because it looks to me that GDX has made at least a short term bottom and will likely bounce more.
A short, quick drop for gold fits nicely with the GDX count because GDX will then likely hold it’s recent low.
Thoughts?
Dreamer. I like this idea. The triangle will explain the lethargic range bound nature of the price movements in the past week.
Me too. Thanks Dreamer. It looks good…. I’ll now go and check subdivisions…
MACD is now hovering on zero supporting this idea.
This changes expectations for the target. 1,118 or 1,116 – 1,114 now looks right.
I took an initial long position in Silver close to the 15.62 lows two days ago. I will be looking today for a trigger of a higher low to add to my long position with a move back above 16.00.
More trouble looms ahead for the beleaguered 1st wave counts (both Main and Alternate). Looking at the hourly chart in the Main count, price has dropped below minuette i where the subminuette waves originate. If I am not wrong, a rising wave count cannot drop below its origin.
To do some patchwork:
(a) Minuette i could be moved to where subminuette i is (1136.95). A five count can be forced, not satisfactory.
(b) Minuette i could be moved to where micro a is (1136.67). This yields a 5 count but the fifth wave is truncated, just. However, on other data feeds, that point (1136.67) is shown to be higher than 1136.95.
This downward movement favours the 2nd wave counts (both Main and Alternate). The low at 1128.39 may be labelled as submicro 1 of micro 3 in the Alternate (and micro 1 in the Main).
I’m just waiting for price to claim 1123.08 to invalidate the 1st waves. When that happens, it will make analysis easier.
Trying to see a low in place already really is problematic. Over the last two days price behaviour has not fitted the idea and the Elliott wave structure just doesn’t work well at all.
It sure does look like Gold is going to make another low.
Hi Lara,
The target is 1116-1114 or lower at 1075. Your first daily chart indicates the invalidation point at 1123. Which Chart is the target point indicated?
For both the main wave count and the alternate there are two daily charts.
For both the main wave count and the alternate there has either been a trend change already, or a new low may come very soon.
For the main wave count if price moves below 1,123 then the target is at 1,116 – 1,114, but this may now be not low enough.
For the alternate wave count if price moves below 1,123 then the target is 1,075 and this looks about right.