
Another small inside day fits both Elliott wave counts, but price behaviour is pointing to one scenario more strongly than the other.
Summary: It still looks like another new low may unfold before Gold either turns or begins a time consuming consolidation. The target is either 1,116 – 1,114 or again 1,118.
New updates to this analysis are in bold.
Last monthly and weekly analysis is here, video is here.
Grand SuperCycle analysis is here.
MAIN ELLIOTT WAVE COUNT
The first daily chart will not be published today. The idea is still just valid, but price behaviour strongly suggests it is wrong.
SECOND DAILY CHART
Click chart to enlarge.
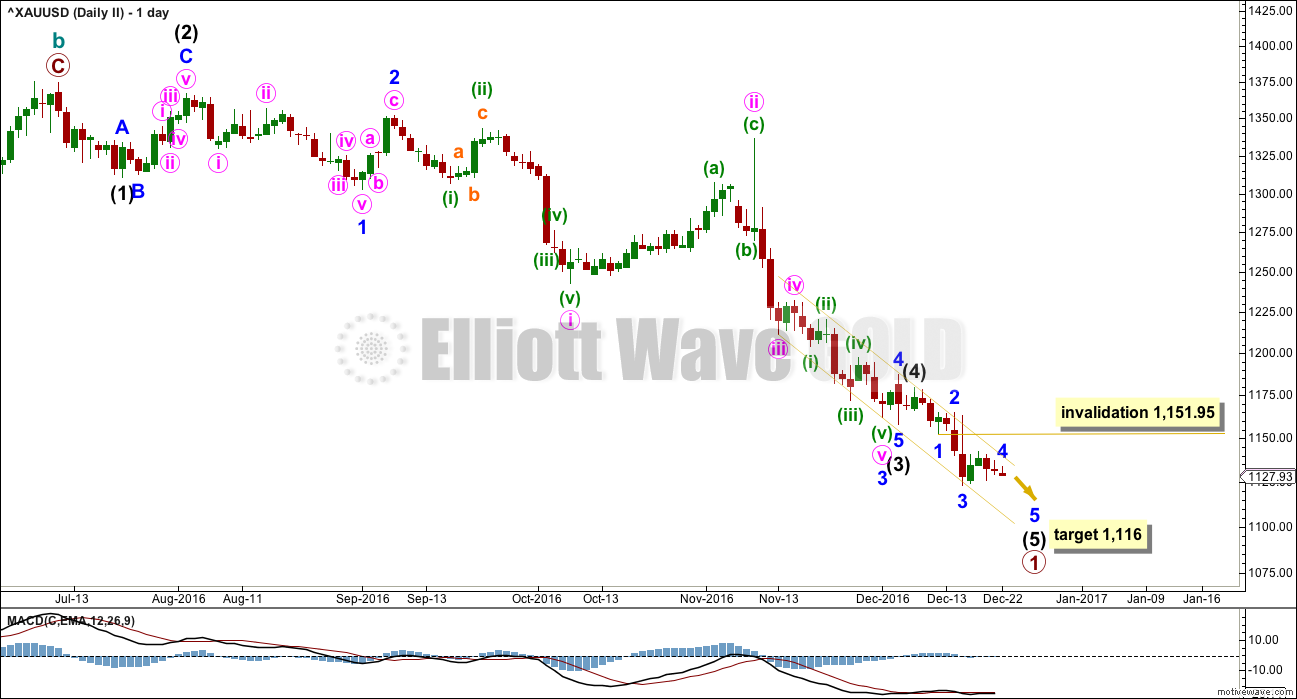
This main wave count expects that Gold remains in a bear market. Downwards movement is seen as an unfolding impulse for primary wave 1 or cycle wave c.
If an impulse is unfolding lower, then there is a problem of proportion between the correction labelled minute wave ii and the two earlier corrections labelled minor wave 2 and intermediate wave (2). Minute wave ii is much longer in duration than second wave corrections one and two degrees higher. This reduces the probability of this wave count.
Also, this wave count must ignore what looks like a fairly obvious triangle early on in this downwards movement; a triangle may not be the sole corrective structure of a second wave.
Intermediate wave (3) has no Fibonacci ratio to intermediate wave (1). It is more likely then that intermediate wave (5) will exhibit a ratio to either of (1) or (3). At 1,116 intermediate wave (5) would reach equality in length with intermediate wave (1).
Ratios within intermediate wave (3) are: minor wave 3 has no Fibonacci ratio to minor wave 1, and minor wave 5 is 1.27 longer than 0.146 the length of minor wave 3.
Ratios within minor wave 3 are: minute wave iii has no Fibonacci ratio to minute wave i, and minute wave v is 2.97 longer than 0.618 the length of minute wave i.
Ratios within minute wave v of minor wave 3 are: minuette wave (iii) is 2.65 longer than 1.618 the length of minuette wave (i), and minuette wave (v) has no Fibonacci ratio to either of minuette waves (i) or (iii).
Within intermediate wave (5) so far, minor wave 3 is 3.31 shorter than 1.618 the length of minor wave 1. Minor wave 5 may not exhibit a Fibonacci ratio to either of minor waves 1 or 3.
While price remains within the best fit yellow channel, it should be expected that the downwards trend remains intact. This wave count expects one more low and then a trend change for Gold.
Minor wave 4 may not move into minor wave 1 price territory above 1,151.95. At any stage, a new high above this point and above the yellow channel would indicate a trend change for Gold.
HOURLY CHART
Click chart to enlarge.
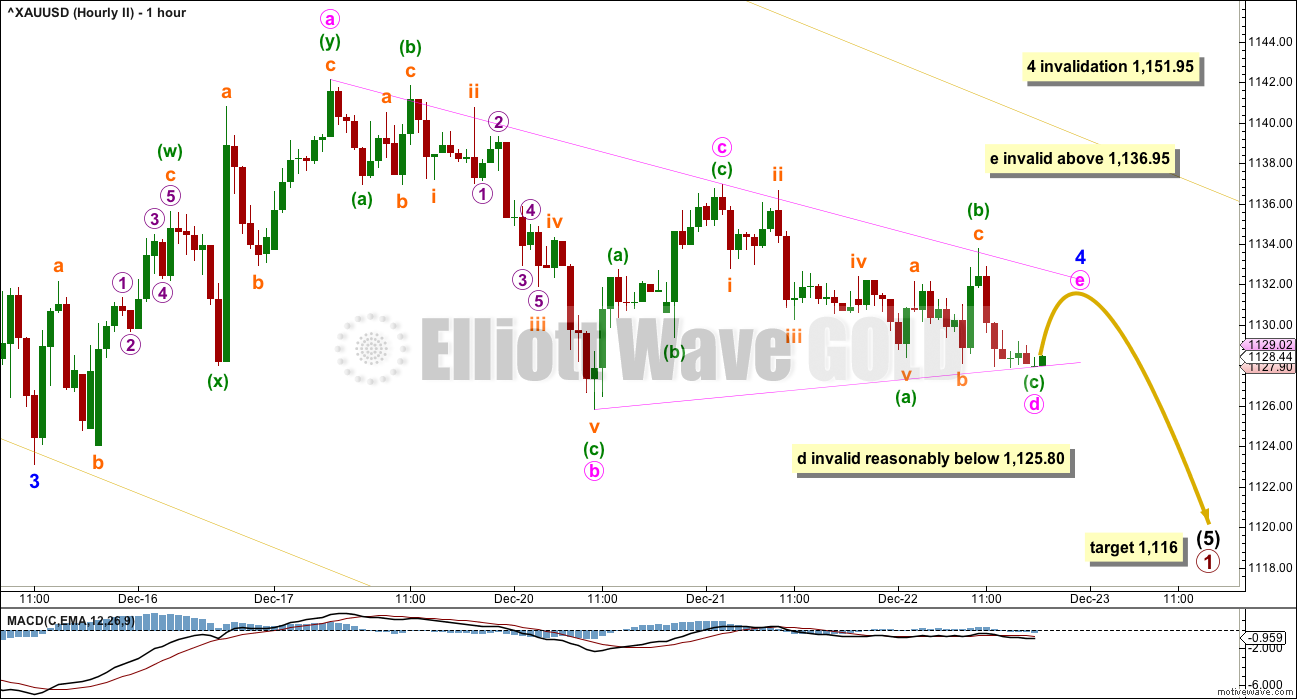
At this stage, it looks like a regular contracting triangle is unfolding. This wave count expects it is at minor degree.
All sub-waves fit perfectly within the triangle. Minute wave a fits as a double zigzag. All other waves must be simple A-B-C corrections.
Only the final small wave up for minute wave e is required to complete the triangle. It is most likely to fall short of the A-C trend line. If it does not end there, then it may end with a small overshoot of the A-C trend line.
Minute wave e may not move beyond the end of minute wave c above 1,136.95.
Minute wave d, currently ending, may not move beyond the end of minute wave b below 1,125.80 for a contracting triangle.
Minute wave d, for a barrier triangle, should end about the same level as minute wave b at 1,125.80 so that the B-D trend line is essentially flat. In practice, this means that minute wave d may end slightly below the end of minute wave b at 1,125.80. This invalidation point is not black and white; this is the only Elliott wave rule which has any grey.
Gold often has surprisingly short fifth waves out of its fourth wave triangles.
When minor wave 5 is complete, then this wave count expects a primary degree trend change for Gold. The next wave up for primary wave 2 is expected to be deep and last several weeks.
ALTERNATE ELLIOTT WAVE COUNT
The first alternate daily chart will also not be published today. Price behaviour does not support it at this stage.
SECOND DAILY CHART
Click chart to enlarge.
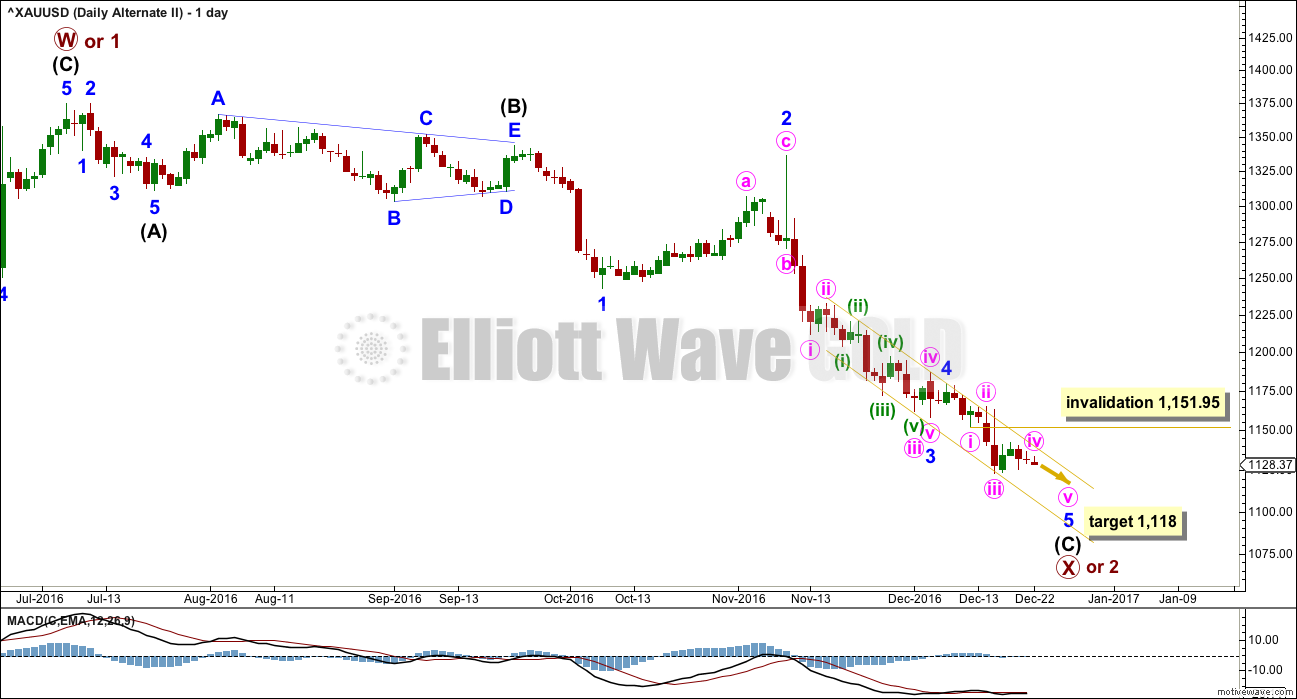
This alternate wave count expects that a zigzag is unfolding downwards within a larger continuing bull market for Gold. When primary wave X or 2 is complete, then this wave count expects the bull market to resume for Gold to new highs.
This triangle resolves the problem of proportion that the main wave count has. It sees a triangle unfolding early on in this downwards movement as intermediate wave (b).
Within intermediate wave (C), minor wave 3 is 15.48 longer than 1.618 the length of minor wave 1. This is a big difference but less than 10% the length of minor wave 3, so it may be considered a reasonable Fibonacci ratio.
Ratios within minor wave 3 are: minute wave iii is 6.44 short of 0.618 the length of minute wave i, and minute wave v is just 0.34 short of 0.236 the length of minute wave i.
Ratios within minute wave iii are: minuette wave (iii) is 2.56 longer than 1.618 the length of minuette wave (i), and minuette wave (v) has no Fibonacci ratio to either of minuette waves (i) or (iii).
Within minor wave 5 so far, minute wave iii is 3.31 short of 1.618 the length of minute wave i.
At 1,118 minor wave 5 would reach 0.618 the length of minor wave 1.
Minute wave iv may not move into minute wave i price territory above 1,151.95.
HOURLY CHART
Click chart to enlarge.
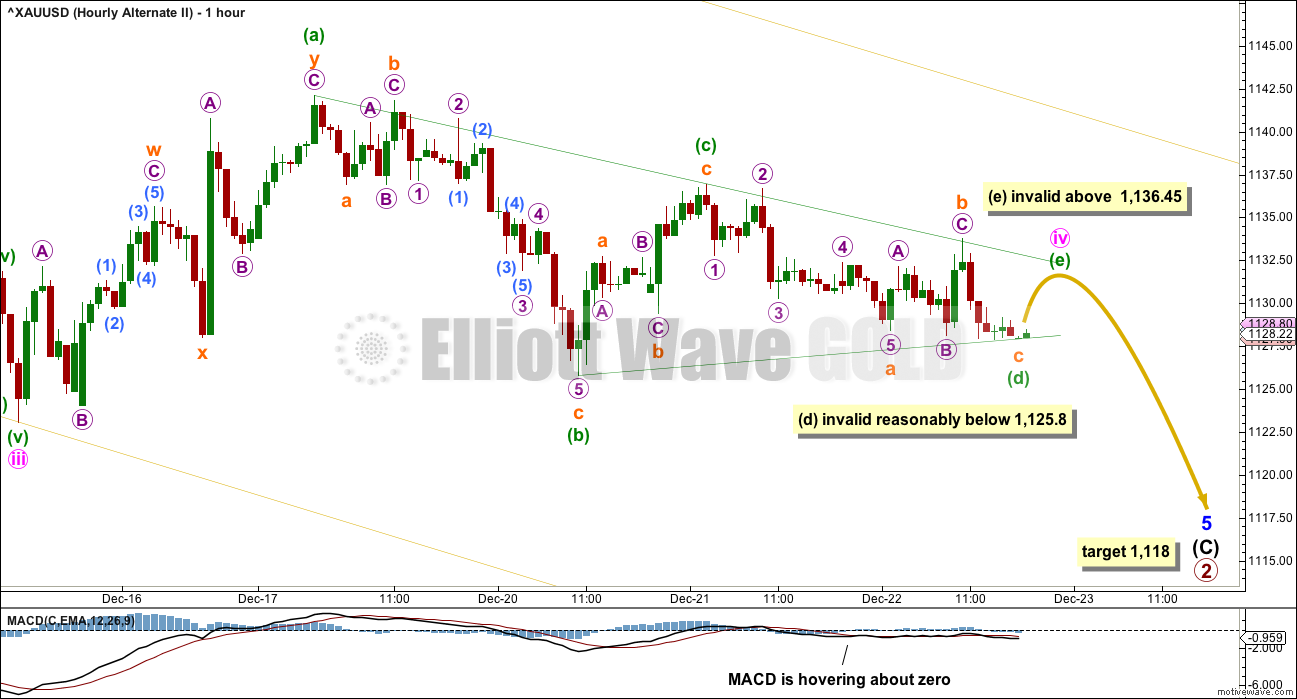
I have charted a possible flat correction, but it does not at this stage have the right look. If I can see an alternate structure for this fourth wave that looks right, then it will be published.
The triangle looks like an almost complete regular contracting triangle. This wave count is identical to the main wave count for this fourth wave with the exception of the degree of labelling; here, it is one degree lower.
TECHNICAL ANALYSIS
WEEKLY CHART
Click chart to enlarge. Chart courtesy of StockCharts.com.
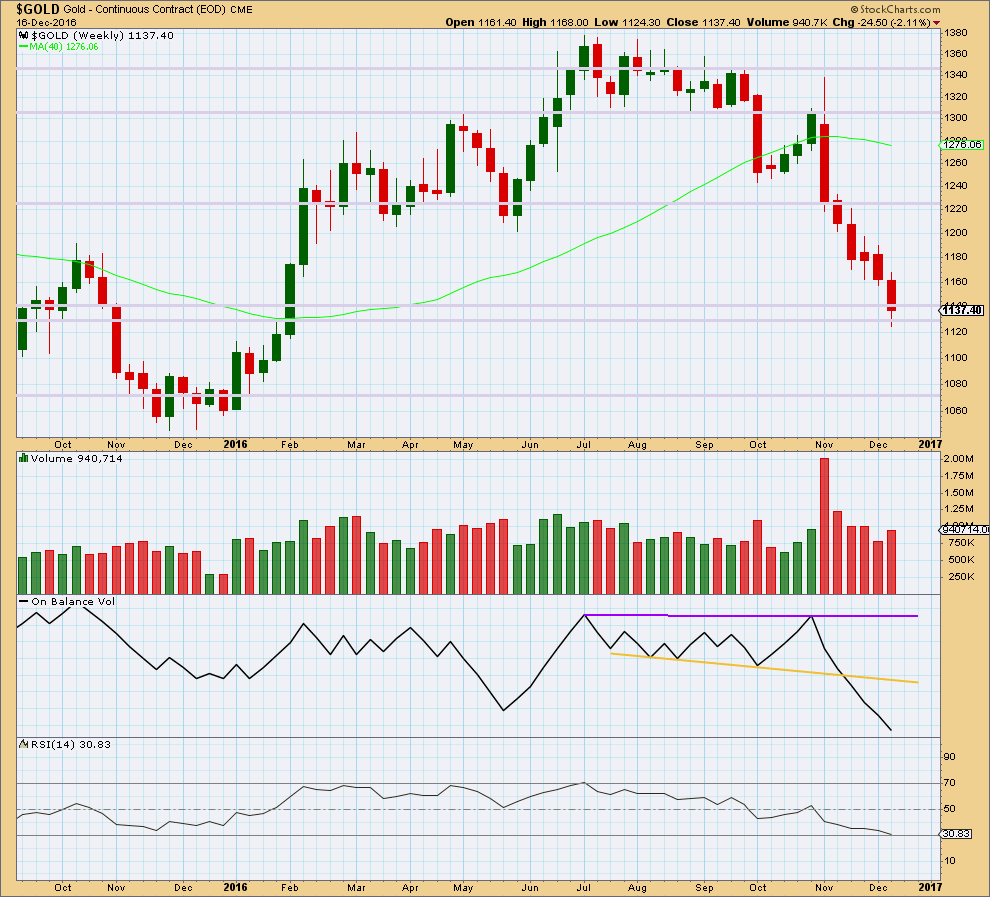
Price continued lower last week with slightly increased volume from the week before. The fall in price has some support last week from volume, but it is still lighter than the two prior weeks.
There is no support line for On Balance Volume at this point.
Price is at a prior area of strong support.
The longer lower wick on last weekly candlestick is slightly bullish, but we have seen this before and it did not portend a trend change.
RSI is almost oversold at the weekly chart level. This should halt the fall in price here, or very soon indeed. RSI tends to not remain oversold for long at this time frame.
DAILY CHART
Click chart to enlarge. Chart courtesy of StockCharts.com.
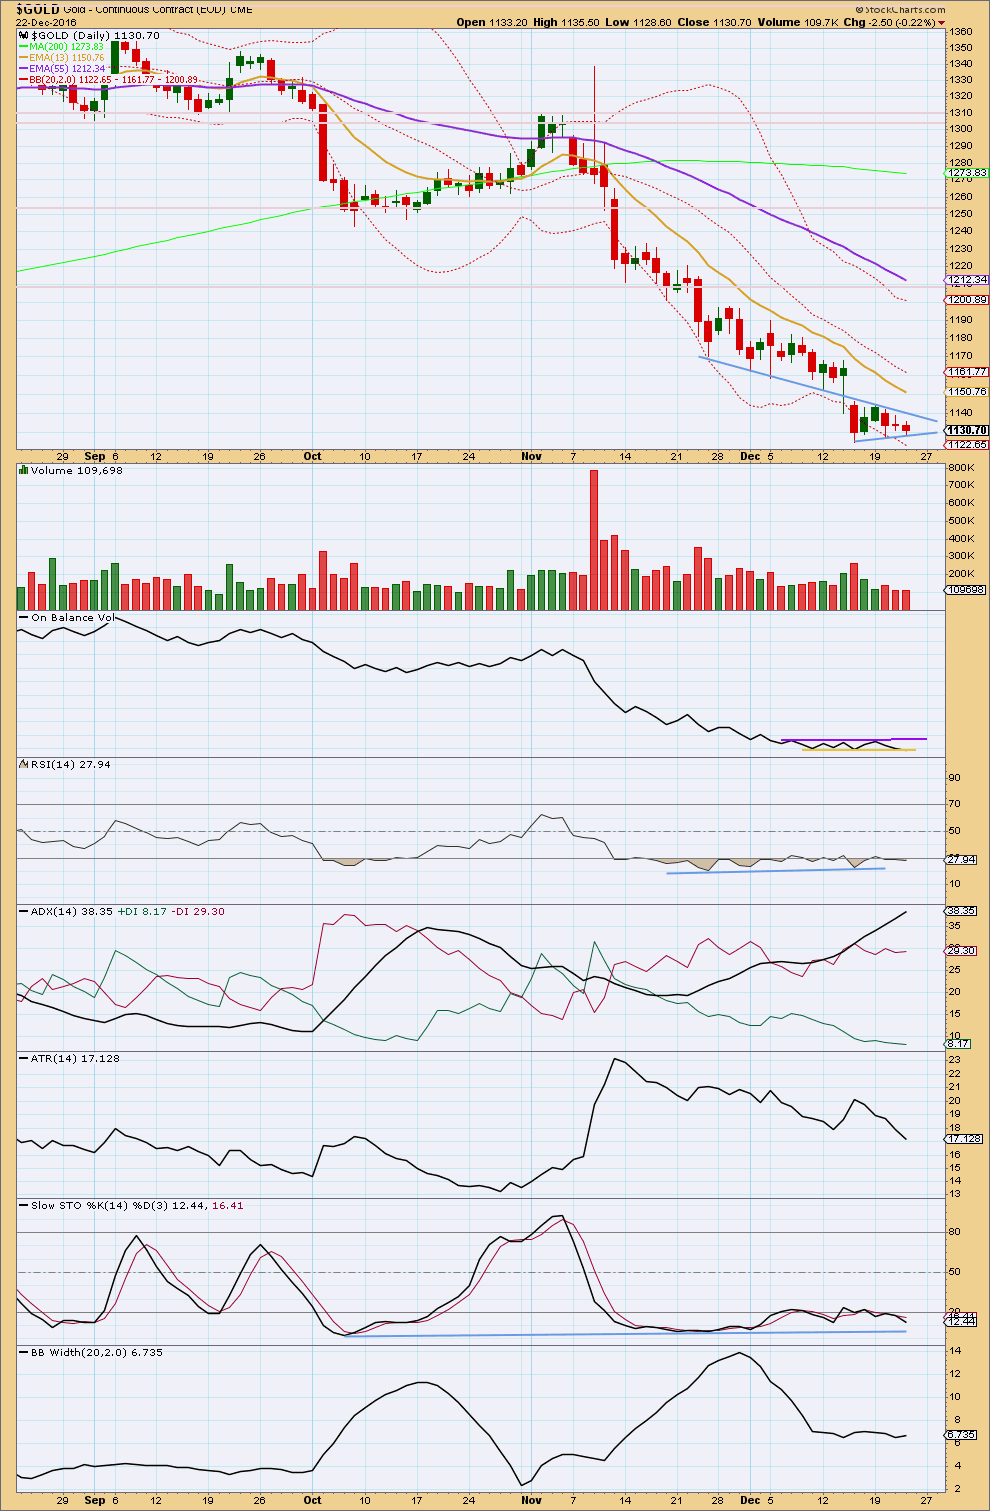
A small pennant pattern is unfolding. These are fairly reliable continuation patterns. The breakout is most likely to be downwards.
The pattern is supported by declining volume as price moves sideways.
A target about 1,085 is calculated using the measured rule.
On Balance Volume remains constrained. A breakout may indicate the next direction for price.
The trend is down. Price is below all three moving averages and all three are pointing downwards.
The trend is extreme though. ADX is above 35 and the black ADX line is above both -DX and +DX lines.
Both Stochastics and RSI are oversold and both exhibit divergence.
The trend is nearing its end, but the pennant pattern indicates at least one more low before it turns.
GDX DAILY CHART
Click chart to enlarge. Chart courtesy of StockCharts.com.
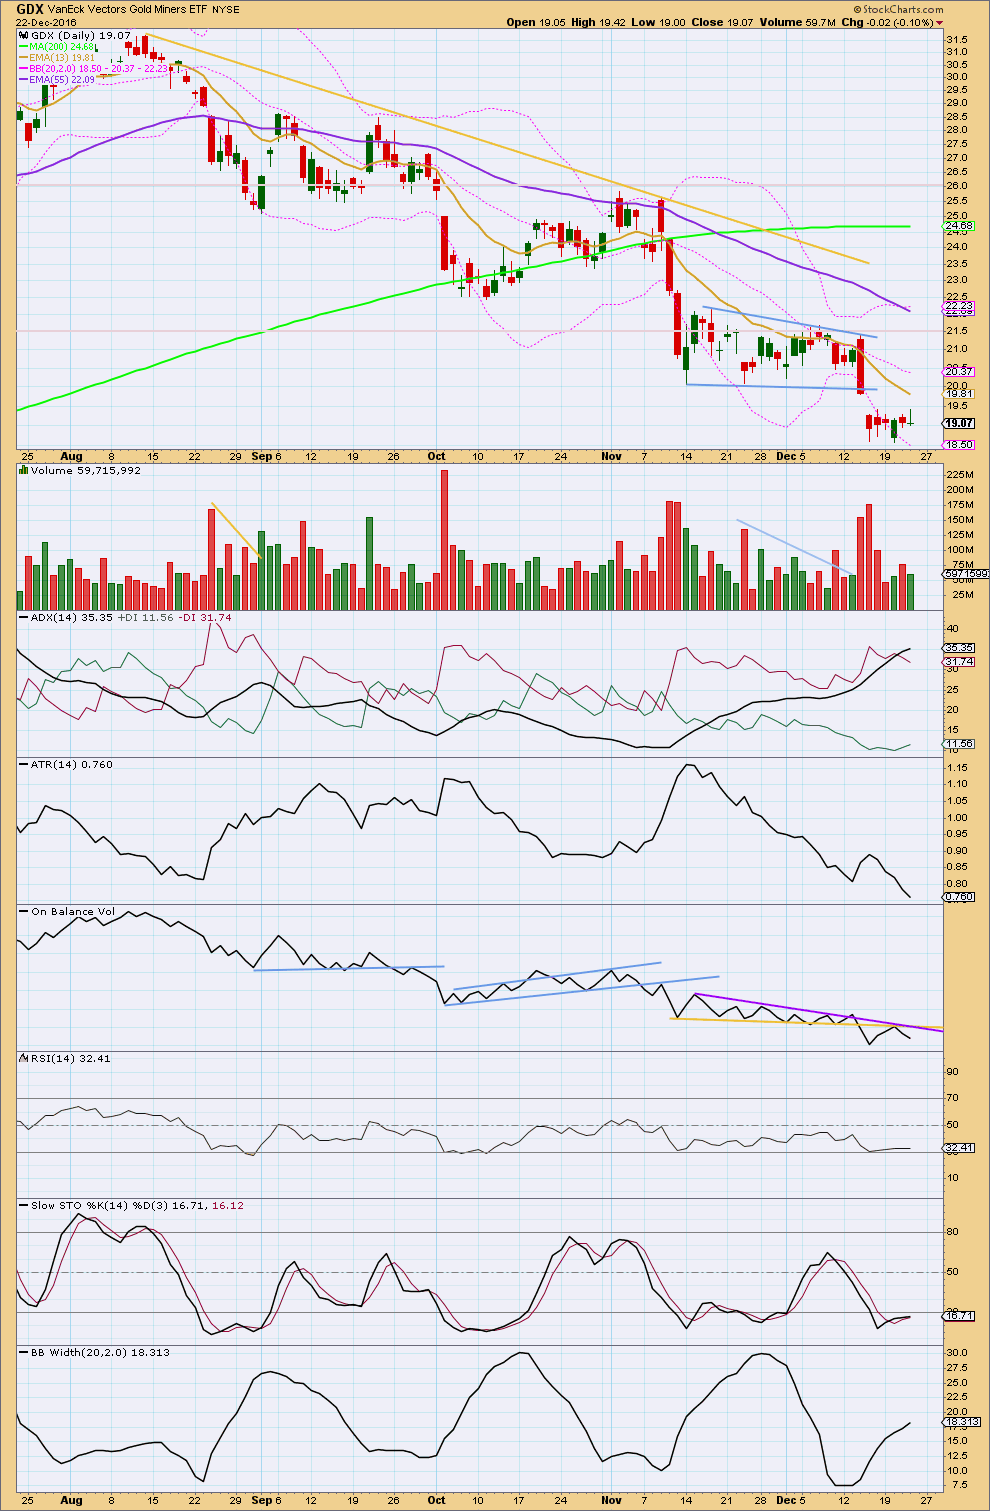
The larger flag pattern gives a target about 14.50. The breakaway gap out of the pattern is still providing resistance.
A smaller consolidation looks like it is unfolding, but this does not fit well as a flag nor pennant. The low of 20th of December is slightly below the 15th of December, and now the high for today is at exactly the same point as the 19th of December. This pattern has a very slight downwards slope.
ADX is now extreme above 35. The black ADX line is now above both the +DX and -DX lines indicating an extreme trend.
The target at 14.50 may be too optimistic.
The yellow line on On Balance Volume is slightly adjusted. This is now providing resistance. A break above either of these lines would be a bullish signal from GDX. If that happens, then a low may be in place.
This analysis is published @ 07:45 p.m. EST.
Nem, newmont mining is up 3 percent vs 3x leveraged play Jnug up 2.5 percent. Nem usually leads the miners up, hope to get another low to dig in deeper
Commercials down to 134k net short. Lopped off 14k short and went Long 2k. With options, commercials added 11k long and took off 6k short. So still going in the right direction for a bottom the commercials are starting to go long at about 1130 for gold
The analysis which will be published after NY close today, with video, will be the last one for two weeks.
I’ll be around though, and as Gold is looking like putting in a primary degree bottom I’d like to open a long position when it does. If I see a good set up to go long I’ll be publishing a chart and making comments in the comments section.
I’m not planning to go away to anywhere that has no internet connection, unless I have to chase waves. My only plan is to surf as much as humanly possible for two weeks 🙂
Thanks for all your hard work Lara. Hope you can stay away from your computer enough to enjoy your holiday. Merry Christmas!
Once again dear Lara, it is time for those famous spaghetti arms!
I hope you have a wonderful time of refreshment and recreation over the Xmas season and all the very best wishes for the season to you and your family!
Thanks guys!
May you too, and all members, have a wonderful Christmas.
It is also possible that this fourth wave could continue as a flat correction, but because this would mean a big overshoot of the small yellow channel this wave count would look all wrong.
But, consider all possibilities. What if I’m wrong about the triangle?
This is what a flat might look like at this stage.
I’ll have two wave counts at the hourly chart level to leave you with today:
Here is the first.
The fourth wave may be over. The final wave E of the triangle has overshot the A-C trend line. This doesn’t look perfect, E waves more often undershoot than overshoot. But it doesn’t look too wrong and it does fit. This wave count meets all EW rules and the subdivisions all fit. The triangle is supported by MACD.
If this is the correct wave count then the fifth wave down has started today. Fifth waves out of Gold’s fourth wave triangles can be surprisingly quick and short. Let us not be surprised again if this happens here.
This means a reversal for Gold at primary degree could be very close now, it may happen before Christmas.
Oops! I forgot to change the watermark 🙂
No worries. Friends from the other side in attendance! 🙂
Papudi,
Lift the upper trendline above green (c) , they don’t have to touch .
GOLD is doing a proper 3 – subwaves ie abc , from (d) to (e) and will reverse Down from (e) as its (iv) , as charted .
As long as (e) is below the level of (c) .
On my chart , NetDania.com , it is still below , so it’s fine. The ” (abcde)” is playing out .
The USD has already gone Up as a i , ii from its (iv) . GOLD should fall and break- out downside , as expected in Lara’s latest report .
I think the whole general market will be reversing shortly , not just GOLD. This gives me confidence , tho most of the GOLD bulls have gone bearish .
Thanks for posting some interesting links .
Happy New Year to you and family .
Regards ,
Raymond
It sure looks to me like Silver is putting in a double bottom. I am glad I lowered my stop to 15.50 spot. I am adding another 1/4 to my long Silver position at these levels, maintaining a very tight stop with any break of 15.50 I am also using a limit sell order in case we get a violent flush in a fifth wave down that blows past my stop price. I think at the very least an interim bottom is near or already in place and to my mind a final flush down would confirm it.
Gold has broken the trend line from Dec 19 high at 1142 decisively in hourly period.
Now it needs to invalidate Lara’s hourly wave count trading above 1136.95.
Gold at 1133+
May be Jan will be the month of up and Feb- Mar will see gold at new high above 1377!!!
However, Silver needs to confirm the breakout??
Watching the white metal closely. So far it remains above 15.62, keeping the idea of a deep second wave in play. We should have clarification by today’s close I would imagine. I still am expecting a very strong upside move and holding a 1/2 full long position with stop lowered to 15.50.
A 3-wave up for Minute 5 in the Main (and minuette 5 in the Alternate) should have completed at the high of 1133.40. We should now begin the final descent into 1118/1116/1114.
Looks like I spoke too soon.
At what point would this be considered a breakout to the upside.
My first pick would be 1142.11 followed by Lara’s 1151.95. Below those points, I am still bearish short-term.
Even long-term, I am still doubtful about a bullish trend. My reasons are set out in my post on Dec 15. Those were based on fundamentals. I can’t see a clear picture from a technical perspective. Maybe somebody could.
The same procedure as yesterday….!?