
Price whipsawed and crossed both invalidation points for the first two hourly charts.
Summary: It looks like Gold is finding a low. Confidence in a trend change would come with a new high above 1,232.48. Double divergence now with RSI strongly indicates a low here or very soon indeed. The target for the next wave up is either 1,487 or 1,690.
New updates to this analysis are in bold.
Grand SuperCycle analysis is here.
Last monthly and weekly charts are here. Last historical analysis video is here.
DAILY ELLIOTT WAVE COUNT
Click chart to enlarge.
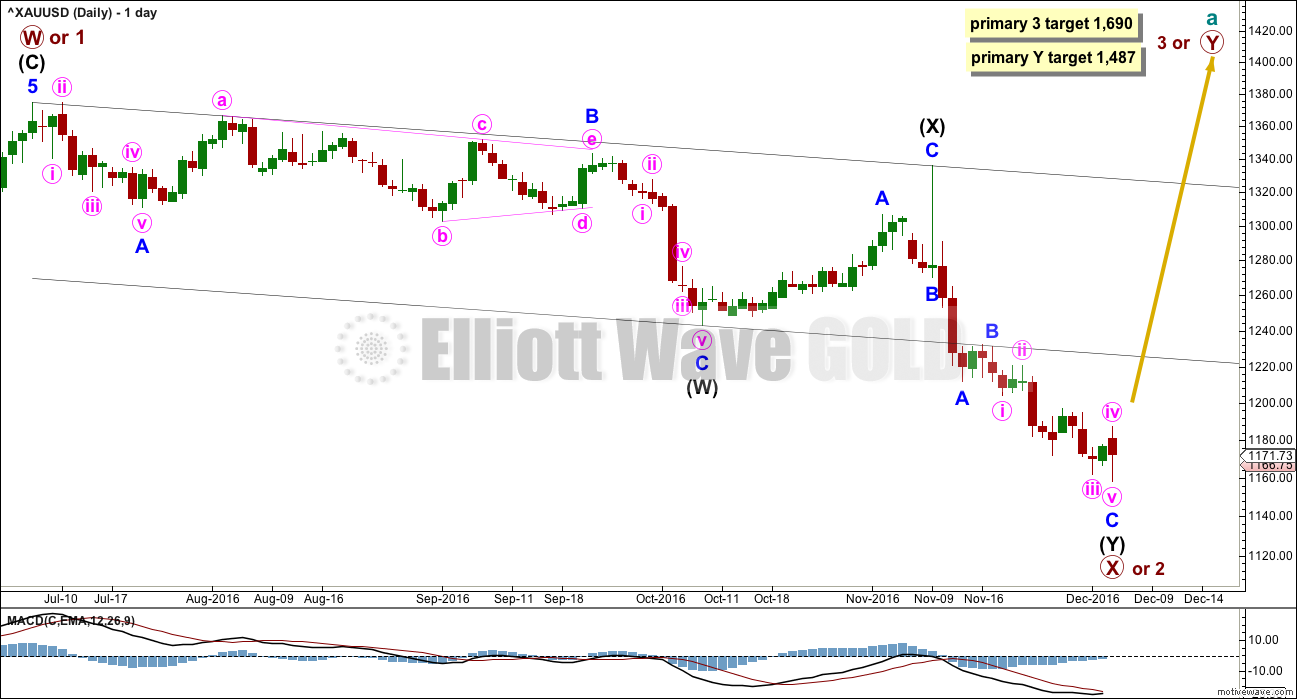
This daily chart works the same way for the two weekly charts in historical analysis. Both weekly charts see downwards movement as an almost complete double zigzag.
The larger structure of primary wave X (or primary wave 2) may be either a double zigzag or a double combination. The second structure in this double for primary wave Y may be either a zigzag (for a double zigzag) or a flat or a triangle (for a double combination).
If the next wave up is primary wave 3, then it may only subdivide as an impulse.
It is my judgement at this stage that it is more likely primary wave X will be a double zigzag due to the relatively shallow correction of intermediate wave (X). Although intermediate wave (X) is deep at 0.71 the length of intermediate wave (W), this is comfortably less than the 0.9 minimum requirement for a flat correction. Within combinations the X wave is most often very deep and looks like a B wave within a flat.
However, there is no minimum nor maximum requirement for X waves within combinations, so both a double zigzag and double combination must be understood to be possible. A double zigzag is more likely and that is how this analysis shall proceed.
Within the second structure, minor wave A should be a five wave structure.
Minor wave B found resistance at the lower edge of the wide parallel channel about primary wave X. Along the way up, price may find resistance at the lower edge of this channel. Resistance at this trend line needs to be overcome for any bullish wave count from here to have a reasonable level of confidence.
Minor wave C may now again be complete at the hourly chart level.
If the next wave up is another zigzag for primary wave Y, then it would reach equality in length with primary wave W at 1,487.
If the next wave up is an impulse for primary wave 3, then it would reach 1.618 the length of primary wave 1 at 1,690.
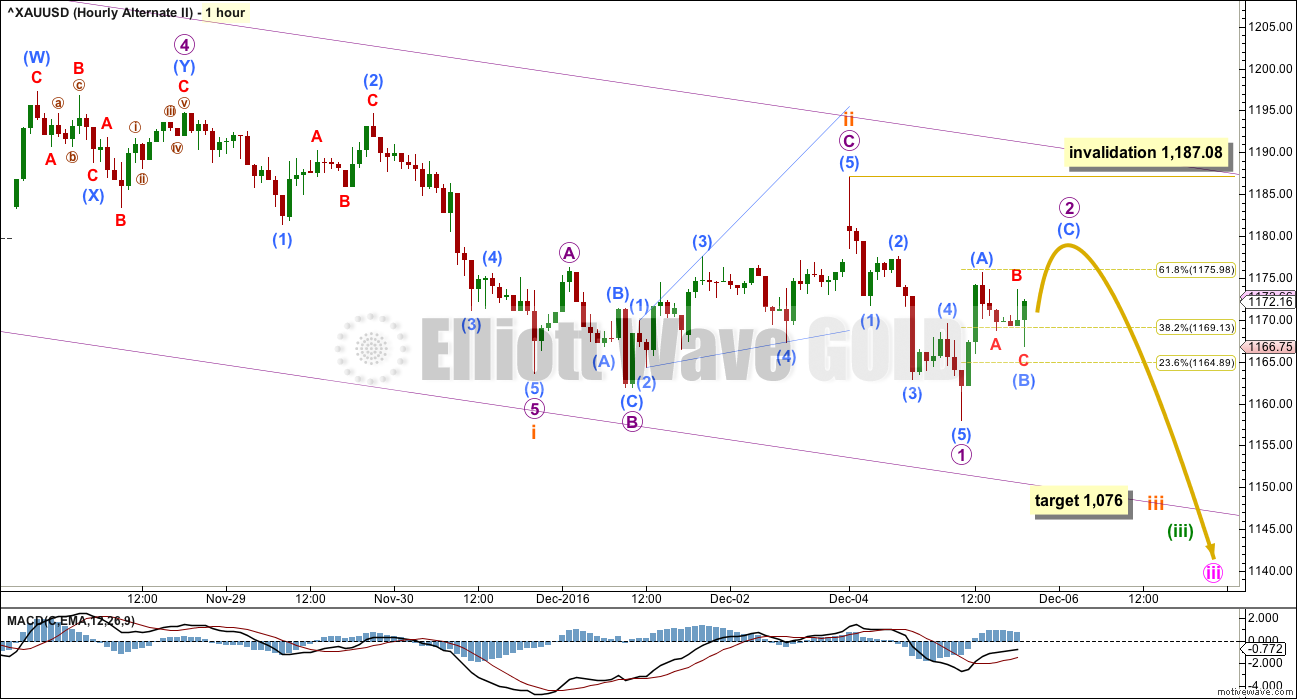
HOURLY ELLIOTT WAVE COUNT
Click chart to enlarge.
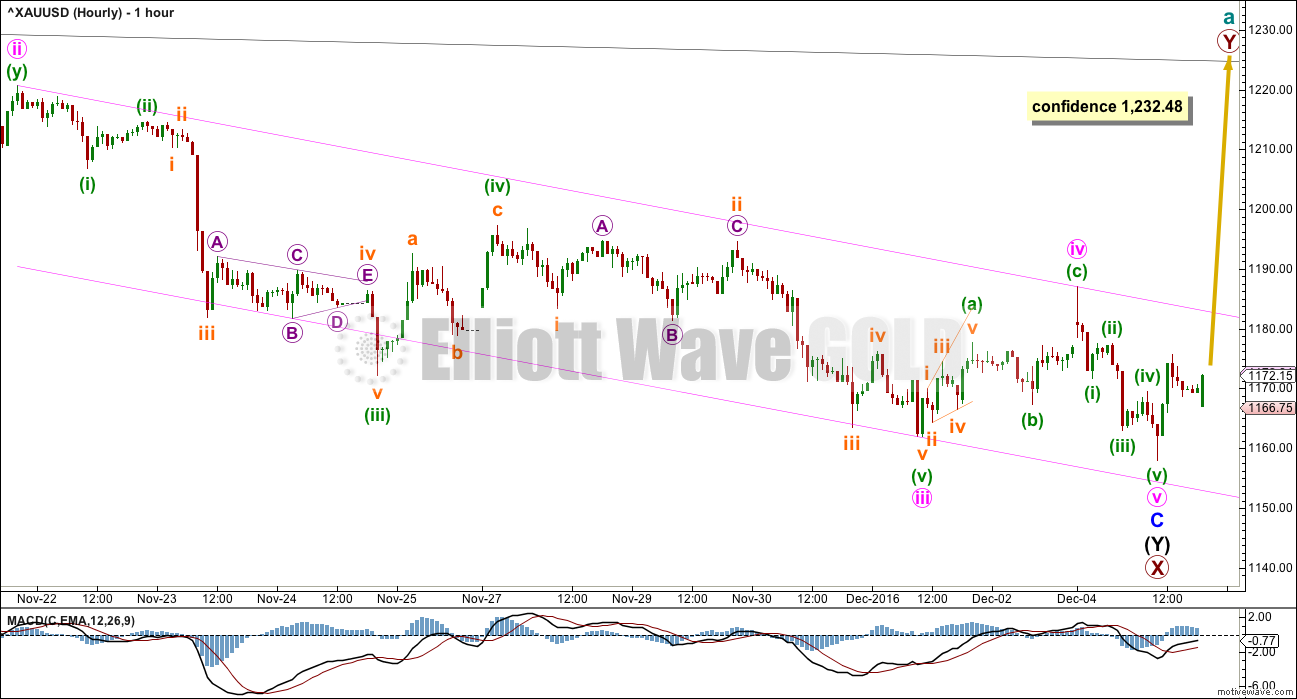
A new low changes the wave count for the short term. There are no Fibonacci ratios between minute waves i, iii and v.
The channel is drawn here using Elliott’s second technique. The upper edge may provide some resistance along the way up. Next resistance may come at the lower edge of the black channel copied over from the daily chart.
The last two lows exhibit divergence between price and MACD. Downwards movement is lacking momentum.
A new high above 1,232.48 would add confidence that there has been a trend change for Gold.
ALTERNATE DAILY ELLIOTT WAVE COUNT
Click chart to enlarge.
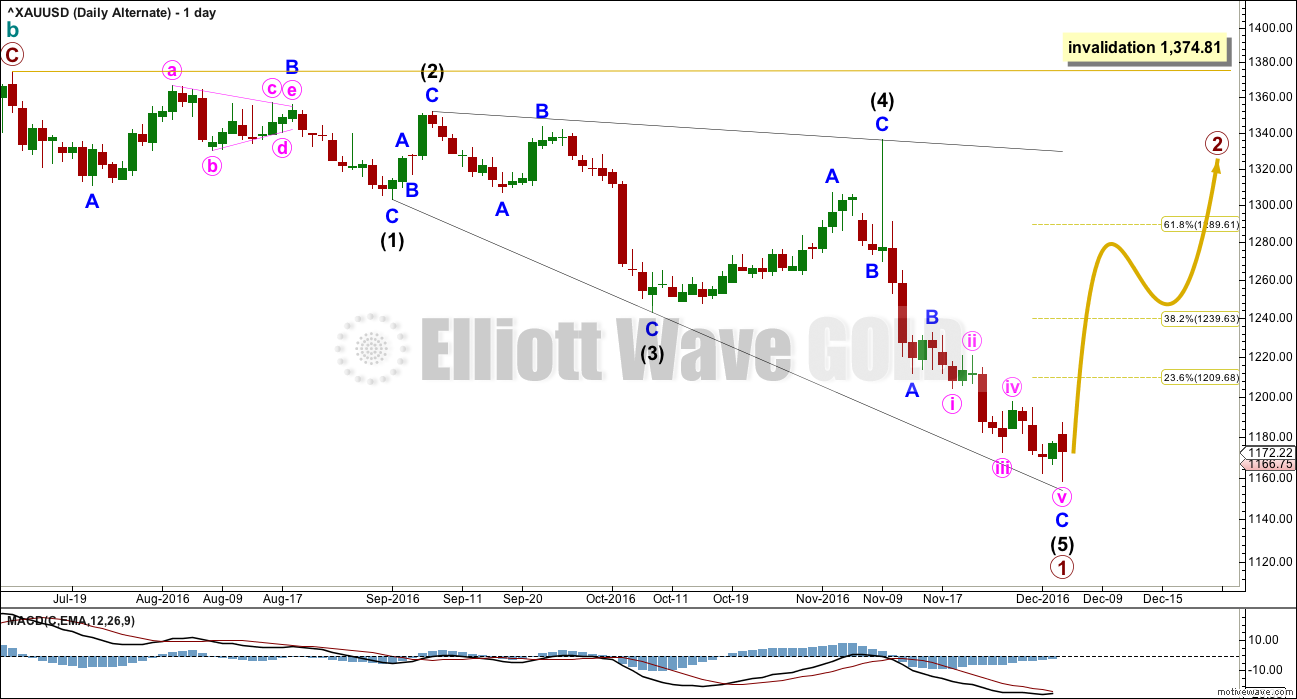
Within leading diagonals, sub-waves 2 and 4 must subdivide as zigzags. Sub-waves 1, 3 and 5 are most commonly zigzags but sometimes may also appear to be impulses.
Within this structure, all sub-waves subdivide as zigzags. This wave count meets all Elliott wave rules. This diagonal looks correct.
This wave count has a lower probability at the daily chart level because leading diagonals are not very common structures for first waves. When first waves do subdivide as leading diagonals, they are most often contracting and not expanding. This wave count does not rely upon a rare structure, but it does rely upon a less common structure.
Primary wave 1 lasted 103 days. Primary wave 2 may initially be expected to last about a Fibonacci 55 or 89 days. It should be a big three wave structure.
At the hourly chart level, this alternate wave count would be essentially the same as the main hourly chart; minor wave C may now be complete.
At this stage, there is no divergence in expected direction between this alternate and the main wave count. The structure of upwards movement, if it is clearly a three or five, may assist to tell us which wave count is correct in coming weeks. For now this alternate must be judged to have a low probability due to the problems outlined. It is published to consider all possibilities.
SECOND ALTERNATE DAILY ELLIOTT WAVE COUNT
Click chart to enlarge.
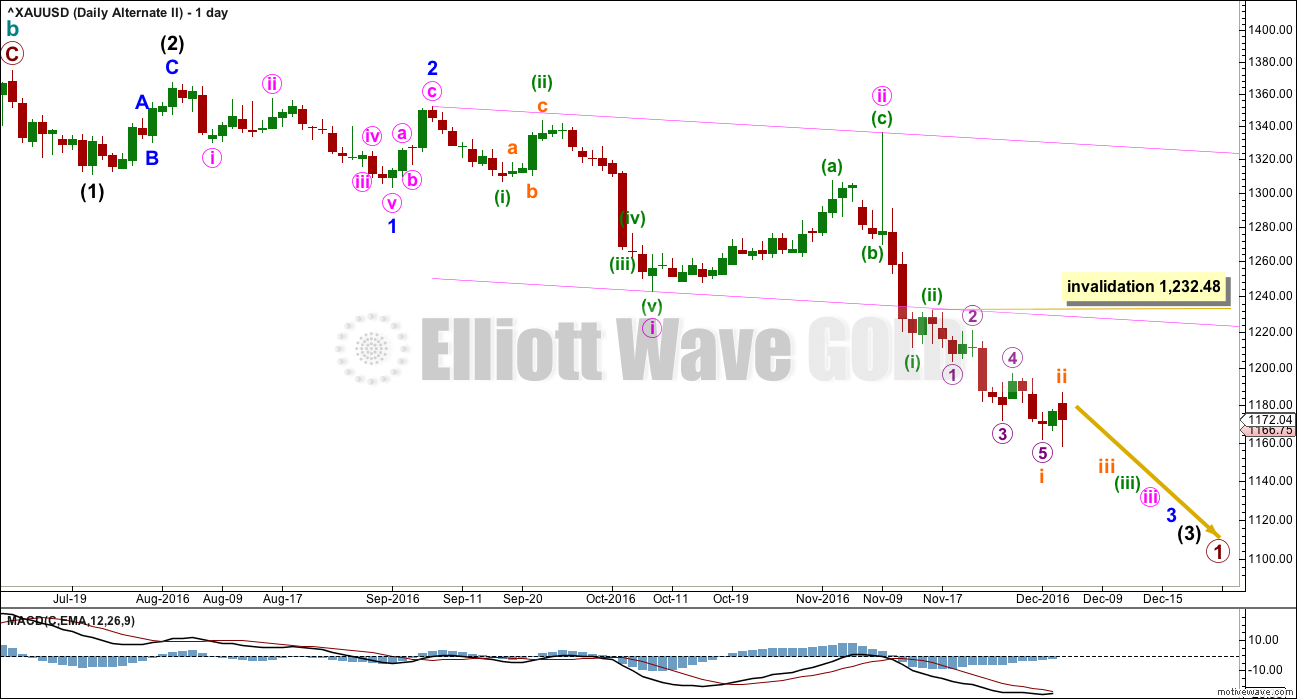
What if a new bear market is underway for cycle wave c? The most likely structure would be an impulse. At this stage, price may be close to the middle of a third wave within primary wave 1 down.
This wave count has a problem of proportion at the daily chart level: minute wave ii lasted 23 sessions and intermediate wave (2) three degrees higher lasted just 8 sessions. Lower degree corrections should be more brief than higher degree corrections. This is not always the case, but when the duration is substantially different then it must necessarily reduce the probability of the wave count.
The pink channel here is a base channel about minute waves i and ii. Price should continue to find resistance at the lower edge of the base channel now that it has breached the channel.
When subminuette wave i is complete, then subminuett wave ii upwards may not move beyond the start of subminuette wave i above 1,232.48.
SECOND ALTERNATE HOURLY ELLIOTT WAVE COUNT
Click chart to enlarge.
If an impulse is developing downwards, then the third wave within it would still be incomplete.
Subminuette wave i may now be complete. Subminuette wave ii may also now be complete. If it is, then it would have been relatively brief and shallow. This may be reasonable considering this wave count sees Gold in a third wave now at at least four degrees. So corrections may now begin to be more brief and shallow as the power of a third wave down pulls strongly.
Subminuette wave ii was only 0.34 the depth of subminuette wave i.
Micro wave 2 should be relatively shalllow also, but so far it is already 0.618 the length of micro wave 1 and the structure is incomplete.
The lack of momentum is very concerning now for this wave count. Momentum should be building as price approaches the middle of a big third wave, but it is not. This wave count looks wrong and forced. It is published to consider all possibilities.
At 1,076 subminuette wave iii would reach 1.618 the length of subminuette wave i.
TECHNICAL ANALYSIS
WEEKLY CHART
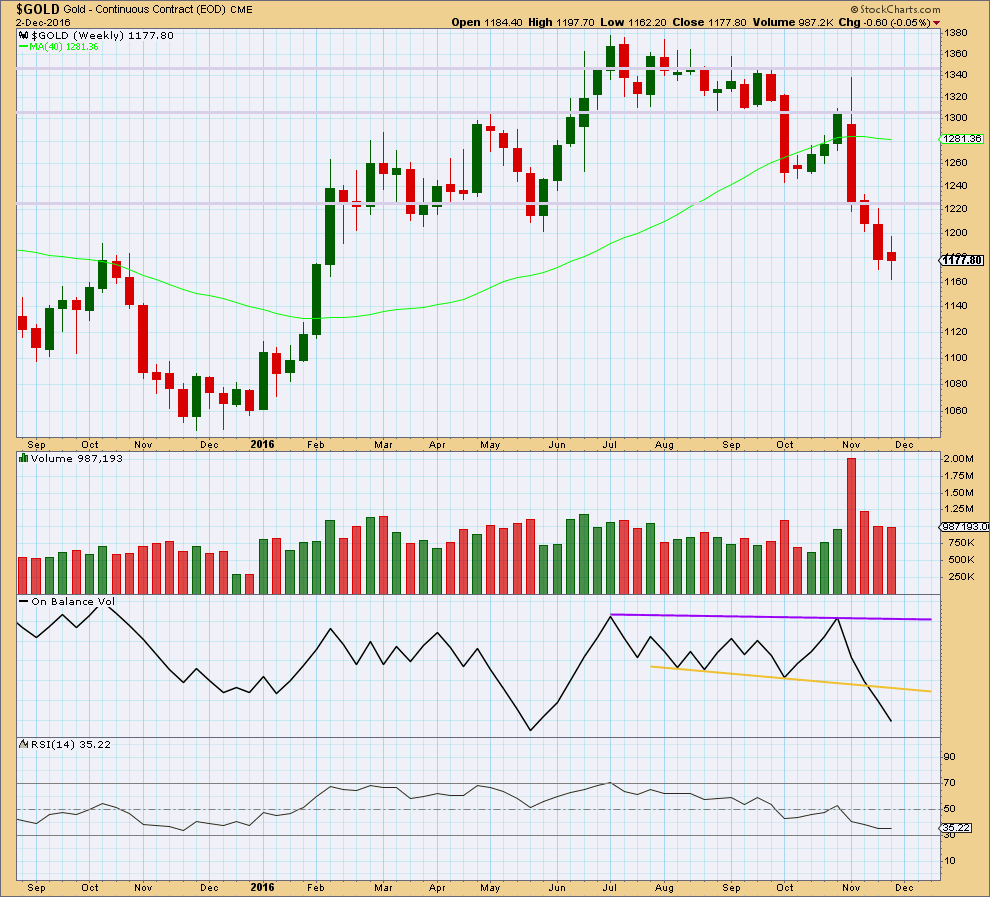
Click chart to enlarge. Chart courtesy of StockCharts.com.
The spinning top candlestick for last week comes with slightly lighter volume. The fall in price does not have as much support from volume. Bears are tiring.
The small real body of last week’s candlestick makes it a spinning top. This puts the trend from down to neutral at this stage. The bears are losing momentum.
There is no support line here for On Balance Volume at the weekly chart level.
RSI is not extreme at the weekly chart level and exhibits no divergence with price to indicate weakness here. There is still room for price to fall.
DAILY CHART
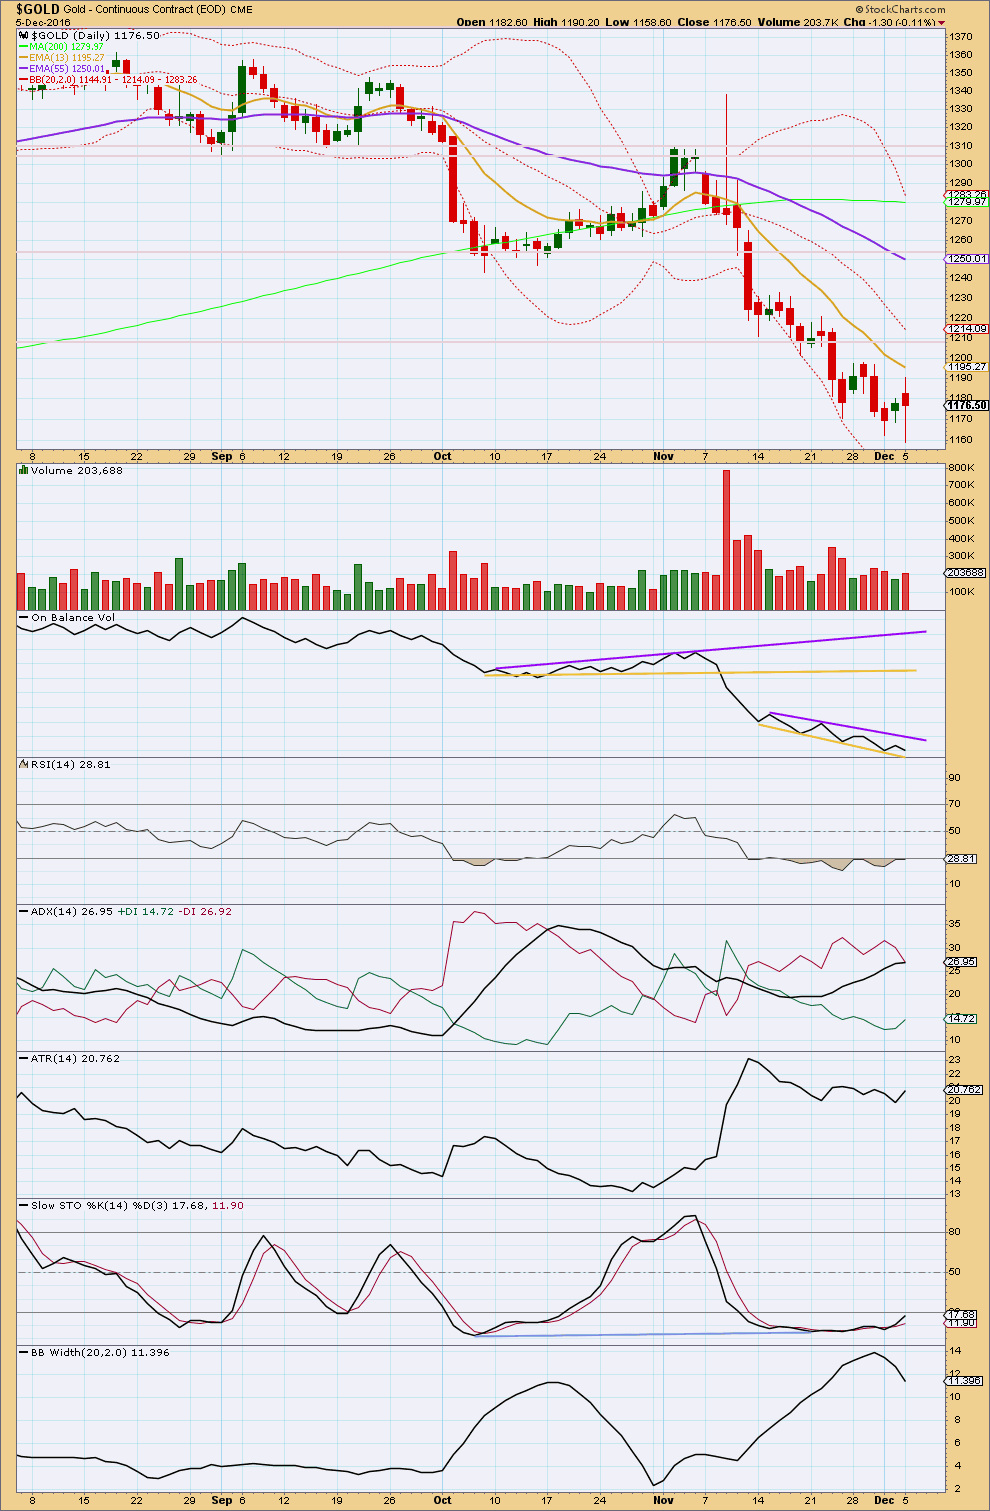
Click chart to enlarge. Chart courtesy of StockCharts.com.
The long lower wick on today’s candlestick is bullish.
The balance of volume was downwards and volume was slightly higher than the prior upwards day. This is bearish.
There is slight divergence today with the new low from price and a slightly higher low for On Balance Volume. OBV has not found support today. A break above the purple line would be a bullish signal. A break below the yellow line would be a bearish signal.
There is now double divergence between price and RSI at recent lows, and RSI is still oversold. This is very bullish.
ADX is today flat indicating no clear trend. ATR is still overall flat in agreement with ADX. Bollinger Bands continue to contract.
Stochastics is still oversold and now exhibits multiple divergence with price.
It looks increasingly like Gold is finding a low. It is still unclear whether the next movement is going to be a consolidation or a new upwards trend.
GDX DAILY CHART
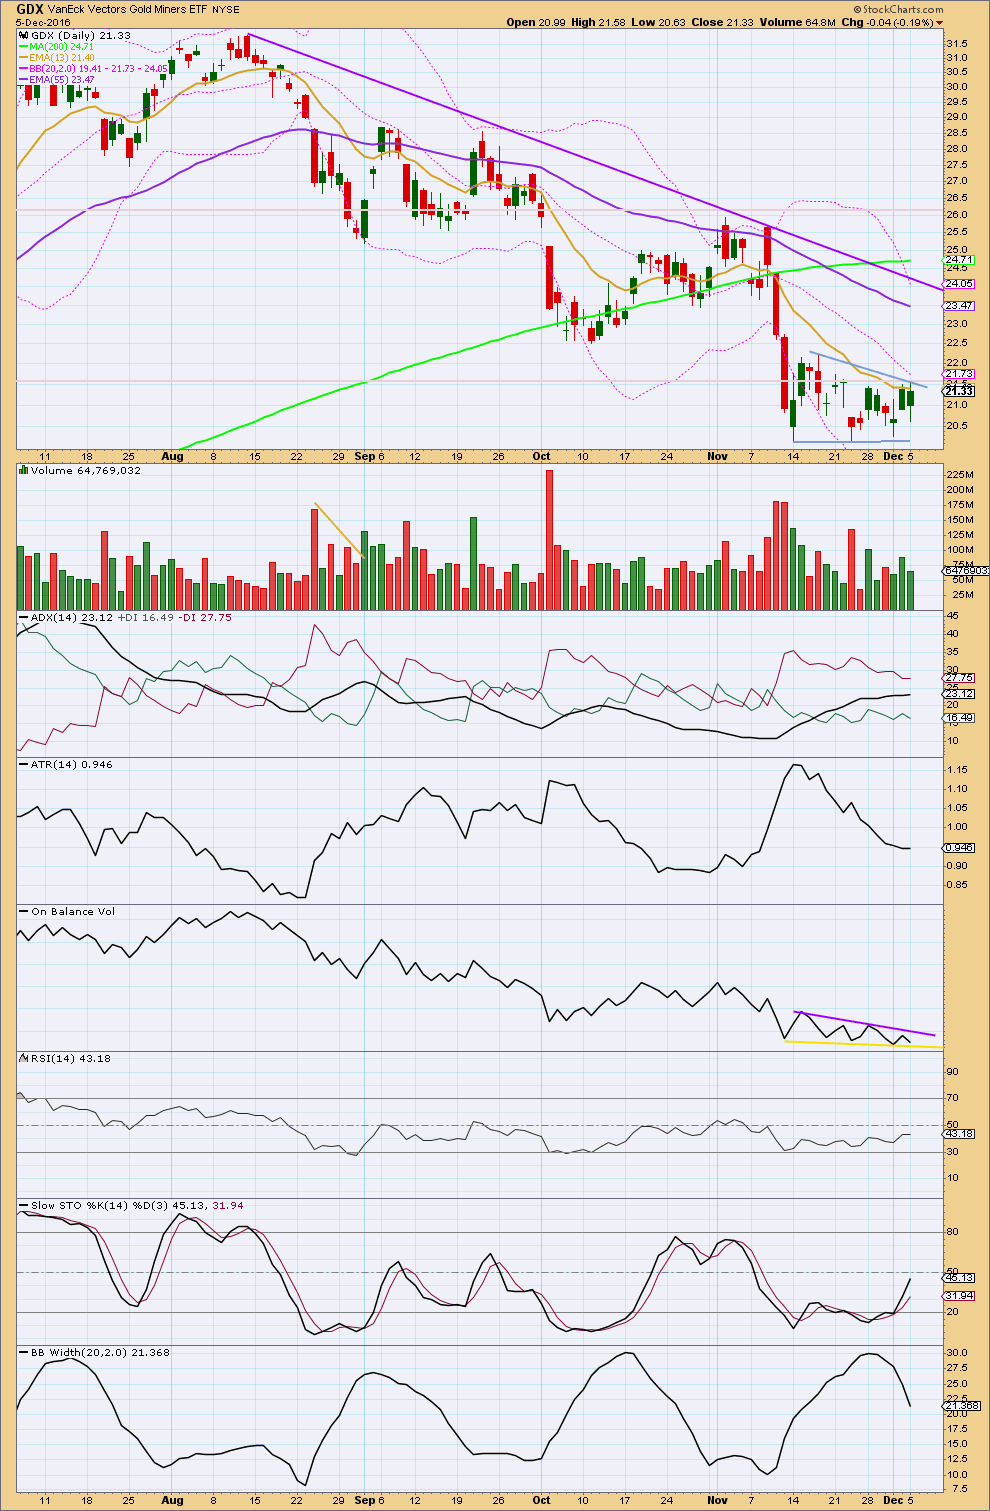
Click chart to enlarge. Chart courtesy of StockCharts.com.
The trend line along the top of the consolidation pattern is redrawn today. This now looks like a possible bear flag unfolding. Volume continues to decline as price moves sideways.
The most likely direction for price to break out of this pattern would be downwards; flags are continuation patterns. On Balance Volume should still be watched carefully; it may break out before price indicating the next direction.
ADX is still slightly increasing, indicating there is a downwards trend in place. This is a lagging indicator and this is one instance where the lag means it is giving an incorrect signal. Price is not trending and has been moving sideways for 14 days now. ATR is declining and Bollinger Bands are contracting, indicating the market is consolidating.
The consolidation has brought Stochastics back up from oversold. There is room for price to fall again.
This analysis is published @ 08:41 p.m. EST.
This is my interpretation of the triangle – still more downwards to come perhaps?
Wave E of a contracting triangle may not move beyond the end of wave C. This one does.
There’s a video on triangles on the education page that you may find helpful.
With an inside day so far, a breakout will likely follow. Could be twinkling of a ray of hope for the bulls in the twilight in the new banner pic Lara has put up? IMO with a slow down in momentum seems to suggest maybe no more than a bull fake rally to shake off some oversold conditions before continuing on further south. Lets see how this plays out.
The new banner pic up today is a pic Cesar took in Costa Rica, years ago.
We put our Christmas tree up last night. Getting all geared up for Christmas which I love so so much! The house smells of pine and I get to eat Christmas food 🙂
A comment about a possible triangle:
It initially does look like a triangle is part of the sideways movement today. But when you play with this idea on the five minute chart (so you can see the subdivisions of the waves) you’ll find it doesn’t work with the trend lines.
Triangles normally adhere very well indeed to their trend lines.
Wave E most often undershoots the A-C trend line, but sometimes overshoots.
This is the best way I can figure a possible triangle in there, but as you can see the A-C trend line is overshot multiple times before E.
Pulling D to the left means the B-D trend line is not adhered to. Pulling it to the right leaves the same problem with the A-C trend line.
Conclusion: no triangle. It’s something else.
I think minute ii may end close to the 0.618 Fibonacci ratio of minute i at 1,164.75. Or below.
The first one, two and sometimes three corrections within a new trend for Gold are often very deep.
That is IF this is the correct wave count.
Continuous side way action must be developing huge energy for breakout up/down?????
It better be up!
I think we are now in C down of an ABC wave 2
I agree.
James Flanagan GANN Global Cycle is a buyer in XAU.
http://www.gannglobal.com/webinar/2016/December/16-12-321goldEnergy-MetalsUpdate.php
Off topic:
I can´t see that there are any comments written for US-Oil. But there are 17 and no possibility to comment? What is this?
They have the comments set to auto close after 7 days. If Lara hasn’t done the new analysis yet then you can’t post under oil until the new analysis is posted. You can still read the 17 comments by opening the post.
Thank you!
I’ll be updating Oil again today.
yep, triangle is a terminal move, so does this mean that we are going down?
Sometimes a triangle is a B or X wave of a corrective move. Let’s hope this morphs into an ABC or WXY for a wave 2.
A triangle cannot be the sole structure in a second wave.
I think the triangle is the C wave of 2: 1175.61 – 1166.75 – 1175.00 – triangle.
Once the triangle is done, price should break upwards.
Sorry. I had deleted the above post but somehow it is still showing.
It contains a terrible error. The triangle is the A wave, followed very quickly by a B. Now we are in the C wave down.
A waves can’t be triangles though.
Nor can they be W waves, so we can’t label this a combination W-X-Y with a triangle as the first structure.
Having said that, it really really does look like a triangle there, doesn’t it!
C wave targets 1165.31 (1.618 of current B) or 1164.75 (0.618 of 1st wave, 1 degree higher). Currently C wave is in the third subwave down.
In one hour is there a triangle a,b,c,d,e?????
D at 1174.388 and gold price breached with a spike above D to 1174.87.
GDX may slowly be attempting a move upward. MACD has crossed positive. GDX continues to make higher lows as gold has made lower lows.
Lots of overhead resistance ahead. Need to see more volume to support a move up. Watch GDX behavior near 22.50. A small pullback would be bullish and a strong reversal will be bearish.