
Short term downwards movement was expected. Price is now within the target range.
Summary: Monday may begin with a slight new low to 1,156 – 1,154. Thereafter, an upwards wave should develop as part of a consolidation. The consolidation may last a total of five, eight or thirteen days and may end about 1,211.60 to 1,232.48.
New updates to this analysis are in bold.
Grand SuperCycle analysis is here.
MONTHLY ELLIOTT WAVE COUNT
Click chart to enlarge.
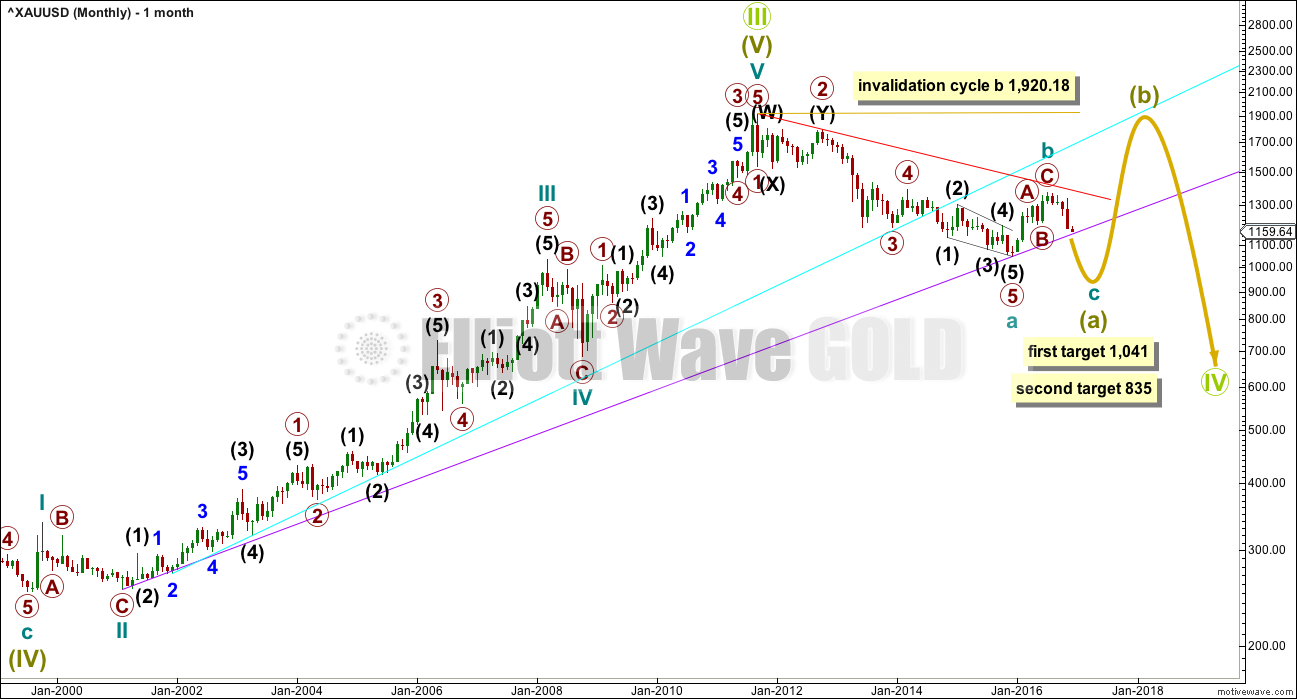
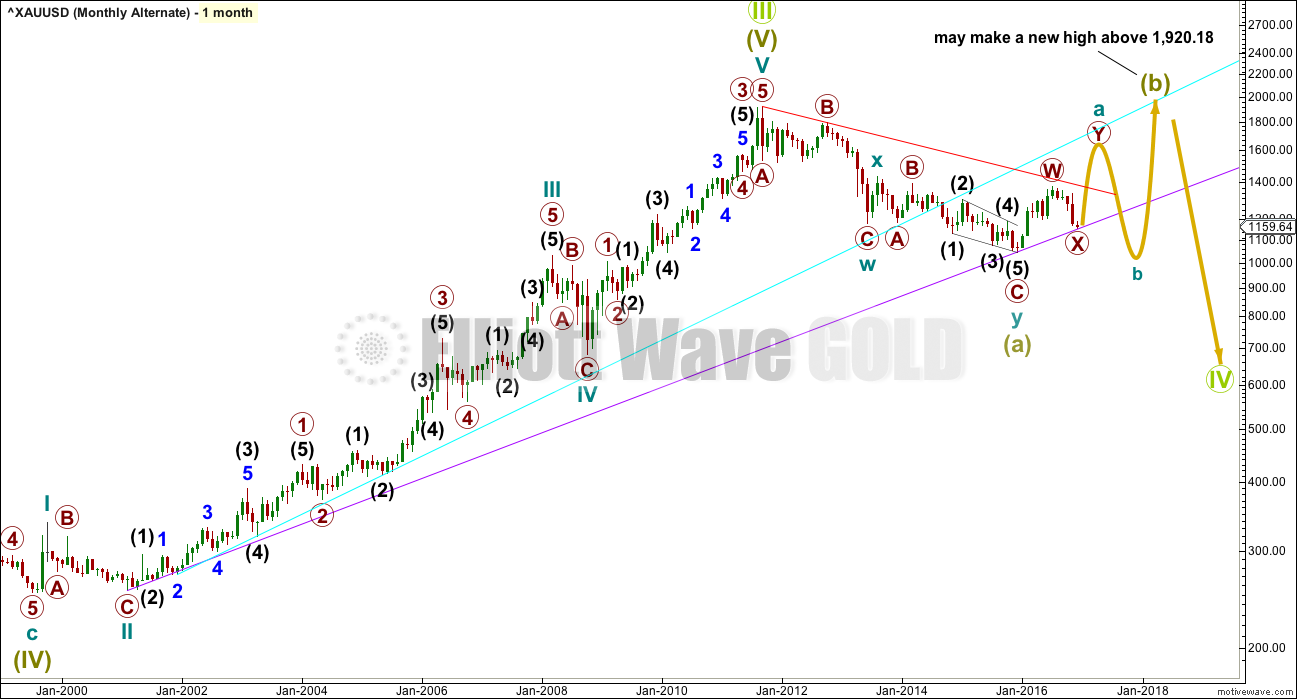
It is possible to see the large downwards wave from the all time high as a five wave structure. Super Cycle wave (a) may be an incomplete zigzag, to subdivide 5-3-5.
If primary wave 2 is seen as a longer lasting double combination, then the prior problems with the base channel and proportion are resolved.
Primary wave 1 lasted 3 weeks. Primary wave 2 lasted 51 weeks. Primary wave 2 is a deep 0.65 double combination.
Primary wave 3 lasting 66 weeks is 20.84 short of 1.618 the length of primary wave 1. The close Fibonacci ratio is lost, but this is less than 10% the length of primary wave 3 and so I consider it close enough to say a ratio exists.
Primary wave 4 lasts just 11 weeks and is a shallow 0.35 zigzag. The disproportion between primary waves 2 and 4 is reasonably acceptable; zigzags do tend to be quicker structures than combinations.
Primary wave 5 is an ending contracting diagonal lasting a Fibonacci 89 weeks exactly.
If cycle wave a is a five, then cycle wave b may not move beyond its start above 1,920.18. Cycle wave b may now be a complete single zigzag ending just below the 0.382 Fibonacci ratio of cycle wave a. Cycle wave b is 0.376 the length of cycle wave a. Cycle wave b may have ended close to resistance at the red trend line.
At 1,041 cycle wave c would reach 0.382 the length of cycle wave a. If price keeps falling through this first target, then the next target would be at 835 where cycle wave c would reach 0.618 the length of cycle wave a.
A new support line is added in purple. This is copied over to the weekly chart below.
WEEKLY ELLIOTT WAVE COUNT
Click chart to enlarge.
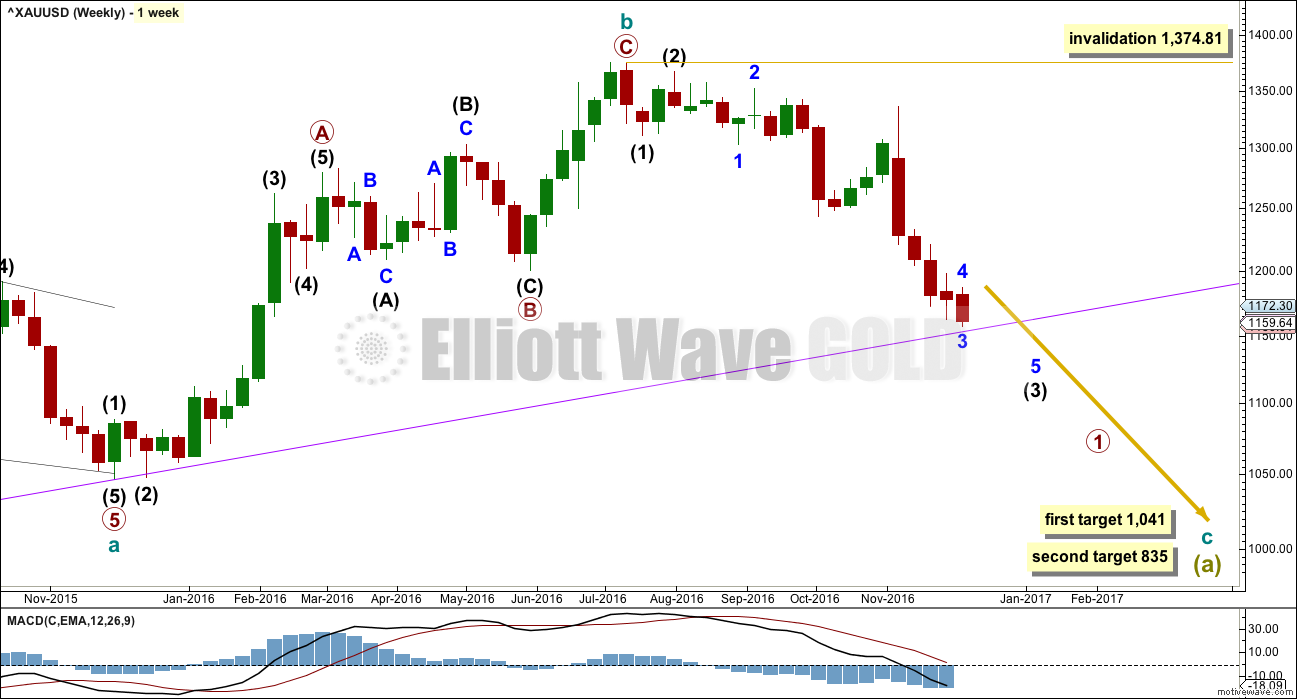
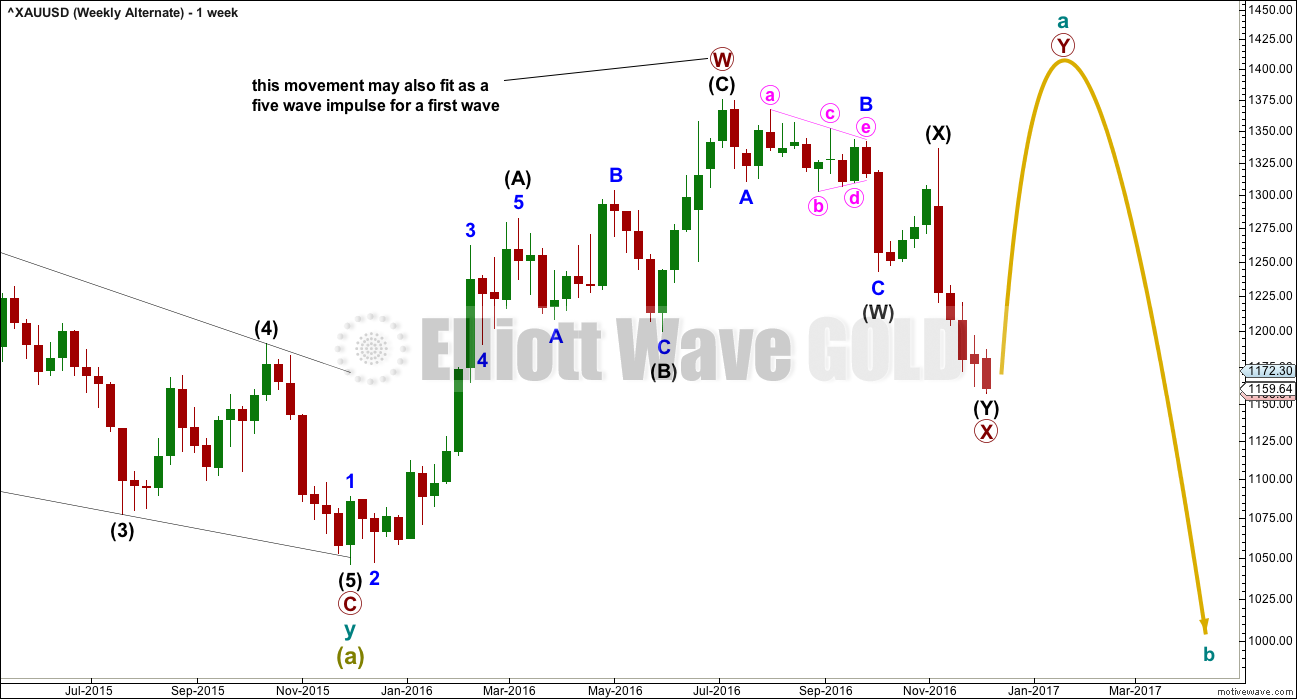
If the last high was a trend change at cycle degree, then a five wave structure downwards should develop from there.
Cycle wave c must subdivide as a five wave structure. It may be either an impulse or ending diagonal. Within cycle wave c, the first wave of primary wave 1 must also be a five, either an impulse or a leading diagonal.
When primary wave 1 is complete, then the following correction for primary wave 2 would be expected to be deep, most likely a 0.618 retracement of primary wave 1. Primary wave 2 may not move beyond the start of primary wave 1 above 1,374.81.
DAILY ELLIOTT WAVE COUNT
Click chart to enlarge.
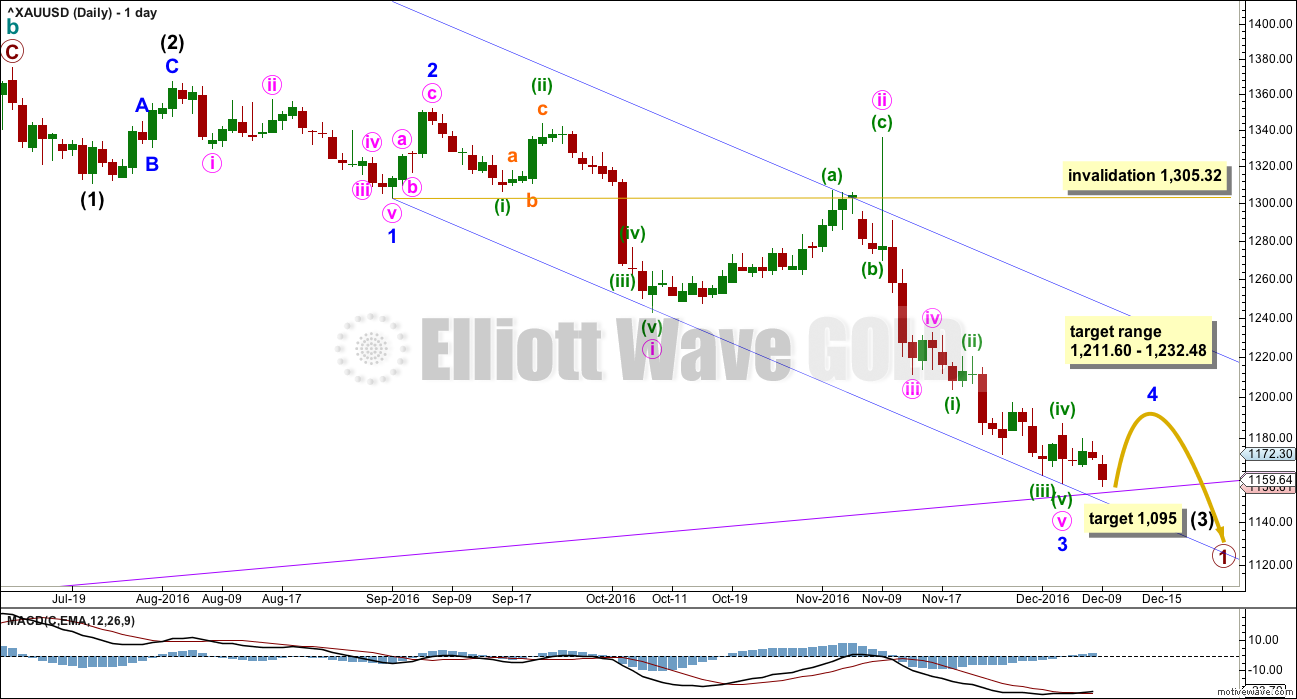
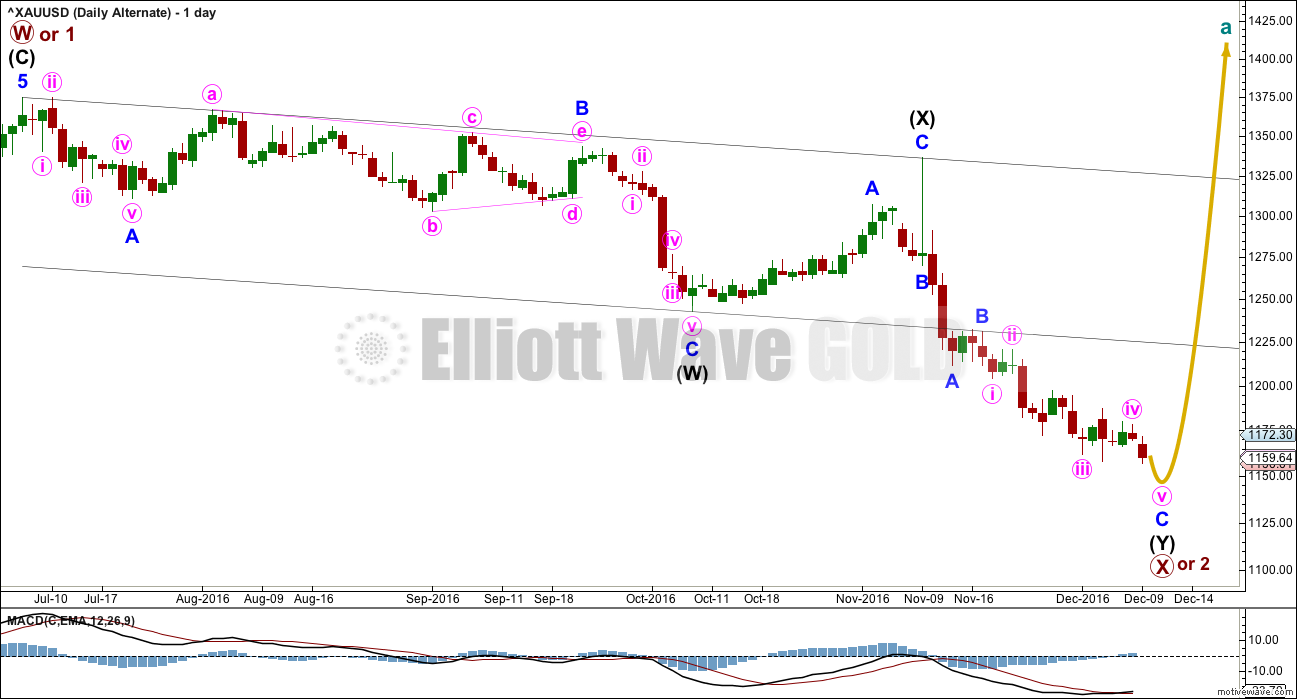
Price may be now moving into a small consolidation for minor wave 4.
The middle of the third wave may be complete for primary wave 1.
This wave count still suffers from a problem of disproportion between minute wave ii and the two prior second wave corrections one and two degrees higher. Minute wave ii should be quicker than minor wave 2 and especially intermediate wave (2). The fact that it is not must reduce the probability of this wave count.
If minor wave 3 is over, then it has no Fibonacci ratio to minor wave 1.
Ratios within minor wave 3 are: minute wave iii has no Fibonacci ratio to minute wave i, and minute wave v is 2.52 short of 0.618 the length of minute wave iii.
Minute wave v fits as a five wave impulse on the hourly chart even though it does not look quite right on the daily chart.
The blue channel here is a best fit. Draw the first trend line from the ends of minor waves 1 to 3, then push a parallel copy up to contain most of this movement except the spike for minute wave ii. Minor wave 4 may find resistance at the upper edge of the channel if it gets that high.
Minor wave 2 was a deep 0.77 zigzag lasting four days. Minor wave 4 may be a more shallow flat, combination or triangle. These tend to be longer lasting structures than zigzags, so at this early stage an expectation of a Fibonacci five, eight or thirteen sessions would be reasonable. So far it has lasted just four.
Minor wave 4 may end within the price territory of the fourth wave of one lesser degree. Minute wave iv has its range from 1,211.60 to 1,232.48. If this expectation is wrong, it may be too high; minor wave 4 may be more shallow.
Minor wave 4 may not move into minor wave 1 price territory above 1,305.32.
The target for intermediate wave (3) is at 1,095 where it would reach 4.236 the length of intermediate wave (1).
HOURLY ELLIOTT WAVE COUNT
Click chart to enlarge.
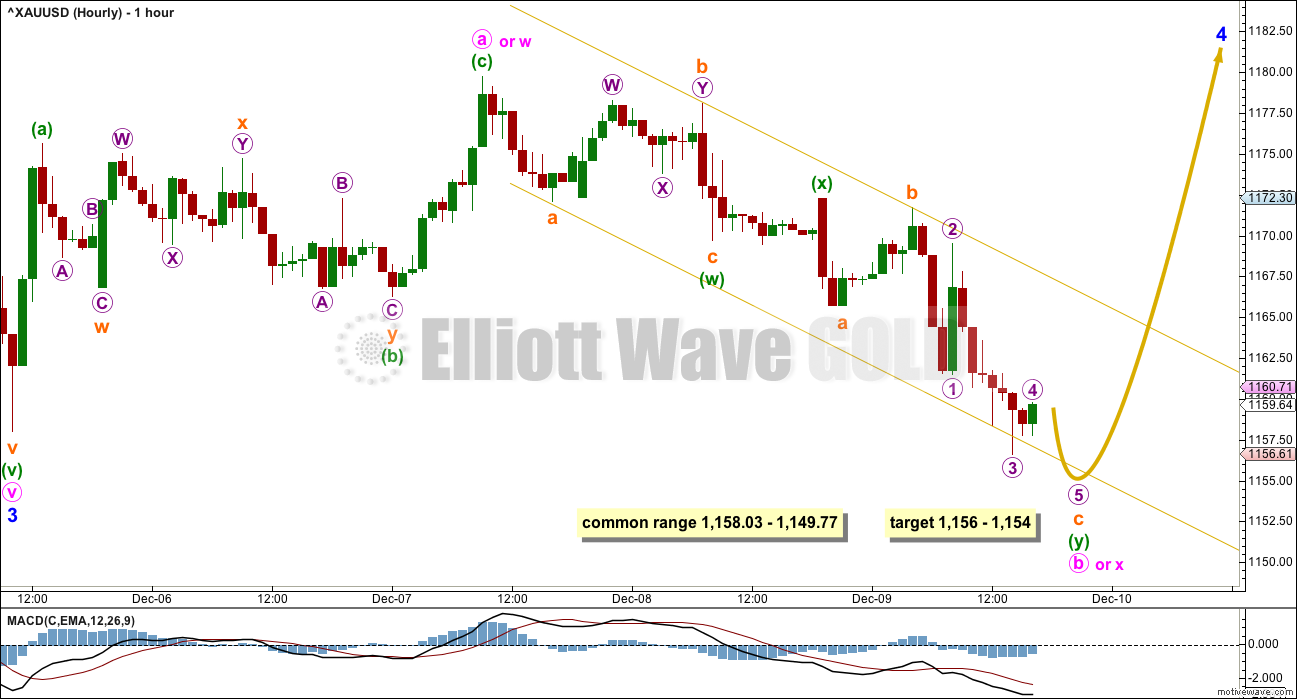
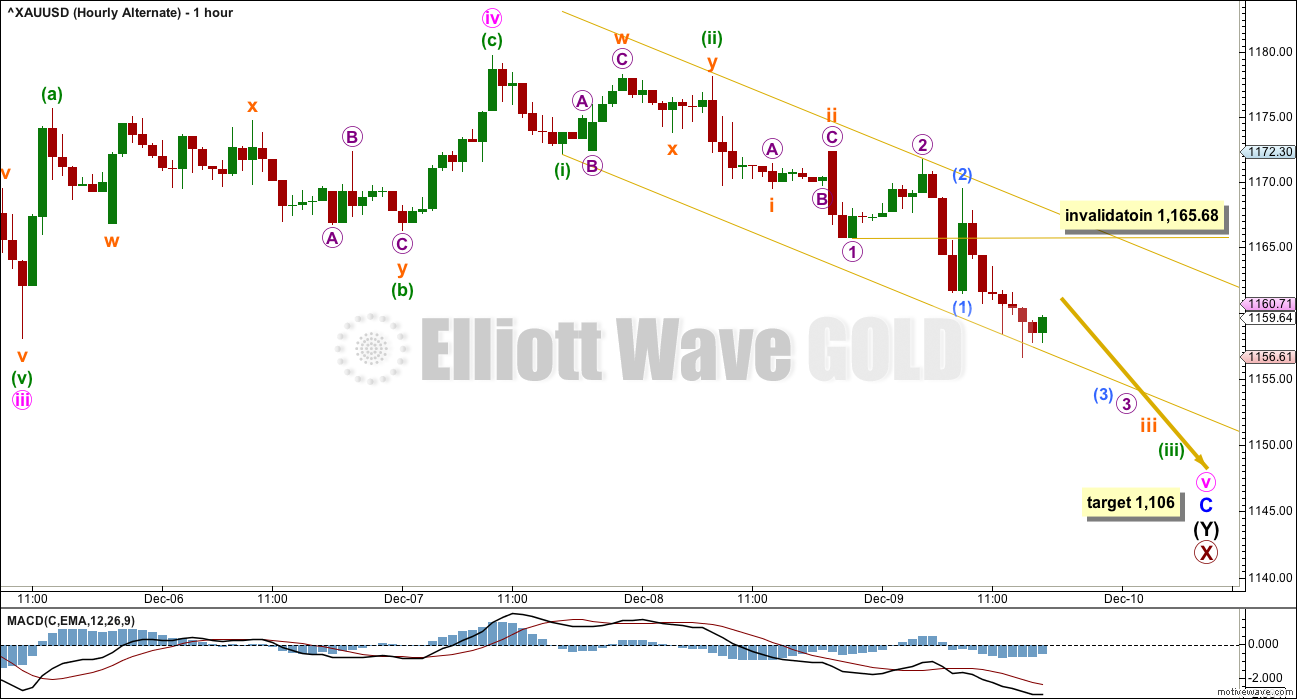
Minor wave 4 is least likely to unfold as a zigzag, so it is unlikely at this stage to be over at the high labelled minute wave a.
If minor wave 4 unfolds as the most likely flat, combination or triangle, then within it minute wave a is most likely to be a zigzag. This may now be complete.
When A waves subdivide as threes, there is no invalidation point for the following B wave because they may make new price extremes beyond the start of the A wave as in expanded flats and running triangles. The most common range for minute wave b would be from 1 to 1.38 the length of minute wave a at 1,158.03 to 1,149.77.
If minor wave 4 unfolds as a flat correction, then within it the minimum requirement for minute wave b is 0.9 the length of minute wave at at 1,155.62. This has now been met.
If minor wave 4 unfolds as a triangle, then there is no minimum nor maximum length for minute wave b within it. It must only subdivide as a three. Minor wave 4 may be unfolding as a running triangle.
If minor wave 4 unfolds as a combination, then the first structure within the combination may be a complete zigzag labelled minute wave w. The double combination now should be joined by a three in the opposite direction labelled minute wave x. There is no minimum nor maximum for X waves within combinations. X waves must only subdivide as corrective structures, which may subdivide as any corrective structure including multiples.
Overall, this wave count expects to see for several more days choppy overlapping movement that may include a new low (but it does not have to make a new low). It is impossible to tell at this stage which Elliott wave structure minor wave 4 will complete as, only to say it is least likely to be a zigzag. There are still over 20 possible structures it may be, so it must be understood that as it continues this analysis at the hourly chart level must be flexible and that the labelling of minor wave 4 will change in coming days.
I have spent some considerable time today on the downwards movement labelled minute wave b. This will not fit as a single zigzag, so it is still labelled as a double zigzag. This has the best fit. The second zigzag in the double may be almost complete and within it subminuette wave c must subdivide as a five wave structure. So far it looks like an impulse. Within the impulse, micro wave 4 may not move into micro wave 1 price territory above 1,161.49. In the very short term, a new high above 1,161.49 may not be a fourth wave correction, which means subminuette wave c would have to be over. This would add a little confidence to seeing a low in place, at least short to mid term.
At 1,156 minuette wave (y) would reach 1.618 the length of minuette wave (w). At 1,154 subminuette wave c would reach 1.618 the length of submineutte wave a. This gives a $2 target zone for one more low to compete minute wave b.
ALTERNATE MONTHLY ELLIOTT WAVE COUNT
Click chart to enlarge.
The large wave down labelled Super Cycle wave (a) may be seen either as a three or a five. This alternate monthly chart sees it as a three.
If Super Cycle wave (a) is a three, then Super Cycle wave (b) may make a new high above its start at 1,920.18.
The larger structure is seen as Grand Super Cycle wave IV. When a fourth wave begins with a three wave structure for its A wave, then a flat, combination or triangle is indicated. In this case, with Super Cycle wave (a) a double zigzag, a combination for Grand Super Cycle wave IV may be eliminated because multiples may not subdivide into multiples. This leaves two possible structures for Grand Super Cycle wave IV: a flat or a triangle.
If Grand Super Cycle wave IV is unfolding as a flat correction, then within it Super Cycle wave (b) must retrace a minimum 0.9 length of Super Cycle wave (a) at 1,832.78.
If Grand Super Cycle wave IV is unfolding as a triangle, then there is no minimum requirement for Super Cycle wave (b) within it. While there is no minimum, Super Cycle wave (b) is highly unlikely to be over here because it should be deeper. A common range for subwaves of triangles is about 0.8 to 0.85 the prior wave; this is from 1,745 to 1,789. For a triangle to have the right look, Super Cycle wave (b) should be only about half way through.
Super Cycle wave (b) must subdivide as a three wave structure.
If the large wave down from the all time high is seen as a double zigzag, then the proportions are good and all subdivisions fit perfectly.
The first zigzag in the double is labelled cycle wave W. Within cycle wave W, primary wave B is a combination and primary wove C is just 8.49 short of 1.618 the length of primary wave A.
The double is joined by a brief shallow three in the opposite direction labelled cycle wave X. X waves within double zigzags are normally very brief and shallow, so it is okay that this one lasted just 8 weeks. Duration of waves is a rough guideline only and sometimes corrections are quicker than impulses.
The second zigzag in the double labelled cycle wave y exhibits no Fibonacci ratio to the first zigzag labelled cycle wave w. Within cycle wave y, there is no Fibonacci ratio between primary waves A and C, primary wave B is an expanded flat correction, and primary wave C is an ending contracting diagonal.
WEEKLY ELLIOTT WAVE COUNT
Click chart to enlarge.
The wave up from the low on the 3rd of December, 2015, fits best as a three and looks like a zigzag. It is possible that it may be a five.
If cycle wave a is subdividing as a three, it may be an incomplete double zigzag. The first zigzag in the double is labelled primary wave W and the double is joined by an incomplete three in the opposite direction labelled primary wave X.
The maximum number of corrections within multiple corrective structures is three. To label multiples within multiples increases the maximum beyond three violating the rule. Within each of W, Y and Z, they may only be labelled simple corrective structure A-B-C (or A-B-C-D-E in the case of triangles). X waves however are not included in the maximum; they are joining structures in the opposite direction and may subdivide as any corrective structure including multiples.
Primary wave X has now moved below the end of intermediate wave (B) within primary wave W. It is my judgement that this reduces the probability of this wave count although no rules nor guidelines are broken. There is no rule stating a limit for X waves within double zigzags or double combinations, but within double zigzags the X wave is usually very brief and shallow and this one is now neither.
ALTERNATE DAILY ELLIOTT WAVE COUNT
Click chart to enlarge.
The larger structure of primary wave X (or primary wave 2) may be either a double zigzag or a double combination. The second structure in this double for primary wave Y may be either a zigzag (for a double zigzag) or a flat or a triangle (for a double combination).
If the next wave up is primary wave 3, then it may only subdivide as an impulse.
It is my judgement at this stage that it is more likely primary wave X will be a double zigzag due to the relatively shallow correction of intermediate wave (X). Although intermediate wave (X) is deep at 0.71 the length of intermediate wave (W), this is comfortably less than the 0.9 minimum requirement for a flat correction. Within combinations the X wave is most often very deep and looks like a B wave within a flat.
However, there is no minimum nor maximum requirement for X waves within combinations, so both a double zigzag and double combination must be understood to be possible. A double zigzag is more likely and that is how this analysis shall proceed.
Within the second zigzag of primary wave X, intermediate wave (Y) is now incomplete at the hourly chart level. At 1,106 minor wave C would reach equality in length with minor wave A.
ALTERNATE HOURLY ELLIOTT WAVE COUNT
Click chart to enlarge.
There is so much overlapping within the downwards wave labelled minute wave v, it is not possible to see this as either a complete impulse nor a complete ending diagonal. The conclusion must be that more downwards movement is required to complete the structure if this alternate wave count is correct.
The gold channel is a best fit about downwards movement. The overshoot at the end of Friday’s session looks like a small capitulation spike, which does not add confidence to this wave count.
This wave count expects to see an increase in downwards momentum on Monday as a third wave down at four degrees completes.
Micro wave 4 may not move into micro wave 1 price territory above 1,165.68.
TECHNICAL ANALYSIS
WEEKLY CHART

Click chart to enlarge. Chart courtesy of StockCharts.com.
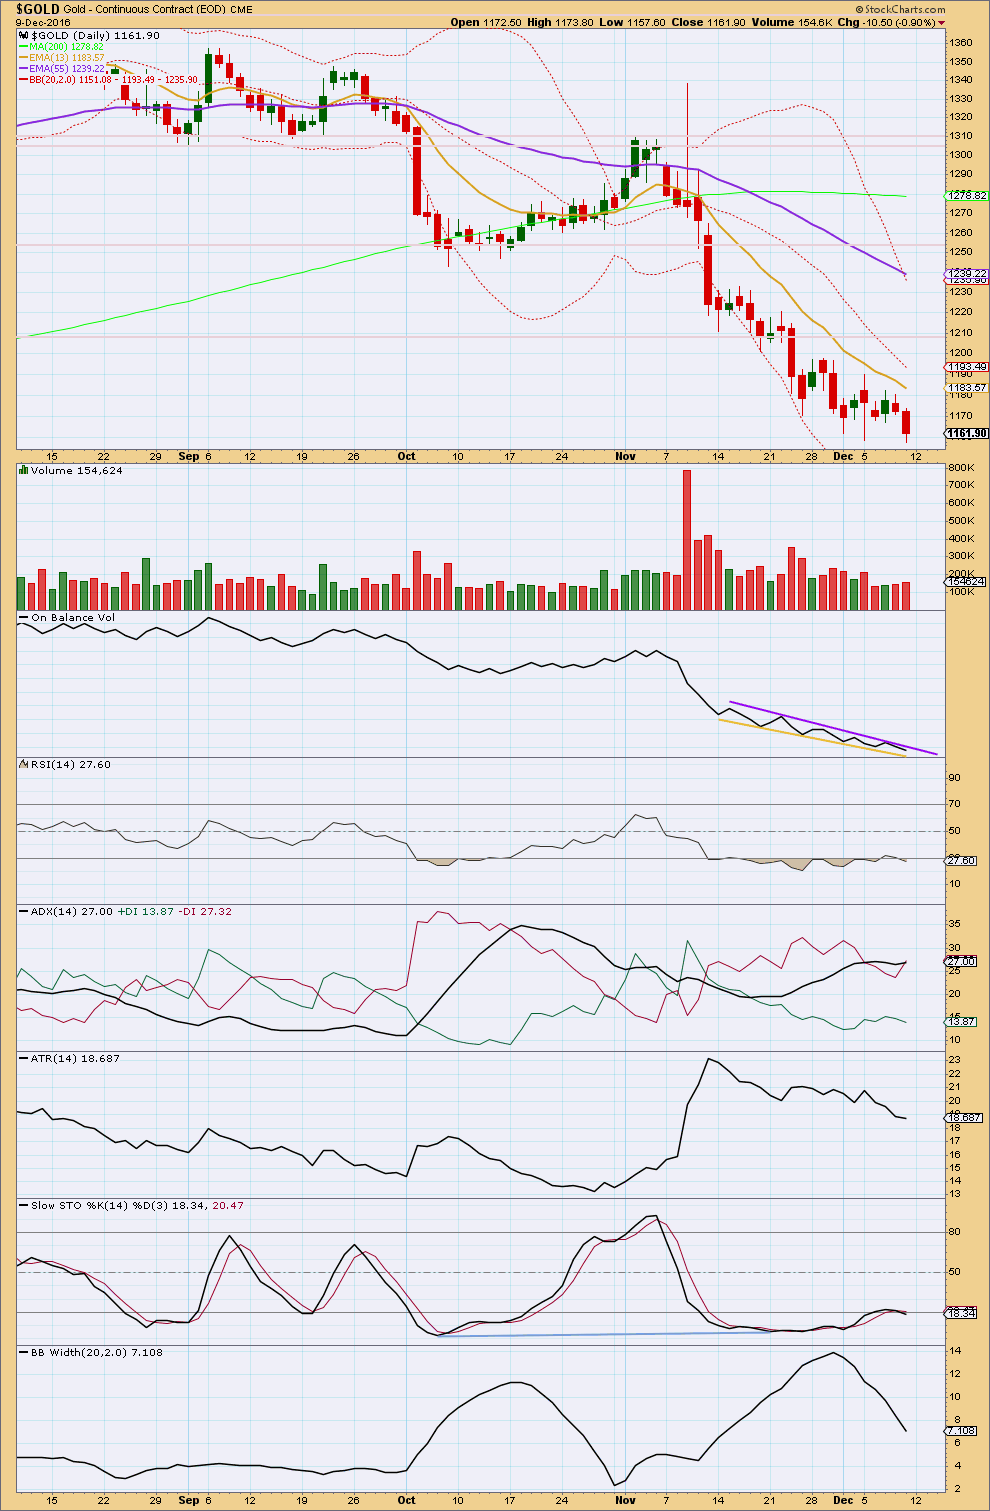
Price is falling as volume is declining. The fall in price is not supported by volume. Price is falling of its own weight, and it can continue to do this for some time. But for a healthy sustainable trend volume should be supporting the movement and that is not the case here.
There is no support line here or close by for On Balance Volume.
RSI is not yet extreme. There is still a little room for price to fall further.
DAILY CHART
Click chart to enlarge. Chart courtesy of StockCharts.com.
There is now triple bullish divergence with price and RSI, and RSI is oversold. This is a strong warning that bears are tired. We should expect a bounce here or very soon. While it is still possible that price may move a little lower, any downside movement should be very limited.
There was a small increase in volume for Friday’s session and the balance of volume was down. There was a little support for the fall in price, but not much. Volume remains very light. This small increase may be indicting a slight new low for Monday.
On Balance Volume remains constrained. It will be watched closely next week. A breakout may indicate the next direction for price.
ADX still indicates a downwards trend in place. ATR and Bollinger Bands still disagree. This trend looks tired and unhealthy.
It would be most reasonable to expect either a consolidation or a new upwards trend from here.
GDX DAILY CHART
Click chart to enlarge. Chart courtesy of StockCharts.com.
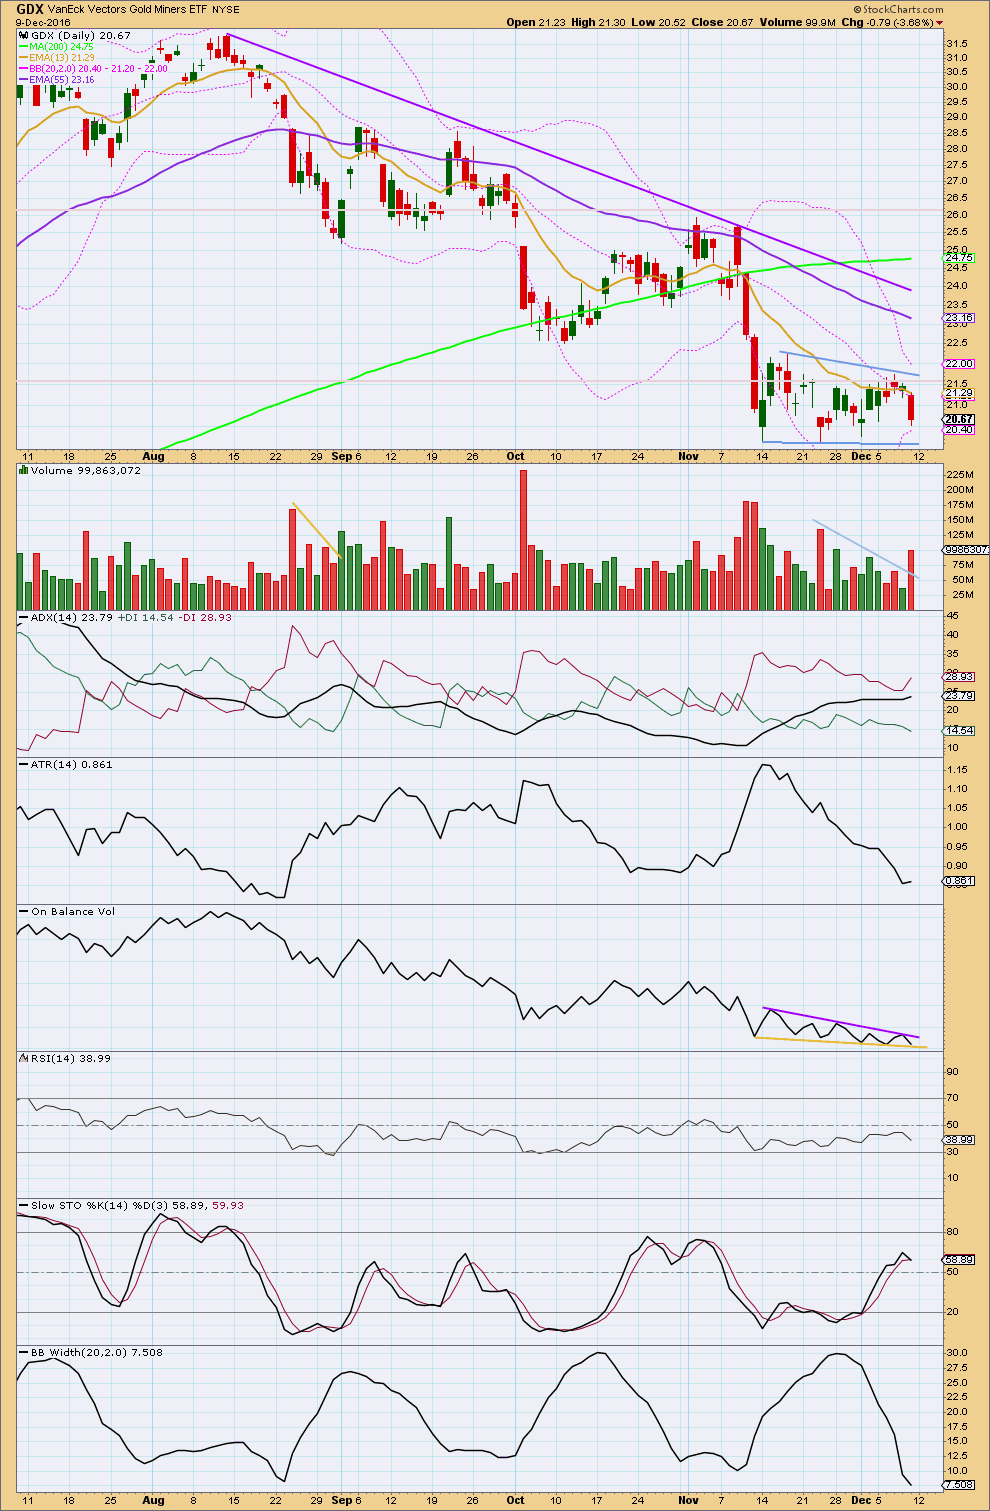
Price is moving essentially sideways and is range bound for GDX. Resistance is about 22.25 and support is about 20.15. During this range bound period, it is the downwards day of the 23rd of November that has strongest volume (ignoring the first day of the 14th of November) suggesting a downwards breakout may be more likely than upwards. This technique often works for Gold (not always). It remains to be seen how reliable it is for GDX.
Friday’s downward day came with some reasonable volume. This is some further small indication that there looks like more downwards pressure than upwards and a downwards breakout looks more likely.
ADX today has slightly increased again indicating a possible downwards trend still. ATR is clearly declining. Bollinger Bands are clearly contracting. Price is consolidating. This market is not currently trending. A bear flag pattern may be forming, delineated by blue trend lines. This is a continuation pattern. It is supported by declining volume.
Using the measure rule, a target of about 14.50 would be expected. First, to have confidence in this target, a downwards breakout needs to be seen below the lower blue trend line. If this is accompanied by a spike in volume, it would be given more weight. But note that for a downwards breakout stronger volume is not always necessary as the market may fall of its own weight.
On Balance Volume remains constrained. A breakout by OBV may indicate the next direction for price.
Overall, this GDX analysis is in line with the new main Elliott wave count for Gold spot price.
This analysis is published @ 09:07 p.m. EST on 10th December, 2016.
Lara ,
GOLD and USDJPY are still at inversed lock- step at the Hourly charts .
At the Hourly chart , the bounce in GOLD may not be complete at this moment of viewing . It is struggling tho . The USD Hourly still has the c- wave to complete Downside . USDJPY can still drop to 114 .
From say 114 , USDJPY may rally to 117/8 for GOLD to fall again .
Then from 117/8 , USDJPY may drop more substantially to near 110 . From the USDJPY reading , this is the best opportunity for GOLD in the shorter term , in a strong USD / weak YEN environment .
SP500 Daily chart , Stockchart .com :
Upper TL ; From 2111 to 2193 .
Lower TL : From 1810 to 2083 for the Rising wedge ( Ending Diagonal ).
From 1991 to 2083 for the parallel channel .
IF a Pullback happens from the Upper TL in the coming days , and it drops to any of the lower TL , there will be a multi- weeks / months correction in SP500 and the NIKKEI . This will strengthen the YEN ( JPYUSD ) and is the only major chance for GOLD for a substantial multi- week reversal . But SP500 is a uni- directional runaway train since March 2009 , that can always find new fuel when it tires out .
Appreciate your timely bold decision and objectivity to switch from Bulls to Bears and vice versa . A real Pro in action , considering how probabilistic this game is .
Thank you for all these years .
I will take a last bet , and then to cut losses . Incidentally , I agree with your USD count . I have been a USD Bull for many years, it has helped me financed my children overseas education when my home currency was failing , and I thought I could play GOLD despite that . It falls apart after the US election . Cest la vie !
Regards to you and your family , and all the members in this community ,
Keep it going .
Raymond .
Dreamer, you are super. I appreciate your efforts of sharing your charts.
Thanks weiquan. Good to hear you like them.
Updated main hourly chart:
Minor 4 is either an expanded flat (most likely, about 50%) or a running triangle (next likely, about 30%) or a combination (next likely, about 20%).
Expanded flats are very common structures. Minute b is now a 1.28 length of minute a, nicely within the normal range of 1 to 1.38 and meeting the requirement of a minimum 1.05 for an expanded flat.
So the target for minute c for an expanded flat is 1.618 X minute a = 1,187.
If minor 4 is a running triangle then minute c may not move beyond the end of minute a above 1,179.76. A triangle would see sideways movement this week in an ever narrowing range. Possible, but less likely than an expanded flat.
Or it could morph into a combination.
I will still need flexibility as this correction unfolds. This labelling may still change.
Silver printing a green candle today but it appears to me to be a weak one – a doji or spinning top close to its upper BB; definitely not looking like an impending break-out to the upside imho…
In 4 hour period Silver has formed inverse HnS with neckline around 17.23.
Hope this HnS will get confirmed with break above the NL. WoW!!!
FOMC sell off plus Donald Trump inauguration in January 20th puts metals in the weak until then. Long term, 1115 – 1120 level perhaps?
Thanks Lara. Your both EW and TA analysis are great.
In hourly period again gold has bullish divergence with few indicators.
Volume has contracted as gold made new lows:
@ 1157.16 – 6440
@1156.29 – 1105
@1151.12 – 2500
RSI and william & showing bullish divergence.
Let see what happens. Wave 4 correction or alternate wave lift off.
Syed you were correct on Nov 30 report comment. Your target hit.: Bravo!!!!!
——————————————————————————
Syed
December 1, 2016 at 11:45 am
IMO lucky if this can break above 1176 to get past pivot 1180-81/lower weekly band. Keeping it short notwithstanding upside risk a declining by about $8 a day resistance currently at 1210… Lets see how this pans out and closes today; got my target 1166, looking for deeper 1156-1148 range….
Hi Papudi! Thanks for your observation. The tempo seems to have changed with 1153-51 holding; Gold price at CMP 1164 appears to be heading for a break above 1170-71; still inclined to keep it short though with upside risk 1175+; realistically with ADX on the daily heading for 40 one ought to start to ease off on the shorts…. 🙂 Lets see how this closes. GL~!
Lara ,
Thank you for including the USDJPY Daily chart here . At the Hourly chart , GOLD should start to bounce today as per your Video . I say this becos I expect the USDJPY to start its Pullback today .
I think we will get the 3 to 4 Pullback in the USDJPY Daily chart from about 116 , then see if its drop from 5 will be a good and more sustaining Pullback , hence a good rally in GOLD . This is a long shot , I will not put my money in it unless it concurs with your EW count .
Refer to your USDJPY Daily chart here :
USDJPY has dropped to your green Cycle II , from 125 . Such strength in the YEN ( JPYUSD) will not be possible becos the YEN is the weakest of the majors , with sub- zero interest rate and massive QE . It can only be stronger then the mighty USD if Equities fall, to start the YEN carry trade unwind . The fall from 125 coincides with the SP500 fall from its 2134 peak to 1810 ( a 4 here perhaps . )
I have $USDJPY on Stockchart now , Daily , 1 year period , non- log scale for reading a couple of markers below :
Assume your green Cycle II is (A) . The subsequent move Up will be (B) in “abc ” .
# b will be at the doubled botttom just above the lower parallel channel line on your USDJPY chart , at 100.07 in Stockchart .
# 2 of c will be at the spike Down , at 101.15 in Stockchart .
# 3 of c will likely be today , at say 116 .
# 4 of c will be its Pullback , the GOLD temporary Bounce .
# Where is 5 , c ? I will make a guess with some numbers . IF 4 can drop towards , say 112 /110 ( too low ? ) , then 5 will not be that high , say 118 will do it ! And I hope the drop from 5 will be deep and lasting enough to give the GOLD last rally leg , as proposed by your GOLD Bullish count that I still think is the Preferred one .
This will require YEN ‘s strength , and the fall in Equities will give that . This will be a good check when the time comes . SP500 need to Pullback then . IF I assume an ED ( Ending Diagonal ) or RW that starts from 1810 mentioned in my first email , that will be the SP500 ‘s 3 to 4 Pullback , that will be multi- weeks / months .
GOLD has to suffer one more drop , during USDJPY’s move from 4 to 5 .
With the USDJPY ‘s 3 to 4 Pullback , and GOLD’s Bounce , GOLD need not fall so deep to 1106 .
A lot of ” IF ” idea , I will not bet more money on it until Lara , your EW count concurs with it . Your Alternate Daily now ( formerly Main and Bullish ) is the correct count in my opinion , it just needs a bit of tweaking , maybe shift down the Blue AB to the bottom when the Bounce starts , it maybe a B Bounce . Then a Blue C drop to complete the Pullback ? I have seen you untangle messy moves with ingenuity ! . I mean every word I say about your mastery of EW and the great site you have built . I sincerely hope the very best for this GOLD site , the members love you . I never want to see it become like the former EURUSD and GBPUSD sites , sorry for mentioning it . There , they do try their very best . It is just EW , too devilish !
Thank you , Lara , my best wishes to you and your family . I have 2 children myself , both just graduated , working in the UK and the US . I got married very late .
Raymond .
Thank you Raymond, and all my best to you and your family too.
I have only one child, he’s now 15 1/2 and the most lovely teenager a mother could ever want. He’s funny and sweet, and has excellent manners (poor kid, he doesn’t have a chance of being bad mannered in our house).
In our house the teenager is the neatest and tidiest, and has actually come out from his room to tell us to turn the sound down on our movie as he needs to sleep 🙂 Hilarious I think.
I am very lucky and very happy 🙂 It makes life easy, so I can have more time for analysis which I love too.
Dermot ,
Thanks , your uncle is a wise man .
Thanks to Lara too , her generosity and leadership has led to this great site .
Some info : I joined Lara since she started the SP500 ( but has switched to GOLD ).She is truly one of the top Pro in EW . Her comments about some brand name not following the guidelines in the GOLD’s Diagonal ( Wedge ) is fully justified , in my personal opinion . I trust her count – I have invested quite heavily in GOLD ( by my financial standard ) , using her count . But I am too slow and handicapped to trade , so I hold for longer term . Lara’s count was correct all the way , till the second GOLD raid by the Commercials ( I think ) on Trump’s victory .
I will clarify my last email later using Lara’s USD and USDJPY charts . I have things to attend to for half a day .
But thanks to Dreamer’s Weekly chart on YEN ( JPYUSD ) , I will just point out quickly here that from the Low , near 80 on the chart , the subsequent rise and fall could be an “abc ” , ie it will bounce soon as a “c” wave Up . Note that the “a” wave Up from say 80 to 100 is when we enjoyed the GOLD rally from 1045 to 1375 . The currrent ” b” wave Down is what is killing GOLD . But it is ending , and the “c” wave Up is GOLD’s turn . I believe that before GOLD can rally multi- weeks , it still has to bounce and fall first . This comes from checking the USD , USDJPY and SP500 probable counts . Let’s say that using Lara’s Daily chart on USDJPY , it has to reach 3 of a C -wave at say 116 , drop to 4 , then rally to 5 of C , maybe at 118 . The moonshot is 3 of C , almost finishing . The GOLD’s ” bounce and fall ” mentioned is the USDJPY’s 3 to 4 Pullback . All figures are descriptive only , not checked with Fibonacci .
Watch USDJPY FX Hourly chart for 3 to start its Pullback to 4 . That will start the GOLD’s ” bounce and fall ” .
Many Thanks , later ,
Regards ,
Raymond .
Thanks Raymond for the detailed explanation. It is interesting bringing in the analysis from the viewpoint of the Japanese and us currencies
Here’s the Yen with a gold overlay from Thirdeyeopen. Pretty close as stated below.
Also in response to Rodney’s comment here is a chart for USDJPY.
I’m just using trend lines for support. I have not yet counted the waves in the new cycle wave III up.
Read this in conjunction with the USDJPY analysis published back in June this year.
In response to Rodney’s comment below here are some USD charts.
Monthly: primary 5 of cycle III underway.
Weekly: some detail of primary 4 and early stages of primary 5.
I’m not completely happy with how intermediate (C) of primary 4 subdivides, but I have checked the subdivisions on the daily chart. There is disproportion within it’s waves, and it will fit. It just doesn’t look so good on higher time frames.
Daily: more detail of the early stages of primary 5.
If USD behaves like a commodity then it may exhibit some blowoff tops along the way up.
This is a fairly rough wave count. I’ve not calculated targets nor put invalidation points in, but the idea would be the same. Up.
Some interesting articles on Commercial positions. Taken together with this analysis, these may help as a guide.
http://www.gold-eagle.com/article/gold-price-and-silver-price-updates-64
http://www.gold-eagle.com/article/gold-futures-selling-exhausting
Lara,
To your credit , you have built a great site : You have counted the EW with intellectual integrity , you have been firm but democratic allowing other views and opinions , and there are so many great contributors in this community .
I have noticed that recently , GOLD has moved inversely , almost lock- step with USDJPY , even in the Hourly chart , blow by blow . GOLD has no chance unless the YEN ( inversed USDJPY) strengthens , ie NIKKEI falls . The YEN/ NIKKEI inversed correlation is highly reliable .
I have checked the USD, USDJPY and SP500 , and come to this scenario :
GOLD will bounce soon , but like SILVER , it will only be a corrective Bounce ( like a b wave say ) , then it will drop to a new Low but not likely as Low your 1100 level . From there , GOLD will rally multi- weeks/months :
The USD will do the same inversely . It will soon reach its “5” and fall multi-weeks/ months for GOLD to rally . ( The USD will start a larger degree Five later , it’s Bull run is likely not over , but that is another story for later that will sync with the fall you have for GOLD , …. only after the rally we have all been waiting for .)
The SP500 has a Rising Wedge ( RW ) from 1810 made in early 2016 . Very soon , it will reach 3 ( say 2300 ) area , then fall to 4 ( say 2180 , the numbers are just rough markers to be descriptive ) . This will be a multi- weeks/ months Pullback .
NIKKEI will follow and fall , YEN will strengthen ,…… with GOLD .
So both USD and SP500 will have this multi-weeks/ months Pullback very soon
after GOLD has its corrective Bounce and fresh low ( but above your 1106 ) , .
So I am still with the old GOLD Bullish scenario that GOLD has bottomed at 1045 , and betting on the multi- weeks/ months Pullback in the USD and SP500 , for GOLD to have its turn . You are an expert in counting SP500 and have your own count . It does not matter about the RW , GOLD just need the SP500 to pullback , so will the NIKKEI , allowing the YEN ( JPYUSD ) to strengthens , hence GOLD .
The FX market is too large to be easily manipulated , unlike GOLD and even SP500 . In the Weekly COT report for GOLD , I think the bullion banks classified under the Commercials triggered the GOLD sell-off when they were overly shot . Now they are Buying GOLD from the Hedge Funds ( large Speculators ) . You have mentioned a book by Briese . He is one of the few who knows how to read the trigger points . The Hedge Funds/ large Speculators ( who call them dumb money ? ) are price trend followers and make money there . Then they lose to the Commercials ( smart money ) during the triggerred reversal . The retailers like us tend to follow the Hedge Funds . In the graphic version of the COT Report , the large Speculators and Commercials are mirror – image . With your deep knowledge and skills in EW , Briese will add to your unbeatable arsenal combination .
I am seventy , with impaired eyesight , but still able to read what you and everyone has to say . Thank you all .
I appreciate the videos and the bold prints in your writings. I can read graphics and charts better than writings .
Keep this site for many more happy years ,
Regards ,
Raymond .
Thanks Raymond, wise words. My uncle told me something when I was younger and it is very true. “Two minds working together are better than two minds working apart”. In the case here it is many minds working together. I think the wisdom and strengths of all will be needed to keep on top of this, we are at a crucial juncture and we need to be vigilant. This can’t be I shoulda woulda coulda moment. This has to be an I did moment.
Thank you very much Raymond for the kind words.
I agree, many minds working here together gives us all more strength.
I’m working my way through Stephen Briese’s “The Commitments of Traders Bible”. I’m a bit slow ATM with the reading, I have had some family commitments to care for.
I have eyeballed COT numbers with Gold spot price charts, and I could not see any pattern. So I hope Mr Briese will make it clearer. I suspect it is a mid term timing tool, and may not be helpful in telling us exactly when a top or bottom is in, only when a turn is close.
I have a very bullish wave count for USD index. I’m only counting the waves there, and only down to daily level. For USD the fall you expect may be cycle wave IV, after cycle III is done. Before that happens though it needs three smaller fourth wave corrections along the way up. If it behaves like a commodity it could have some blowoff tops along the way for fifth waves.
I have a wave count for the last big wave down for USDJPY, but I’ve not bothered yet to count the waves in the new wave up. I posted a chart of this pair after a member commented that it was looking like a good opportunity back in July this year.
I agree, the FX markets are too large to be manipulated which is partly why I prefer to trade them. The S&P sure looks like it’s being manipulated. I’m not sure that Gold can be though, I’d liken it more to FX markets in size and global reach. I do know that of all the markets I’ve ever tried to analyse Gold most often has Elliott waves that look closest to textbook perfect.
Lara,
Thanks for the book recommendations on the commercials, I also picked up Trade Stocks and commodities with the insiders. I’m even more behind than you though, tough when you have a full time job, besides trading.
I agree with your observation with the commercials/Speculators, it is hard to pick an exact point of a turn. They can give you hints to when it might turn. For example the Speculators were at an all time high of 300K plus long contracts during golds high at about 1375 or so. They usually top out at about 250K during bull markets, so that was a huge warning. I think they are long about 136K contracts now. In the most recent bull market they bottomed out at 150K or so. they are probably down to about 125 with the additional drop in gold.
Attached is a chart by Jack Chan who posts on Gold eagle every week. It gives a heads up about where speculators are usually indicating a turning point. As mentioned before the commercials are the mirror of the Speculators for the most part.
note this chart does not have the recent high of 1375 and the drop thereafter
Lara, any chance this could work as an ED for the alternate?
Going down to your impulse target of 1,106 looks like too big of a support break for the BULL count.
Dreamer, sorry for my slow reply to your question.
Yes, it looks okay, but I notice a couple of small problems.
Minute ii appears to end with a small truncated C wave. That must reduce the probability of the count.
The trend lines appear to be almost parallel. Check that they converge. If they do not then it is an invalid count, it is a rule for contracting diagonals that the trend lines converge.
Apart from that it looks like the wave lengths meet rules, and each wave subdivides okay as a zigzag.
Lara, thanks for all the feedback and comments on my charts!
So now for my GDX EW update. Unfortunately as described below, the situation is unclear in the Intermediate term.
I still show the main count as BULLISH, but to be cautious, I have added two BEARISH ideas. Both expect at least a little bit of an up move before turning down.
Sometimes no position is best until the situation becomes more clear.
That looks good Dreamer, nice how you’ve fitted three ideas on one chart.
Thank you again very much from me and all members here for your continued work with GDX and your generosity in sharing charts with us all. I know it is appreciated.
Verne mentioned in the last analysis comments that Silver BB bands were foretelling a violent move.
I don’t spend much time on Silver, but here is a look at the GDX BB bands. The bands have not been closer since the beginning of the big move up last January.
A big move in GDX is coming very soon! The direction of the move will likely decide BULL Vs. BEAR.
I think a trading strategy based on EW confirmation / invalidation points, and / or trend lines breached would be a good idea.
Or more simply, a breakout from the small flag pattern.
If GDX breaks below the lower trend line then use the target given by the measure rule, about 14.50.
If GDX breaks above the upper trend line then look for resistance at the purple trend line, set a target there or watch the trade and exit if / when price touches the trend line.
I think that would be a good strategy to trade this one. I agree very strongly Dreamer, GDX is getting ready for a big violent move.
Here’s “GDX last Stand”. Like Gold, anything more than an overshoot of these support levels and the BEAR case is confirmed. Until then, the BULL still has a chance to prove itself.
Here’s my Gold chart that I call “Gold’s Last Stand”. It shows an ominous H&S pattern, yet Gold is sitting on multiple support levels. Among them, the downtrend line of resistance turned support from the last 2 years and the uptrend support going back to 2001 (Lara also added this line to her charts).
At minimum, I see a bounce here. Then we need to watch the uptrend support line. Anything more than an overshoot and I think the BEAR case is confirmed. That said, the BULL is still alive as long as this support holds.
Nowhere land…
GLD an HUI are sitting on strong support, yet they are below the necklines of multi-month H&S patterns. Until we get a confirmed break down below support or a move back up above the necklines, the Intermediate term direction is unclear.
https://rambus1.com/2016/12/09/pm-combo-chart-update-3/