
Price has moved lower as the main Elliott wave count expected, but only slightly. The confirmation / invalidation point remains the same.
Summary: A bear flag pattern completed. The target using the measure rule is 14.00. However, today a very bullish hammer candlestick may indicate a trend change.
New updates to this analysis are in bold.
To see how this analysis fits into the bigger picture, see last monthly charts here.
MAIN WEEKLY WAVE COUNT
Click chart to enlarge.
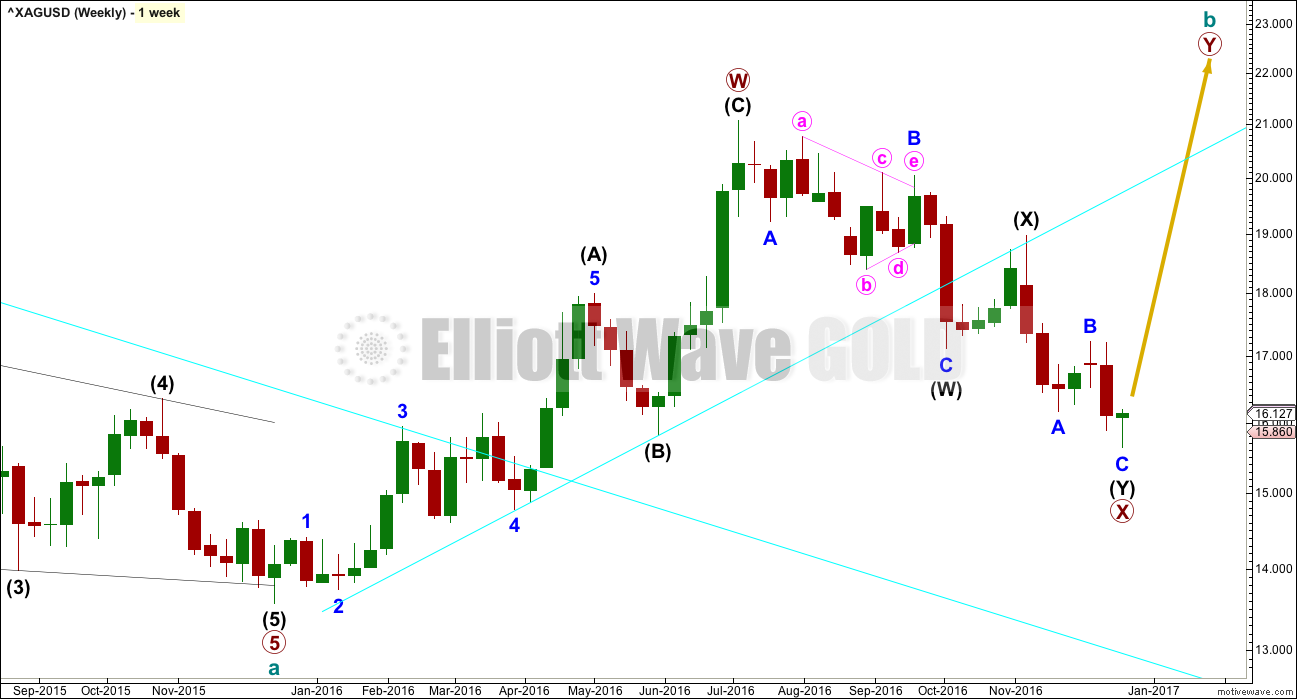
Upwards movement fits better as a completed zigzag than it will as an incomplete five, at this stage. At the daily and weekly chart level, this wave count has a better fit and better look for Silver.
Primary wave X may have continued lower as a double zigzag. This movement For Gold will now fit as a single zigzag, but for Silver it will fit only as a double zigzag.
Cycle wave b may be either a double zigzag or a double combination. If it is a double zigzag, then primary wave Y may be about equal in length with primary wave W.
If it is a double combination, then primary wave Y may be either a flat or triangle and may end about the same level as primary wave W at 19.878.
X waves within combinations are more often very deep. There is no rule stating a maximum limit for an X wave. They may make new price extremes beyond the start of the correction.
MAIN DAILY WAVE COUNT
Click chart to enlarge.
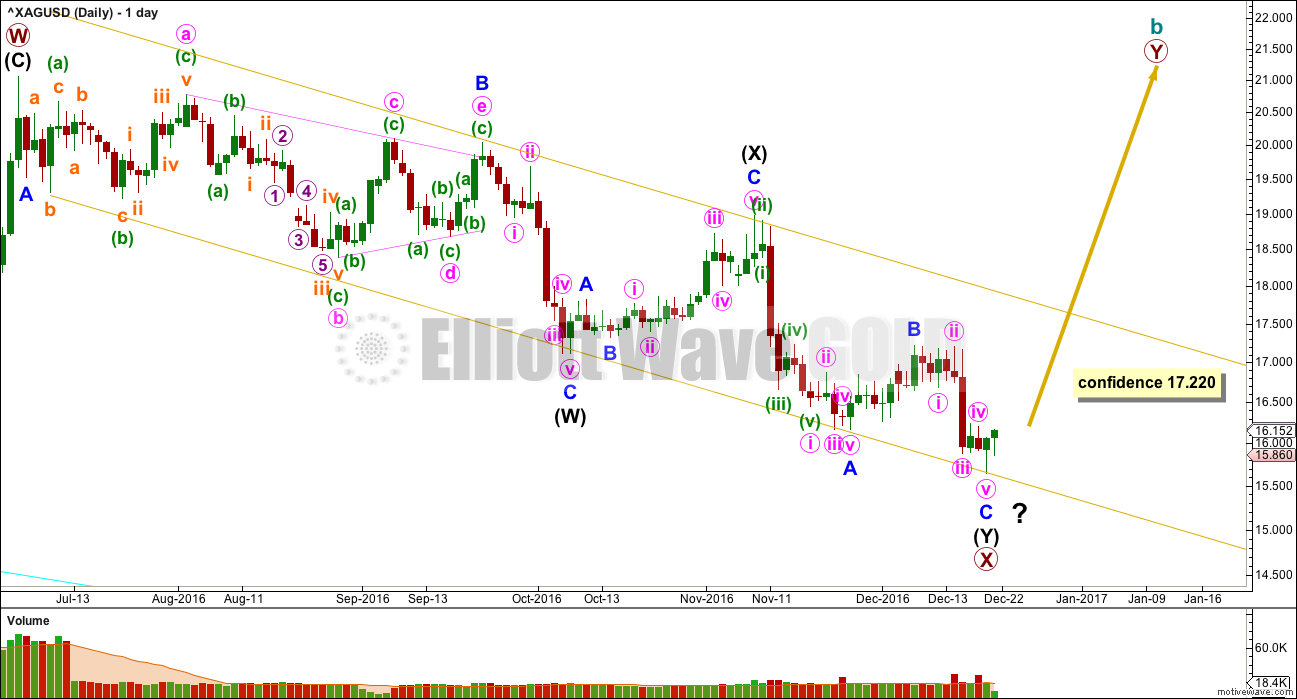
At this stage, there is still no indication of a reversal, so this wave count requires a new high above 17.220 for confidence.
When a reversal is indicated, then a target may be calculated. Price may continue lower while it remains below 17.220.
The structure of minor wave C now looks complete. Minor wave C has no Fibonacci ratio to minor wave A.
ALTERNATE WEEKLY WAVE COUNT
Click chart to enlarge.
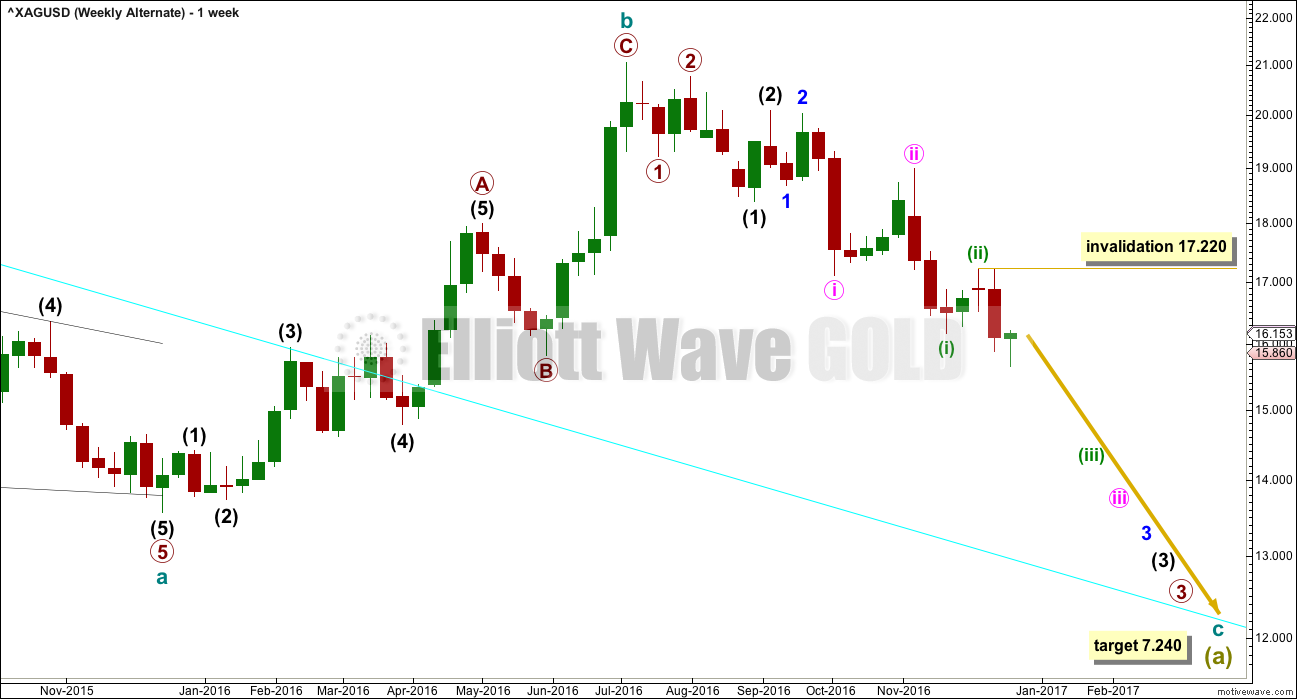
It is possible that cycle wave b is a complete zigzag and that downwards movement is the start of cycle wave c.
Within the middle of the third wave down, no second wave correction may move beyond the start of minuette wave (iii) above 17.220.
It is judged that this alternate at this stage may still be less likely. A series of overlapping first and second wave corrections ignores what looks like a triangle within this structure. Triangles may not be the sole corrective structure of a second wave.
Minute wave ii is much longer in duration than minor wave 2 and intermediate wave (2). The disproportion of this correction also reduces the probability of this wave count.
If downwards movement continues and shows an increase in strength, then this wave count should be taken seriously. It is technically possible.
ALTERNATE DAILY WAVE COUNT
Click chart to enlarge.
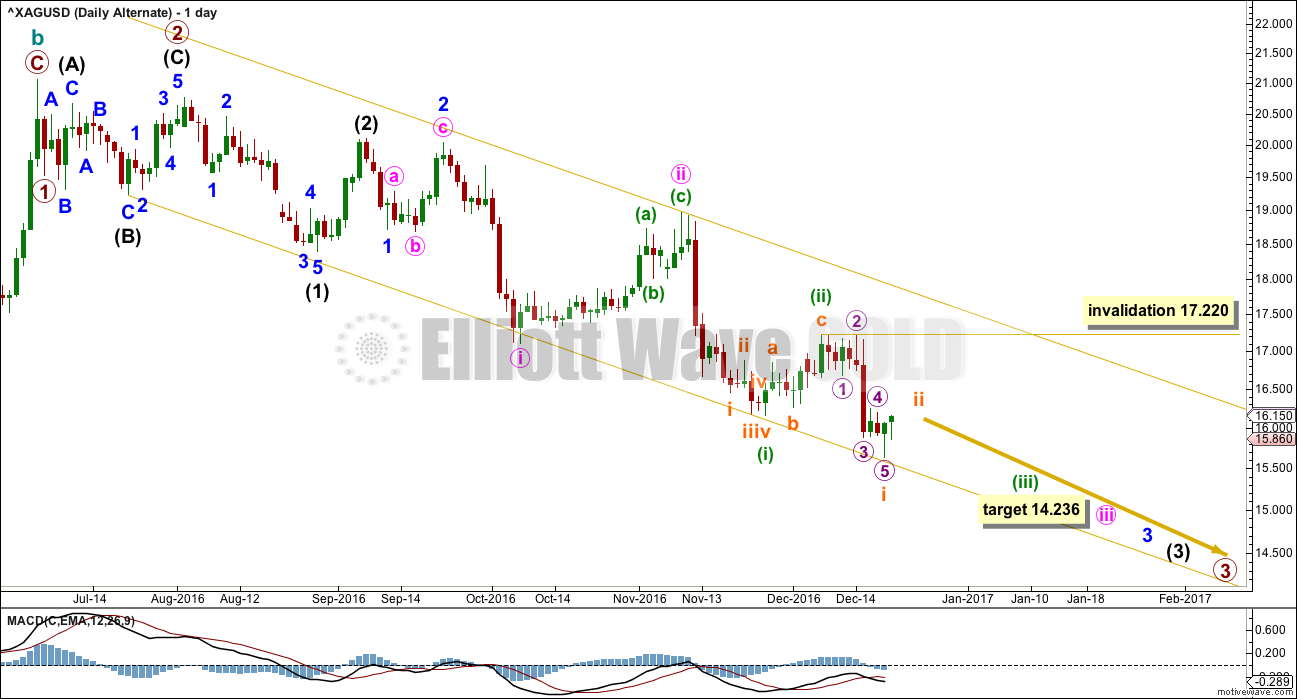
There would now be four overlapping first and second waves within a new downwards trend if this wave count is correct. A large increase in downwards momentum would be expected. The small divergence at the last low labelled minuette wave (i) should be quickly overcome if this wave count is correct.
Another first wave may now be complete this week for subminuette wave i. If this wave count is correct, then subminuette wave ii should be relatively brief and shallow. There should be a strong pull to the downside.
At 14.236 minute wave iii would reach 2.618 the length of minute wave i.
TECHNICAL ANALYSIS
WEEKLY CHART
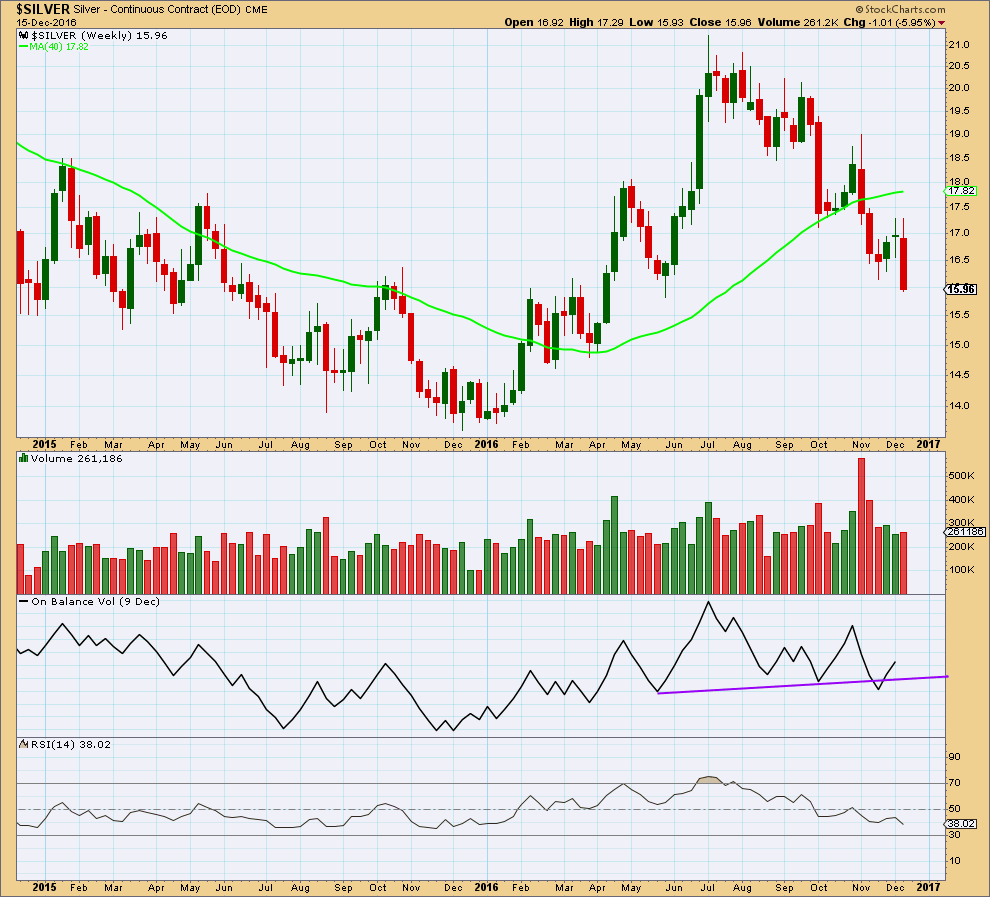
Click chart to enlarge. Chart courtesy of StockCharts.com.
There are still two more sessions to complete, so this week is incomplete and will not be considered in this analysis.
Last week, at its end, did show some increase in volume for a downwards week that was stronger than the prior two upwards weeks. This supports the fall in price.
On Balance Volume came down to touch the purple trend line again, but this line has recently been weakened with a breach and return. It may provide some support.
RSI is not oversold at the weekly chart level. Tthere is still room for price to fall.
DAILY CHART
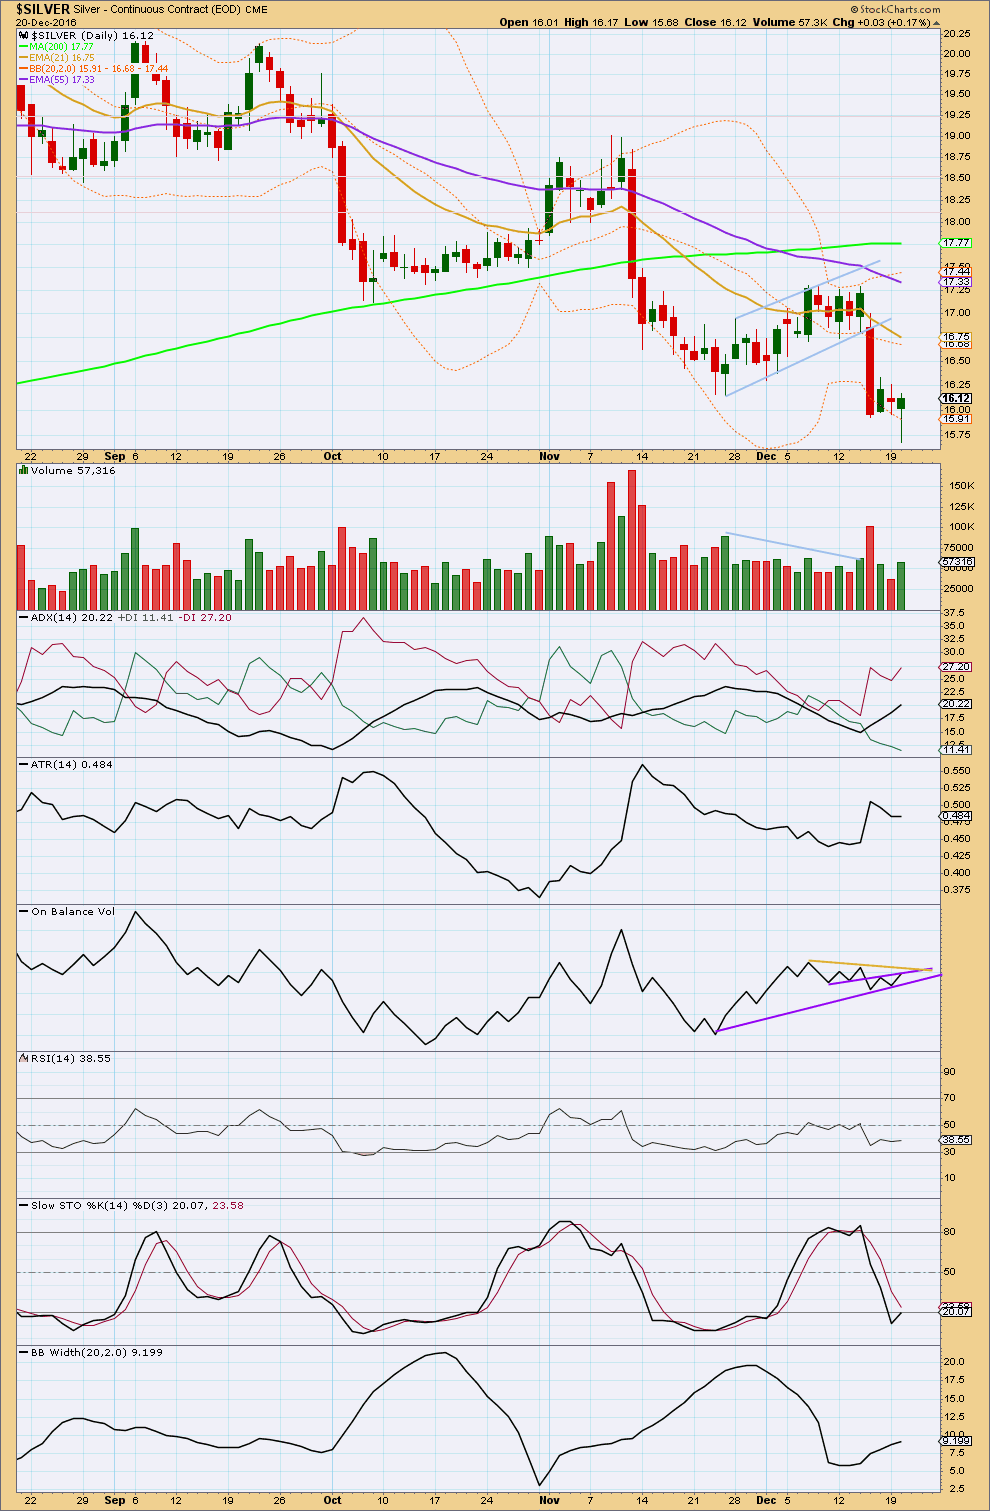
Click chart to enlarge. Chart courtesy of StockCharts.com.
A bear flag pattern completed and price broke out of the pattern downwards. Using the measured rule, a target would be about 14.00.
ADX indicates a downwards trend is in place. ATR is unclear; it is overall flat. Bollinger Bands are still widening. A downwards trend may still be in place.
However, the last daily candlestick is fairly bullish because it completed with a hammer candlestick pattern. The balance of volume was upwards and it showed an increase in volume, which is also bullish.
Either some small consolidation may happen here or possibly a trend change.
On Balance Volume may lead the way. If it breaks above resistance at the purple and yellow lines, then it would offer a reasonable bullish signal.
This analysis is published @ 02:22 a.m. EST.
Since it does not look to me like a third wave down in the white metal is underway, it would seem that the alternate count has to be accorded a higher probability of being correct and that a low is in. I am entering long Silver at today’s price, 1/4 full position. I will maintain a hard mental stop at yesterday’s low of 15.62. Hi, Ho, Silver! 🙂
Wow! It has been quite some time since I have seen possible wave counts with such drastically differing expectations. In keeping with our tradition of rarely seeing these expectations of third waves at multiple degrees panning out, it would seem as if the main count has the brighter prospect. 🙂
Sentiment is also already quite extreme, a bit unusual for the beginning of a quintet of third waves donw…
I agree Verne. I don’t like it when the wave counts I see are wildly divergent.
Unfortunately at higher time frames (weekly and monthly) at this time, both Gold and Silver are in B waves.
They’re the absolute worst. I hate B waves. They are the hardest to analyse and trade because they exhibit the greatest variety in form and behaviour. They can be quick sharp zigzags or big complicated sideways combinations. There are over 23 possible structures for them.
So that means there will be periods when there will be multiple alternate wave counts. Like now.
I could publish over 20 charts.
But that would lead to paralysis by over analysis, and confusion. That would be unhelpful for all.