
Upwards movement is continuing as expected.
Summary: The target for upwards movement to end is still about 58.05. Use the yellow trend channel on the daily chart; when a full daily candlestick prints below the lower edge and without touching it, then expect Oil has had a sizeable trend change. The next wave down should reach to 28.61 minimum.
New updates to this analysis are in bold.
MONTHLY ELLIOTT WAVE COUNT
Click chart to enlarge.
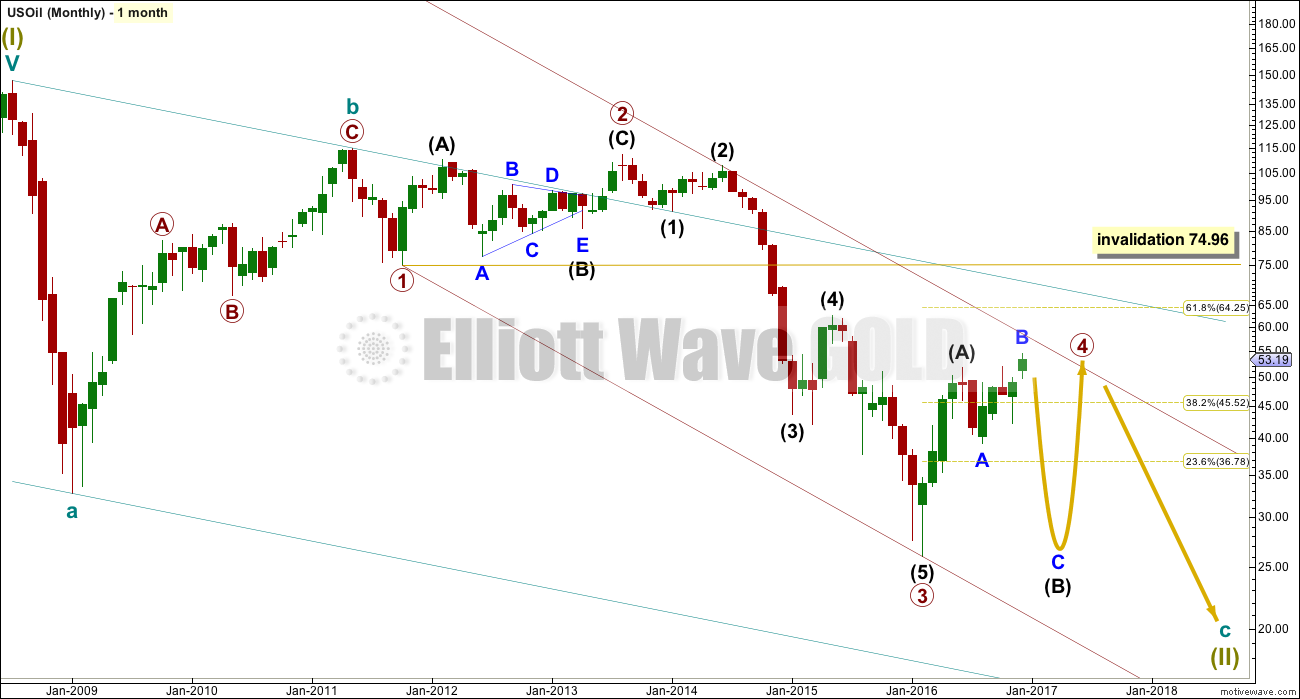
Within the bear market, cycle wave b is seen as ending in May 2011. Thereafter, a five wave structure downwards for cycle wave c begins.
Primary wave 1 is a short impulse lasting five months. Primary wave 2 is a very deep 0.94 zigzag lasting 22 months. Primary wave 3 is a complete impulse with no Fibonacci ratio to primary wave 1. It lasted 30 months.
Primary wave 4 is likely to exhibit alternation with primary wave 2. Primary wave 4 is most likely to be a flat, combination or triangle. Within all of these types of structures, the first movement subdivides as a three. The least likely structure for primary wave 4 is a zigzag.
Primary wave 4 is likely to end within the price territory of the fourth wave of one lesser degree; intermediate wave (4) has its range from 42.03 to 62.58.
Primary wave 4 may end if price comes up to touch the upper edge of the maroon channel. The upper edge of this channel has been pushed up to sit on the end of intermediate wave (2) within primary wave 3.
Primary wave 4 is most likely to be shallow to exhibit alternation in depth with primary wave 2. So far it has passed the 0.382 Fibonacci ratio at 45.52. It may now continue to move mostly sideways in a large range.
Primary wave 4 may not move into primary wave 1 price territory above 74.96.
At this stage, primary wave 4 has completed intermediate wave (A) only. Intermediate wave (B) is incomplete.
DAILY ELLIOTT WAVE COUNT
Click chart to enlarge.
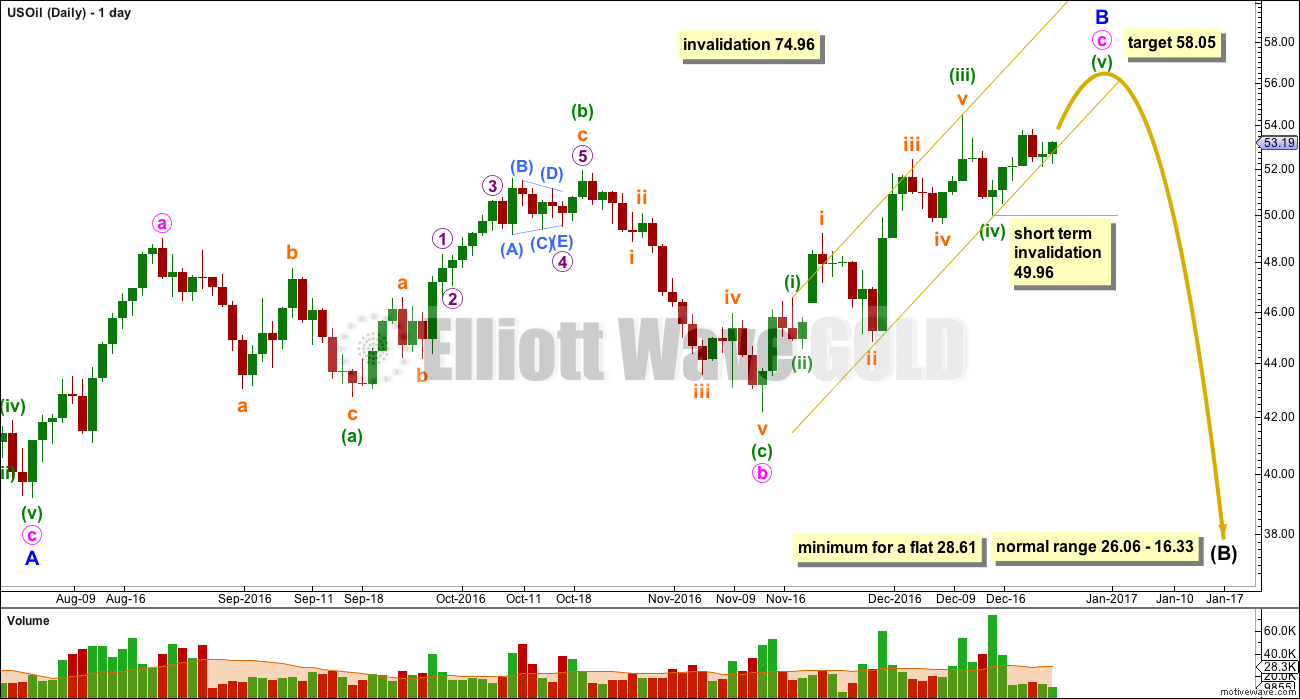
Intermediate wave (B) still looks like it is unfolding as a flat correction. Within intermediate wave (B), minor wave A is a zigzag and minor wave B is an incomplete zigzag.
Minute wave b fits as an expanded flat correction. Minute wave c must subdivide as a five wave structure.
Within minute wave c, the upwards movement began with two overlapping first and second waves, labelled minuette waves (i) and (ii), and subminuette waves i and ii. Now it must end with two corresponding fourth wave corrections and final fifth waves up. It looks like the last fifth wave up is now underway.
Minuette wave (iv) unfolded as a relatively brief correction. It is likely to be over at the lower edge of the parallel channel.
Within minuette wave (v), no second wave correction may move beyond the start of its first wave below 49.96.
At 58.05 minute wave c would reach 1.618 the length of minute wave a. Minuette wave (v) should be expected to make at least a slight new high above the end of minuette wave (iii) at 54.50 to avoid a truncation.
Primary wave 4 may not move into primary wave 1 price territory above 74.96.
When minor wave B is a complete zigzag structure, then a major trend change would be expected still for Oil. Minor wave C downwards must subdivide as a five wave structure.
A small channel is drawn as a best fit about minute wave c. When this channel is breached by downwards movement, it would indicate that minute wave c and minor wave B should be over and that minor wave C down should have begun. Use this channel to indicate a trend change whether or not the target is met. A breach is defined as a full daily candlesick fully below and not touching the lower edge of the channel. So far this channel is only overshot.
Because intermediate wave (A) fits so well as a three wave structure, it is still most likely that intermediate wave (B) must retrace a minimum 0.9 length of intermediate wave (A) at 28.61. When an A wave subdivides as a three, then a flat correction is indicated.
The normal range for intermediate wave (B) within a flat correction is from 1 to 1.38 the length of intermediate wave (A) giving a range from 26.06 to 16.33.
TECHNICAL ANALYSIS
DAILY CHART
Click chart to enlarge. Chart courtesy of StockCharts.com.
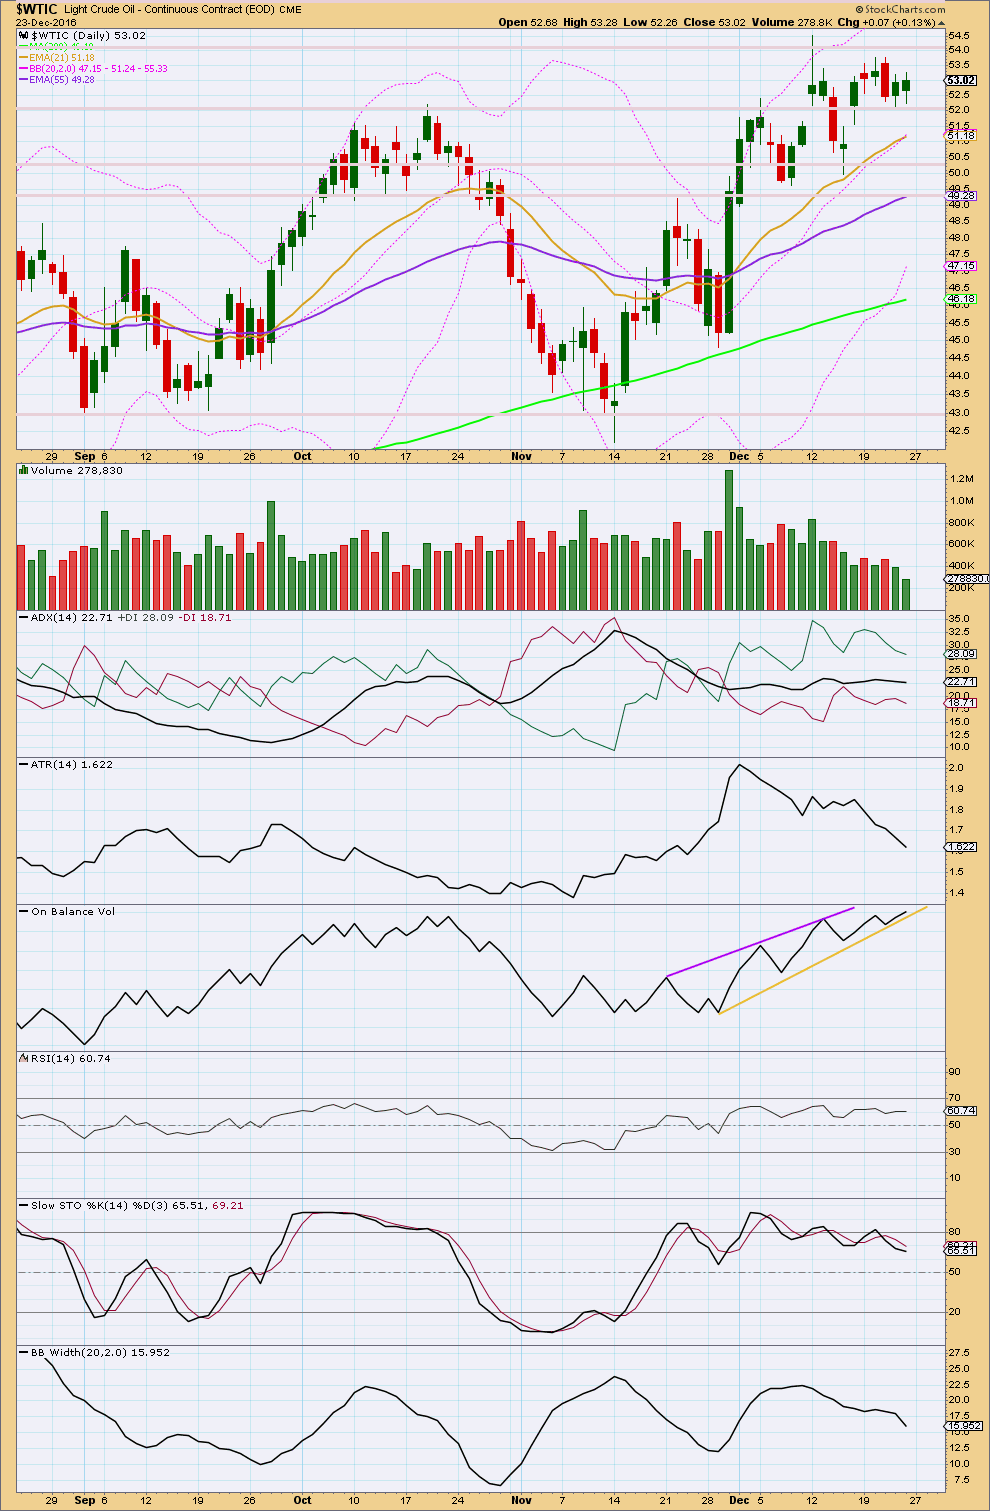
Price is finding resistance about 54.20 and support about 52.10. Within this small range, price is moving sideways with declining volume and declining ATR. This sideways movement looks corrective so far.
ADX is flat indicating the market is not currently trending. ATR is declining and Bollinger Bands are contracting. All three indicators are in agreement that Oil is consolidating.
RSI is not overbought and exhibits no divergence with price to indicate weakness.
Stochastics did reach overbought and there did exhibit divergence with price. This may now be resolved by some sideways movement.
The conclusion must be that currently Oil is consolidating, and either a high is in place or should be in place with one more high.
The trend is still up short, mid and long term.
This analysis is published @ 02:10 a.m. EST.
is lara returning?
Yes, I’m here.
EWG takes a two week holiday at Christmas / New Year each year. Normally the market is quiet at this time and NY is closed at least two days.
I’m back now and doing the Oil update right now.