
Last analysis was invalidated by upwards movement, which was unexpected.
Summary: After a small consolidation, which should remain above 49.19, more upwards movement is expected. The target for it to end is about 58.05.
New updates to this analysis are in bold.
MONTHLY ELLIOTT WAVE COUNT
Click chart to enlarge.
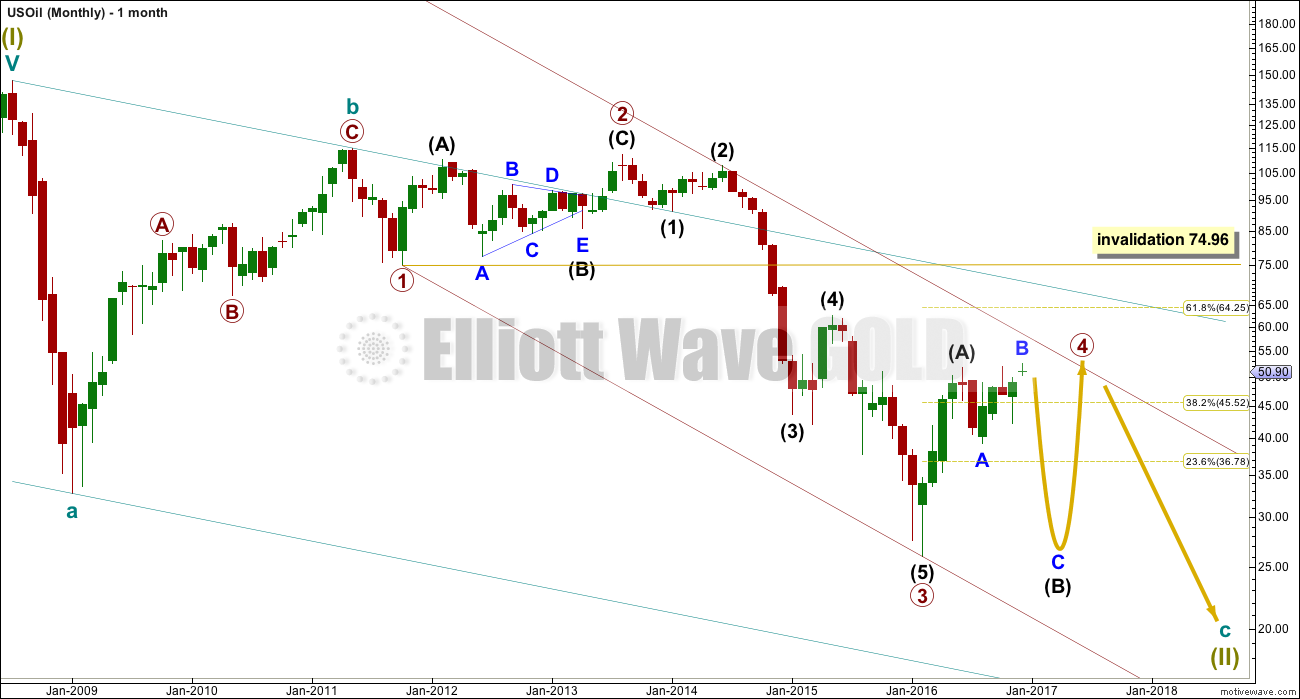
Within the bear market, cycle wave b is seen as ending in May 2011. Thereafter, a five wave structure downwards for cycle wave c begins.
Primary wave 1 is a short impulse lasting five months. Primary wave 2 is a very deep 0.94 zigzag lasting 22 months. Primary wave 3 is a complete impulse with no Fibonacci ratio to primary wave 1. It lasted 30 months.
Primary wave 4 is likely to exhibit alternation with primary wave 2. Primary wave 4 is most likely to be a flat, combination or triangle. Within all of these types of structures, the first movement subdivides as a three. The least likely structure for primary wave 4 is a zigzag.
Primary wave 4 is likely to end within the price territory of the fourth wave of one lesser degree; intermediate wave (4) has its range from 42.03 to 62.58.
Primary wave 4 may end if price comes up to touch the upper edge of the maroon channel. The upper edge of this channel has been pushed up to sit on the end of intermediate wave (2) within primary wave 3.
Primary wave 4 is most likely to be shallow to exhibit alternation in depth with primary wave 2. So far it has passed the 0.382 Fibonacci ratio at 45.52. It may now continue to move mostly sideways in a large range.
Primary wave 4 may not move into primary wave 1 price territory above 74.96.
At this stage, primary wave 4 has completed intermediate wave (A) only. Intermediate wave (B) is incomplete.
DAILY ELLIOTT WAVE COUNT
Click chart to enlarge.
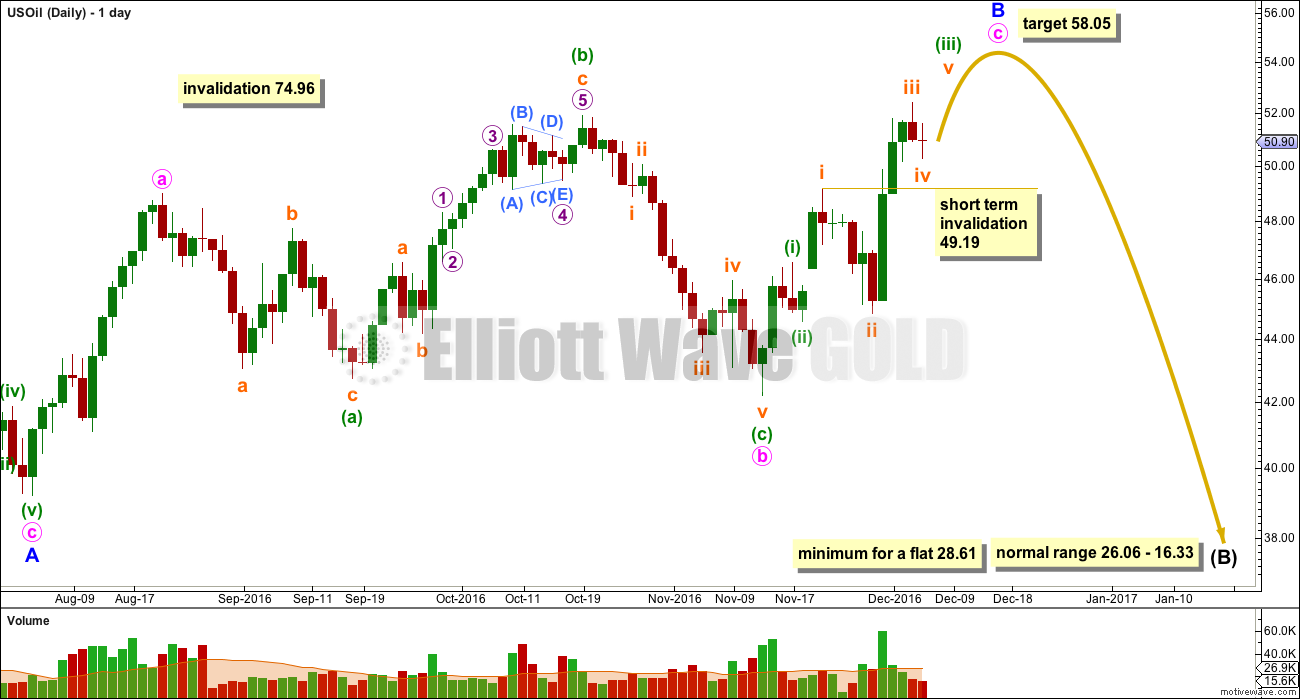
Intermediate wave (B) still looks like it is unfolding as a flat correction. Within intermediate wave (B), minor wave A is a zigzag and minor wave B is an incomplete zigzag.
Minute wave b fits as an expanded flat correction. Minute wave c must subdivide as a five wave structure.
Within minute wave c, the upwards movement began with two overlapping first and second waves, labelled minuette waves (i) and (ii), and subminuette waves i and ii. Now it must end with two corresponding fourth wave corrections and final fifth waves up.
Subminuette wave iv may not move into subminuette wave i price territory below 49.19.
At 58.05 minute wave c would reach 1.618 the length of minute wave a.
Primary wave 4 may not move into primary wave 1 price territory above 74.96.
When minor wave B is a complete zigzag structure, then a major trend change would be expected still for Oil. Minor wave C downwards must subdivide as a five wave structure.
Because intermediate wave (A) fits so well as a three wave structure, it is still most likely that intermediate wave (B) must retrace a minimum 0.9 length of intermediate wave (A) at 28.61. When an A wave subdivides as a three, then a flat correction is indicated.
The normal range for intermediate wave (B) within a flat correction is from 1 to 1.38 the length of intermediate wave (A) giving a range from 26.06 to 16.33.
TECHNICAL ANALYSIS
DAILY CHART
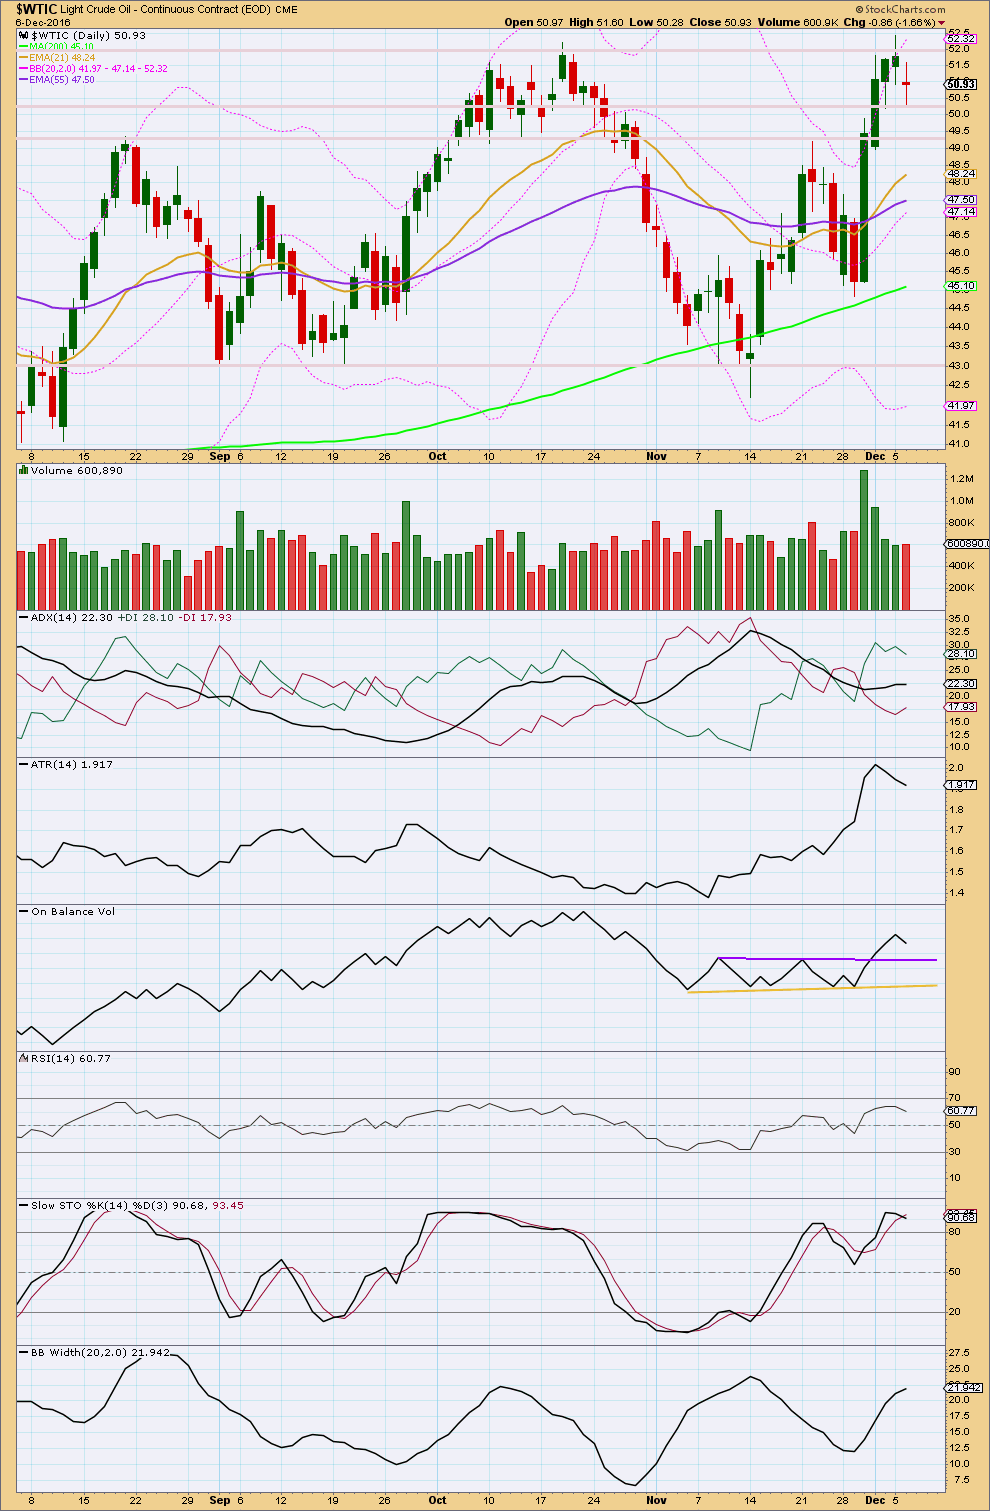
Click chart to enlarge. Chart courtesy of StockCharts.com.
The surprising upwards movement was not preceded by a trend line break from On Balance Volume to give any warning.
Upwards movement shows declining volume to the last high. This movement, despite beginning strongly, does not have support any more from volume. Price found resistance about 52.00 and is now finding support about 50.20. It looks like price may continue higher after some small consolidation.
ADX has indicated a trend change from down to up, but today is flat indicating no clear trend.
ATR has begun to decline since the 1st of December indicating a consolidation.
Bollinger Bands continue to widen though, so there is some strength to this trend.
Stochastics is overbought but this oscillator may remain extreme for reasonable periods of time during a trending market. It exhibits no divergence with price at highs to indicate any weakness.
RSI is not yet overbought. There is room for price to rise.
This analysis is published @ 06:35 p.m. EST.
Hi Lara,
as USD/CAD seam to have a negative correlation it would be interesting to know your thoughts on this. In other words over all when oil goes up USD/CAD goes down and vice versa.
And again this analysis seam to be sport on. Great work. Thank you very much.
Lara, hello!
Is it possible that intermediate wave (A) is a simple zigzag, and now there is intermediate wave (C) unfolding? So that primary wave 4 will be double zigzag…