
Upwards movement continued, falling just short of resistance about 1,210 to reach 1,207.2 for the session.
The Elliott wave count remains the same, and this upwards movement has now lasted a Fibonacci 21 days.
Summary: It is reasonably likely now that upwards movement is over for now and a deep correction may have begun. Price confidence would come with a new low now below 1,183.15. If the gold channel on the hourly chart is breached by downwards movement, then strong confidence may be had that a deep correction has begun. The first target is 1,155, but it may be deeper than this.
New updates to this analysis are in bold.
Last monthly and weekly charts are here. Last historic analysis video is here.
Grand SuperCycle analysis is here.
MAIN ELLIOTT WAVE COUNT
DAILY CHART
Click chart to enlarge.
This main wave count has a better fit for prior movement. To see the difference between this main wave count and the alternate below please refer to last historic analysis linked to above.
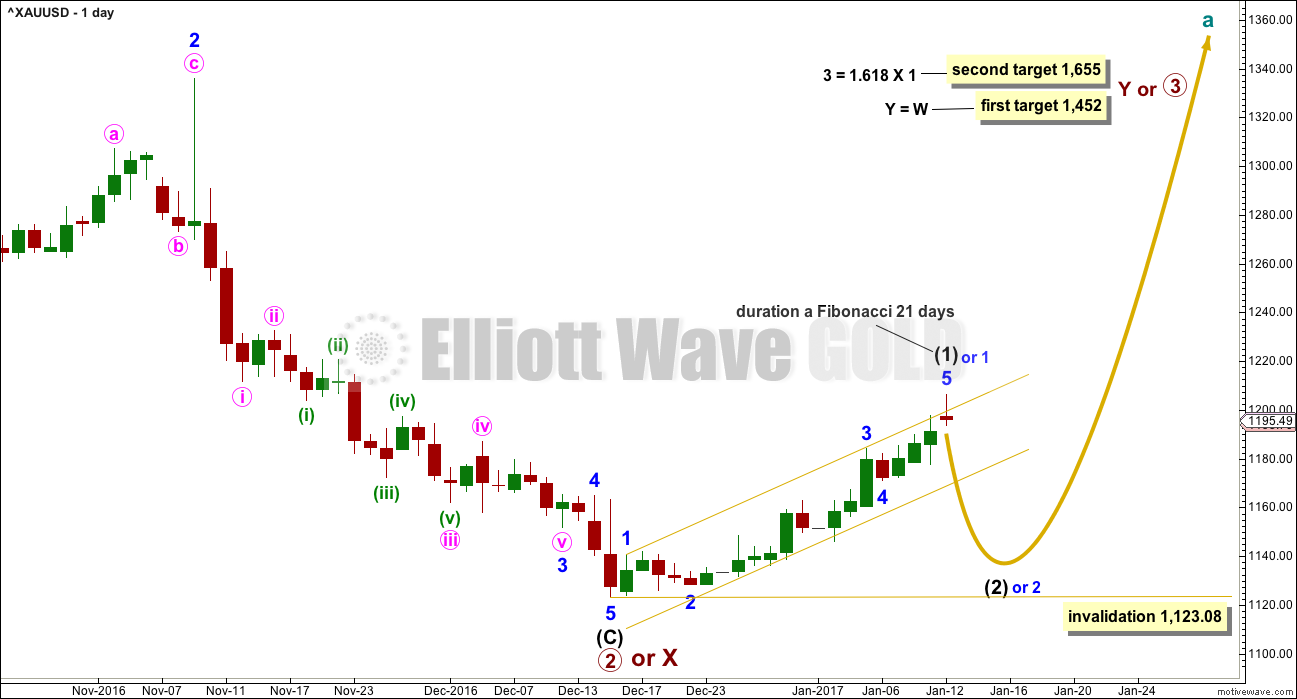
This main wave count expects Gold has had a primary degree trend change in December 2016. The new upwards wave is either a primary degree third wave, or a primary degree zigzag to complete a double zigzag.
Intermediate wave (1) is reasonably likely to be over today, lasting a Fibonacci 21 days / sessions. The long upper wick on today’s candlestick is bearish. While price remains within the gold channel, it must be accepted that minor wave 5 may extend higher. A breach of the gold channel on the daily chart would provide strong indication of a trend change.
The first in a series of second wave corrections for Gold’s new impulses is usually very deep. Intermediate wave (2) is expected to be at least 0.618 the depth of intermediate wave (1), and very likely may be deeper. It may not move beyond the start of intermediate wave (1) below 1,123.08.
The upcoming correction for intermediate wave (2) should present an opportunity to join a new trend.
Intermediate wave (2) may be at least as long in duration as intermediate wave (1), and fairly likely it may be longer. A Fibonacci 21 or 34 sessions will be the expectation. Corrections are often more time consuming than impulses.
HOURLY CHART
Click chart to enlarge.
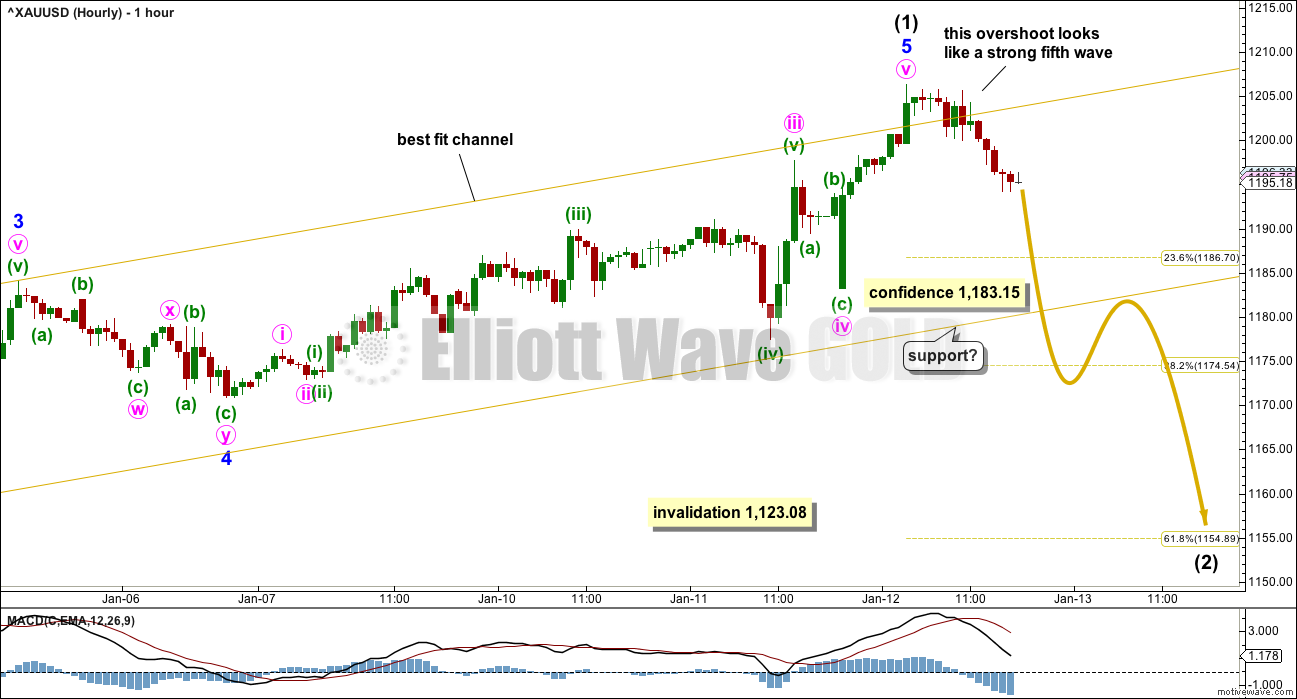
Upwards movement from the low on 15th of December will subdivide as a completed five wave impulse. This may be intermediate wave (1) as labelled, or the degree may be moved down one and it may only be minor wave 1 (as noted on the daily chart).
Minor wave 5 may have extended further today. There is no longer divergence with price and MACD for the final fifth wave. Strength is common for Gold’s fifth waves; this is not always seen, but Gold often exhibits blow off tops at all time frames. The overshoot of the upper edge of the channel looks fairly typical for a final fifth wave, but it also looks typical for the middle of a third wave. For this reason, while price remains within the channel, it must still be accepted that it is possible that it could continue yet higher.
Within intermediate wave (1), Fibonacci ratios are: minor wave 3 is 3.85 short of 6.854 the length of minor wave 1, and minor wave 5 is now just 0.56 short of 0.618 the length of minor wave 3.
Indication of a trend change would be a breach of the lower edge of the gold channel. That would provide reasonable confidence in a trend change.
A new low below 1,183.15 would provide price confidence in a trend change. At that stage, downwards movement could not be a second wave correction within a final fifth wave of minute wave v, so minute wave v would have to be over.
ALTERNATE ELLIOTT WAVE COUNT
DAILY CHART
Click chart to enlarge.
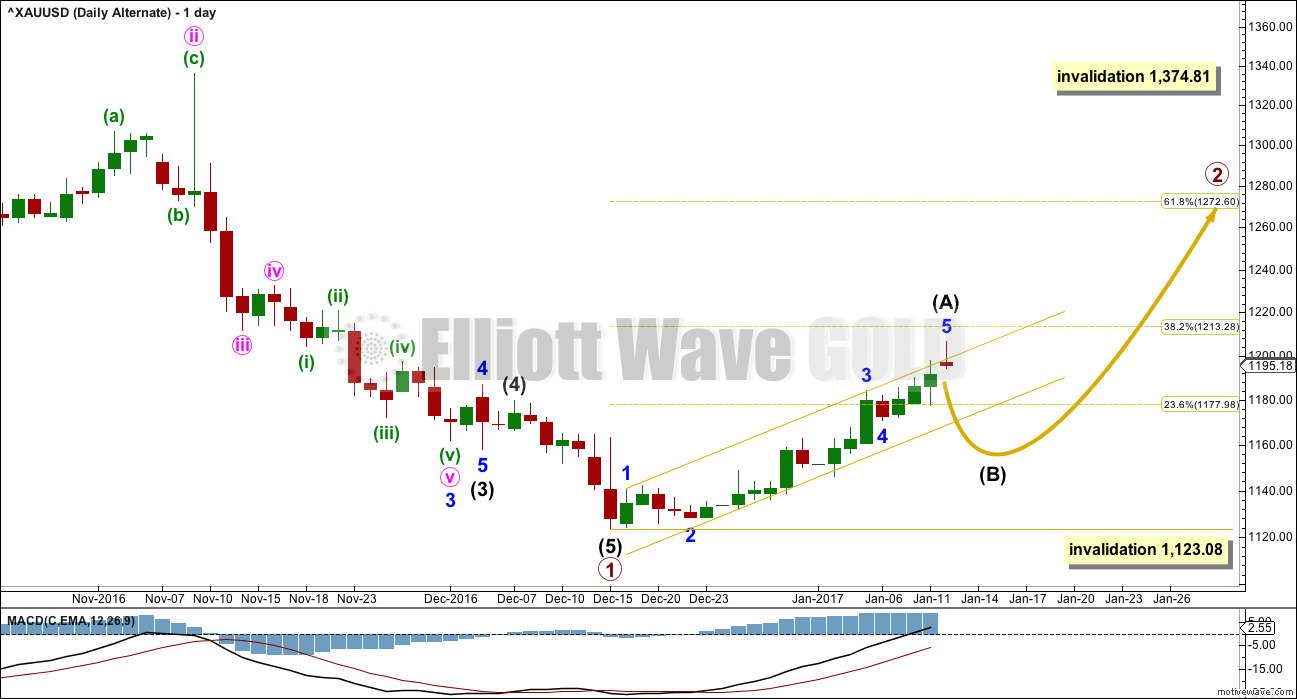
This alternate wave count expects that Gold is still within a bear market. Targets for new lows can be seen on weekly and monthly charts.
Within the bear market, a primary degree correction is underway.
Primary wave 2 is most likely to subdivide as a zigzag. So far it looks like a five up is either complete now or very close to completion. This may be intermediate wave (A). Intermediate wave (A) may now be complete lasting a total Fibonacci 21 sessions.
It is also possible to move the degree of labelling all down one degree within upwards movement for intermediate wave (A). It is possible that only minor wave 1 within intermediate wave (A) is complete. Either way the invalidation point remains the same. If a five up is complete, then the following three down may not move beyond its start below 1,123.08.
Primary wave 2 may not move beyond the start of primary wave 1 above 1,374.81.
TECHNICAL ANALYSIS
WEEKLY CHART
Click chart to enlarge. Chart courtesy of StockCharts.com.
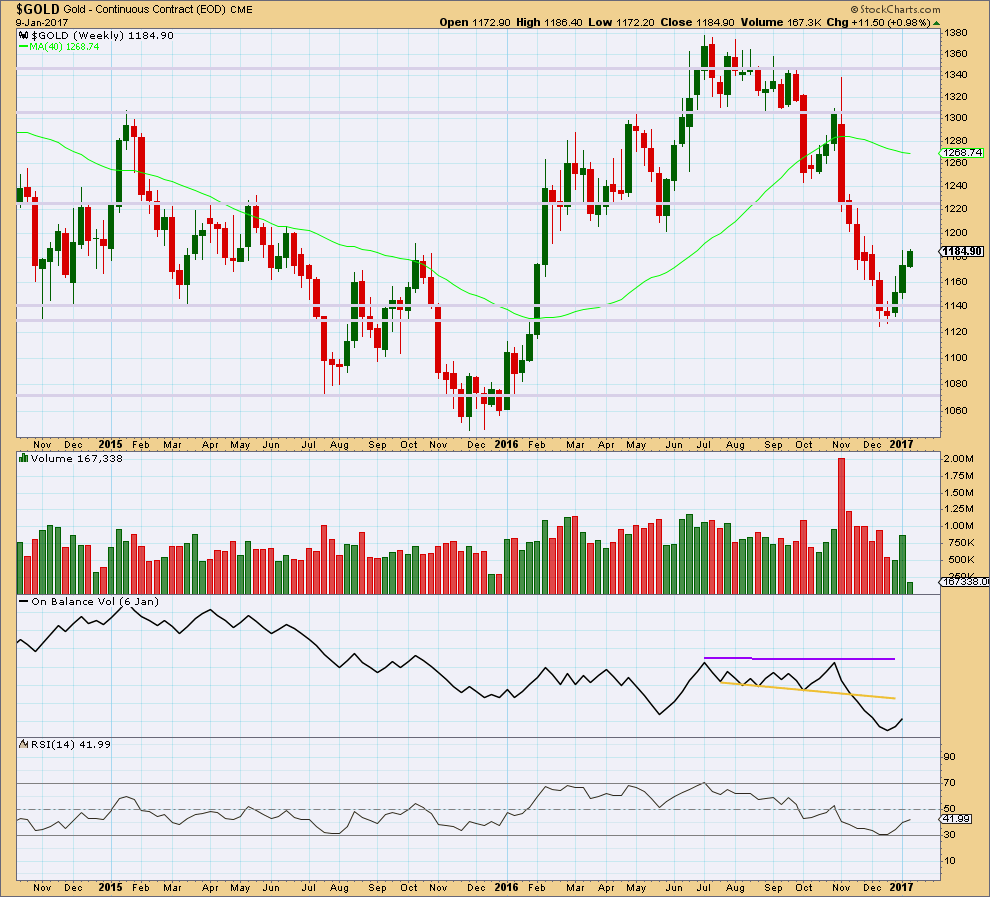
The fall in price to the last low was not supported by volume, so it should be suspicious.
The rise in price for the first two weeks has good support from volume (volume increased during the second week). The current week is incomplete, so no conclusion may be drawn at this stage for this week.
Price has found strong support about prior lines of support and resistance, about 1,140 and 1,130.
RSI almost reached oversold at the last low.
There is a Morning Star candlestick pattern at the low. At the weekly chart level, this is a reasonable reversal signal.
It would be reasonable to conclude that Gold has seen a trend change.
DAILY CHART
Click chart to enlarge. Chart courtesy of StockCharts.com.
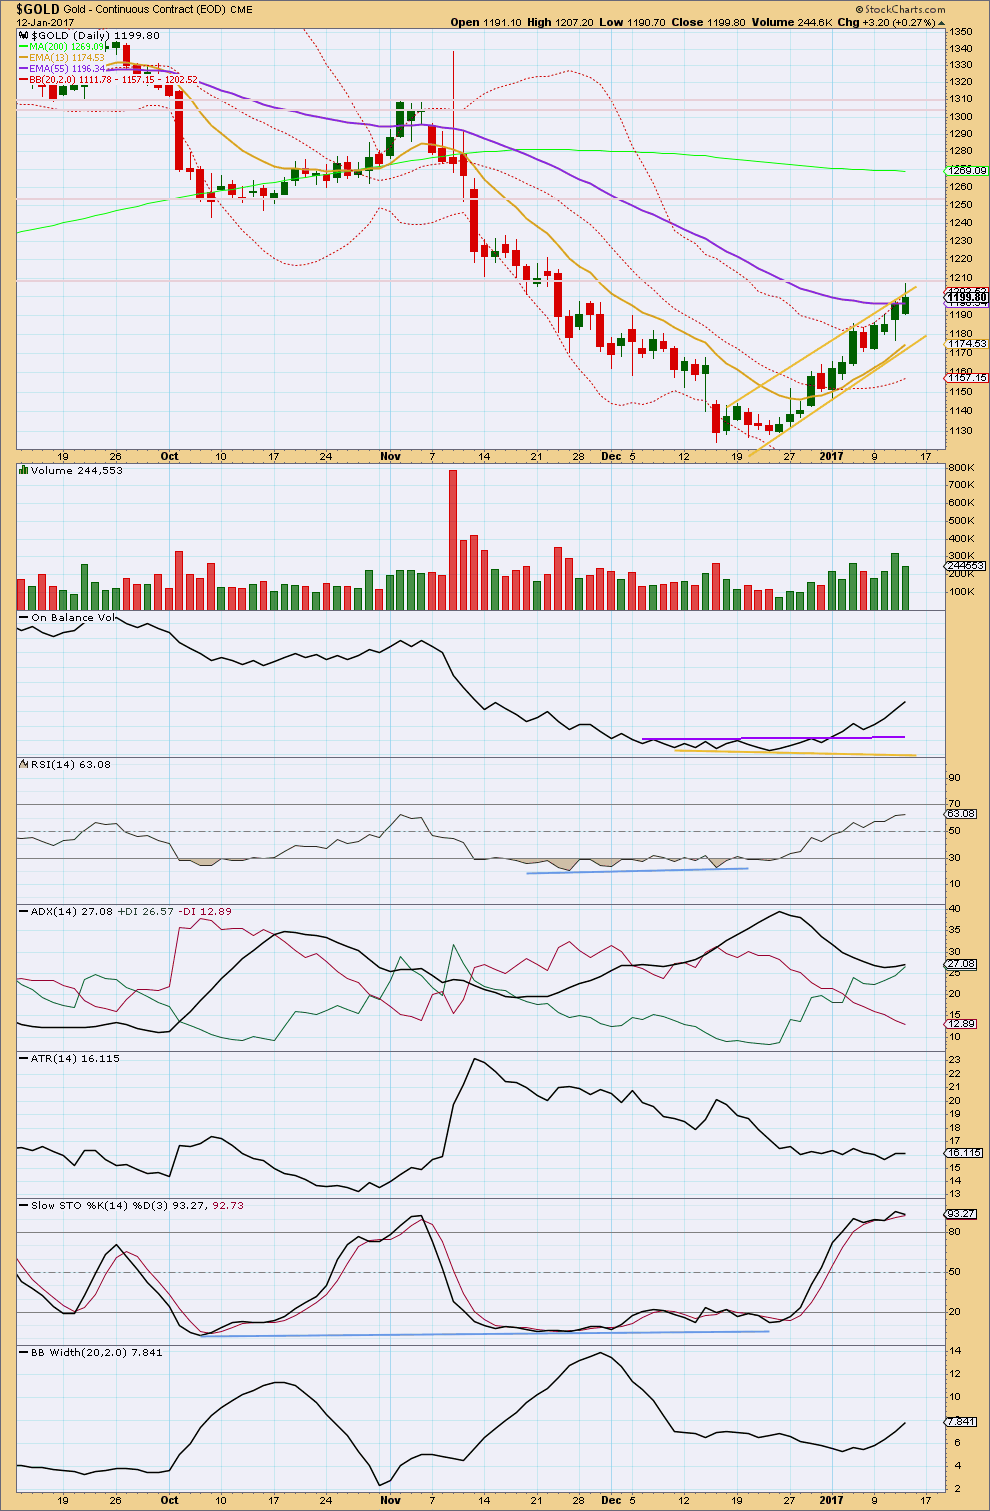
Another upwards day comes with a decline in volume. The rise in price today was not supported by volume, so it is suspicious. The long upper wick on today’s candlestick is bearish.
Price may have found resistance just below the horizontal line at 1,210 and close to the mid term Fibonacci 55 day moving average. Price has now closed four days in a row close to the upper edge of Bollinger Bands. A reversion to the mean is a reasonable expectation either here or soon. However, during Gold’s trends price can remain close to the edge of Bollinger Bands for reasonable periods of time, so this alone is not enough to indicate a high in place today.
The long term trend for Gold is still indicated as down with the long term 200 day moving average still pointing downwards. The mid term average may now be flattening off and the short term Fibonacci 13 day average is pointing up and providing support.
The short term average is still below the mid term average, which is still below the long term average. At this stage, the long term and mid term trends are still indicated as down. This would favour the alternate Elliott wave count. However, using moving averages in this manner is a lagging indicator.
On Balance Volume remains bullish. Support at the purple trend line is now some distance away.
RSI is bullish and exhibits no divergence with price to indicate weakness.
ADX is increasing and the +DX line is above the -DX line, indicating an upwards trend in place. With ADX below 35, there is room for this trend to continue. But this trend is in extreme territory with the black ADX line above both directional lines.
ATR is flat as price moves higher. This is normal for a correction within a trend, but also for the start of a new trend for Gold.
Stochastics is overbought, but this may remain extreme for reasonable periods of time during a trending market. This indicator points to an extreme trend, but it does not signal a trend change here.
Bollinger Bands are widening as price moves higher; this movement has volatility.
Overall, this analysis is still bullish. The bottom line is still that while price remains within the channel it may continue higher and an upwards trend is in place. The trend is nearing extreme though, so look out for a trend change and a pullback to come either here or soon.
GDX DAILY CHART
Click chart to enlarge. Chart courtesy of StockCharts.com.
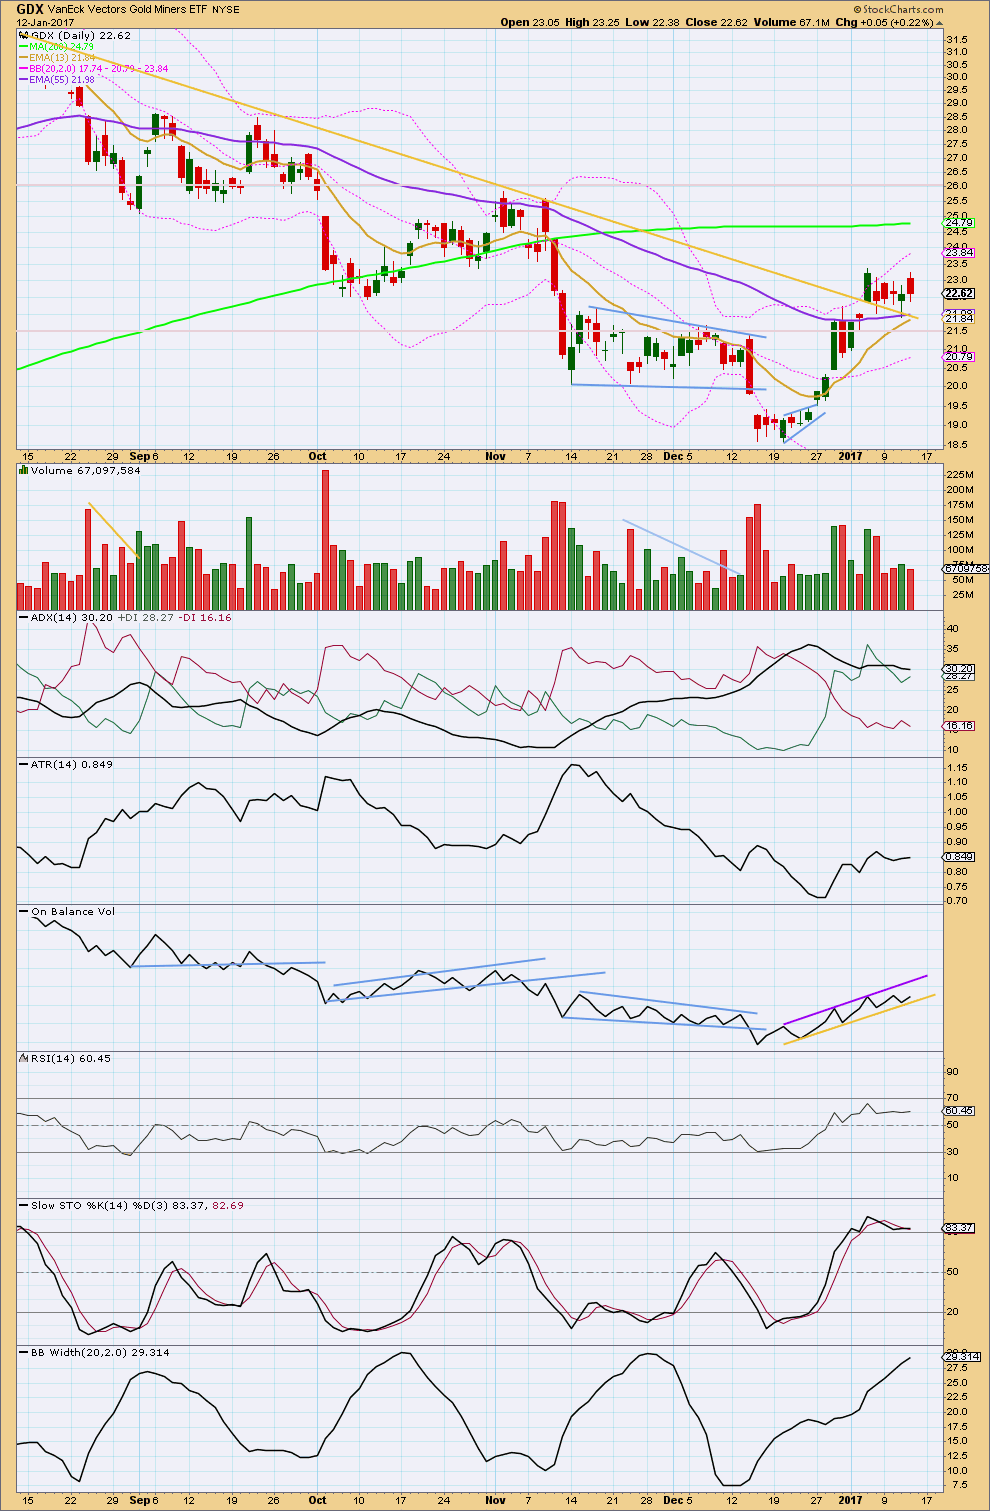
Although the daily candlestick is red, GDX today made a higher high and a higher low (the definition of upwards movement). The balance of volume today was upwards, and it was lighter than yesterday. The rise in price was not supported well by volume.
The larger trend for GDX looks to more likely be upwards as all three moving averages are all pointing up. However, if there is an upwards trend, it is very new. The short term average is still below the mid term, and both are still below the long term. A crossover of the short term above the mid term average would be a bullish signal.
This movement still looks very much like a consolidation within an upwards trend. Price may be finding support at the downwards sloping gold line.
ADX today is increasing, indicating an upwards trend.
ATR is overall increasing as price overall rises. This trend looks healthy.
On Balance Volume trend lines are today slightly redrawn (the lower line did not work over the last two sessions). If OBV can break below the yellow line, then a deeper correction may be underway. But while this line provides support, then it may serve to hold up the correction and force it to be shallow.
Stochastics is overbought still, but this can remain extreme for reasonable periods of time during a trending market.
Bollinger Bands are widening as price moves upwards indicating the trend is normal and healthy. BB’s are now nearing extreme though, so some contraction may now be expected soon that may see a deeper pullback or more time consuming sideways consolidation in price.
This analysis is published @ 06:57 p.m. EST.
[Note: Analysis is public today for promotional purposes. Member comments and discussion will remain private.]
The bottom line is still this: while price remains within the gold channel it is entirely possible that it could continue up. Which means this wave count is tentative, it needs some confirmation before we can have confidence in it.
Price is still in the channel and still above 1,183.15.
I’m seeing a rising wedge on the 15 minute gold chart which may signal a bearish break very soon… maybe the 1198 level or sooner.
Just trying to stimulate some conversation but I’m no expert.
Thanks!
If anyone has a count that would be great!
I thought Gold had started a wave 2 retracement, but it looks like it might be in a fourth wave and now going up for the final fifth? Very hard to fathom!
Gold back tested the 1200 mark and then began falling after the 8:30 economic data was posted that favored retail sales. However, at 10:00, economic news broke on consumer sentiment which wasn’t so favorable so gold began climbing steadily.
I’m just wondering if anyone has a wave count update that they could share. Gold has not fallen below Lara’s confidence level mark of 1183 so I’m assuming a bumpy ride.
Dreamer – Thanks so much for the thought out explanation you shared with me a few days ago.
Thanks!
It looks like GDX confirmed a FLAT correction is in progress. Looking for a 5 wave move down to complete the correction, possibly in another 3 days for a total Fib correction of 8 days.
GDX started correcting before Gold and may finish it’s correction before Gold.
Thank you Dreamer for the updated GDX Elliott wave count. Nicely done 🙂
Hi Dreamer. First, thanks for supplying these charts and analyses. Great work. I’m working a long trade in GDX right now, because i feel this is bullish action lately in gold and gold stocks. Of course, i could be wrong, and we’ll see soon. Have you considered that this is a triangle forming for a possible wave 4, or some kind of combination that might even be a wave 2.