
A small upwards day has made a slight new high.
Both Elliott wave counts remain the same.
Summary: The bottom line is still that it must be accepted there is no indication yet of an end to this upwards wave while Gold remains within the channel and above the confidence point of 1,198.79. Targets are now 1,234 or 1,288. If price breaks below the lower edge of the gold channel, then a target for a deep correction would be at or below 1,160.
New updates to this analysis are in bold.
Last monthly and weekly charts are here. Last historic analysis video is here.
Grand SuperCycle analysis is here.
MAIN ELLIOTT WAVE COUNT
DAILY CHART

Click chart to enlarge.
This main wave count has a better fit for prior movement. To see the difference between this main wave count and the alternate below please refer to last historic analysis linked to above.
This main wave count expects Gold has had a primary degree trend change in December 2016. The new upwards wave is either a primary degree third wave, or a primary degree zigzag to complete a double zigzag.
Intermediate wave (1) has so far lasted 29 days. If it continues for another 5, it may complete in a total Fibonacci 34. This would see intermediate wave (1) end on the 30th of January.
So far price remains within the gold channel. A breach of the gold channel on the daily chart would provide strong indication of a trend change.
While price remains within the gold channel, then it must be accepted that it is likely to continue higher. A breach of the gold channel would indicate intermediate wave (1) is over and intermediate wave (2) has arrived.
The first in a series of second wave corrections for Gold’s new impulses is usually very deep. Intermediate wave (2) is expected to be at least 0.618 the depth of intermediate wave (1), and very likely may be deeper. It may not move beyond the start of intermediate wave (1) below 1,123.08.
Intermediate wave (2) may be at least as long in duration as intermediate wave (1), and fairly likely it may be longer. Corrections are often more time consuming than impulses.
Gold often exhibits swift strong fifth waves, but this does not have to happen for minor wave 5. But it is a common tendency, so traders should look out for it.
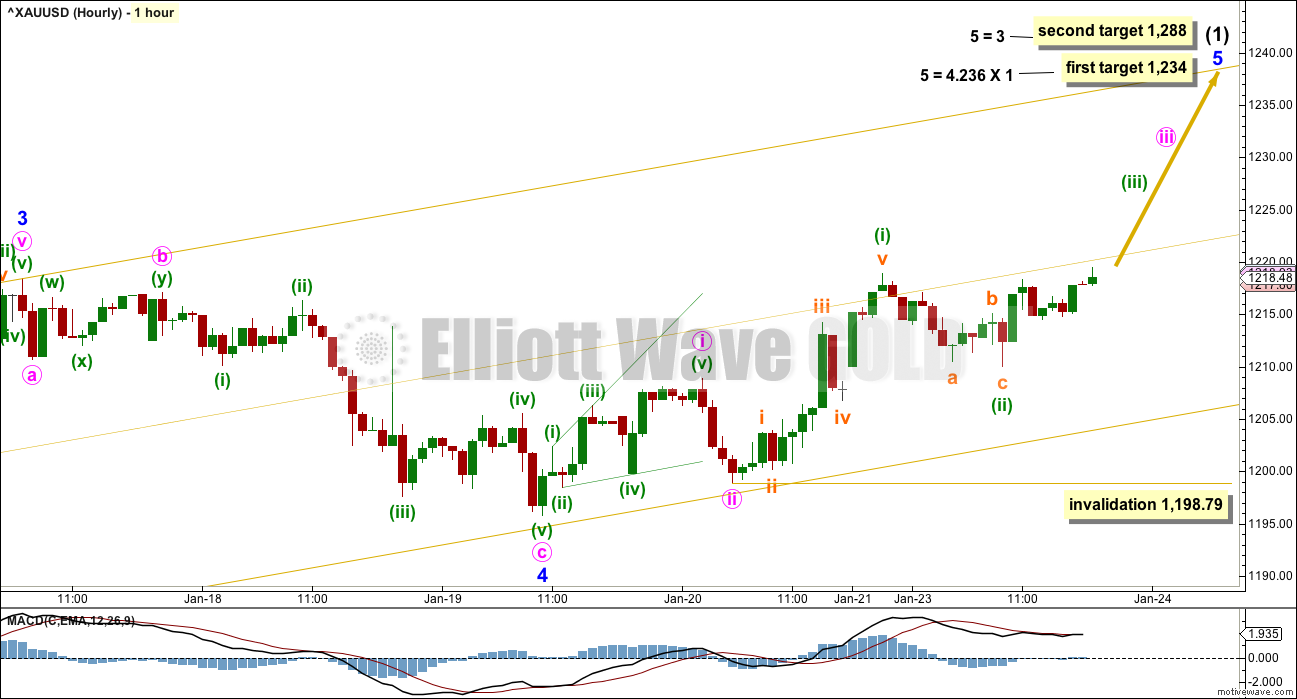
HOURLY CHART
Click chart to enlarge.
To see detail of all of intermediate wave (1) so far on the hourly chart click here.
Each time price comes close to the lower edge of the channel it presents another opportunity to join the trend.
If price comes back down to the lower trend line and moves quickly through it, then the probability of this main hourly wave count would substantially reduce. At that stage, consider the alternate below.
Minor wave 1 was short. Minor wave 3 was extended. It is very common for Gold to exhibit swift strong and extended fifth waves, so that is what the targets will expect.
A first wave up within minor wave 5 may be complete. At this stage, it will be labelled at minute degree but this may change because it may be needed to be moved down one degree. This movement fits as a leading expanding diagonal followed by a very deep correction.
The first wave up of minuette wave (i), within minute wave iii, now looks complete. Minuette wave (ii) may be complete here, or it may continue further as a flat, double zigzag or double combination. If it continues further, minuette wave (ii) may not move beyond the start of minuette wave (i) below 1,198.79.
Along the way up, corrections for this wave count should find support at the lower edge of the channel.
If minor wave 5 is a swift strong movement, then price may break above the upper edge of the channel.
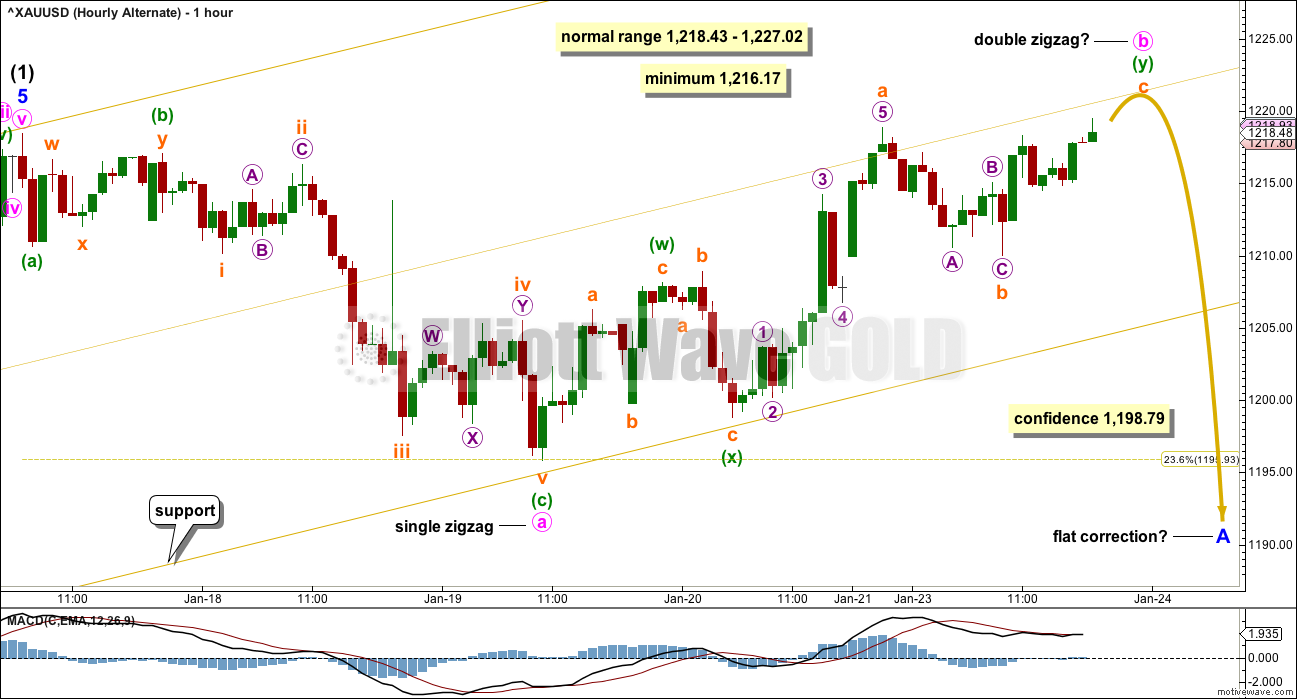
ALTERNATE HOURLY CHART
Click chart to enlarge.
A new wave at intermediate degree should begin with a clear five down on the hourly chart. This has not happened.
At this stage, I have not been able to see a solution on the five minute chart which sees the downwards wave labelled minute wave a as a five wave structure. It will fit well as a completed zigzag.
The lack of a five down reduces the probability of this wave count. This wave count is published in the spirit of always considering possibilities, even those which are unlikely.
What if intermediate wave (1) is over? What if intermediate wave (2) has begun?
If the first small movement down is a three and not a five, then minor wave A may be unfolding as a flat correction. This would indicate intermediate wave (2) may be unfolding as a flat correction, with minor wave A within it also a flat correction.
Within the possible flat correction of minor wave A, the upwards wave of minute wave b has now retraced a minimum 0.9 length of minute wave a at 1,216.17. The normal range for minute wave b within a flat correction is from 1 to 1.38 the length of minute wave a, giving a range from 1,218.43 to 1,227.02.
Minute wave b may make a new price extreme above the end of minute wave a at 1,218.43. There is no upper invalidation point for this wave count.
There is no Elliott wave rule stating a maximum length for B waves within flats (or X waves within combinations). There is a convention within Elliott wave which states when the potential B wave is longer than twice the length of the A wave the idea of a flat (and combination) should be discarded based upon a very low probability. This wave count would be discarded above 1,241.
ALTERNATE ELLIOTT WAVE COUNT
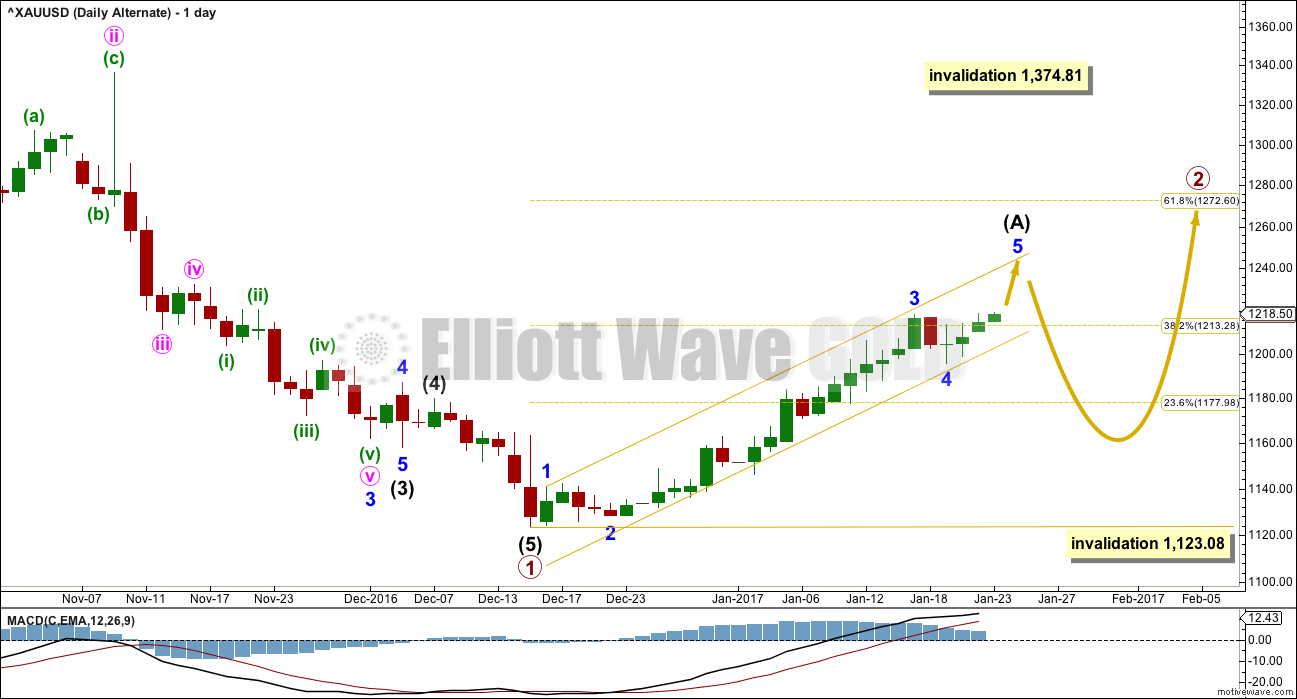
DAILY CHART
Click chart to enlarge.
This alternate wave count expects that Gold is still within a bear market. Targets for new lows can be seen on weekly and monthly charts.
Within the bear market, a primary degree correction is underway.
Primary wave 2 is most likely to subdivide as a zigzag. So far it looks like a five up is either complete now or very close to completion. This may be intermediate wave (A).
Intermediate wave (B) may not move beyond the start of intermediate wave (A) below 1,123.08.
Primary wave 2 may not move beyond the start of primary wave 1 above 1,374.81.
TECHNICAL ANALYSIS
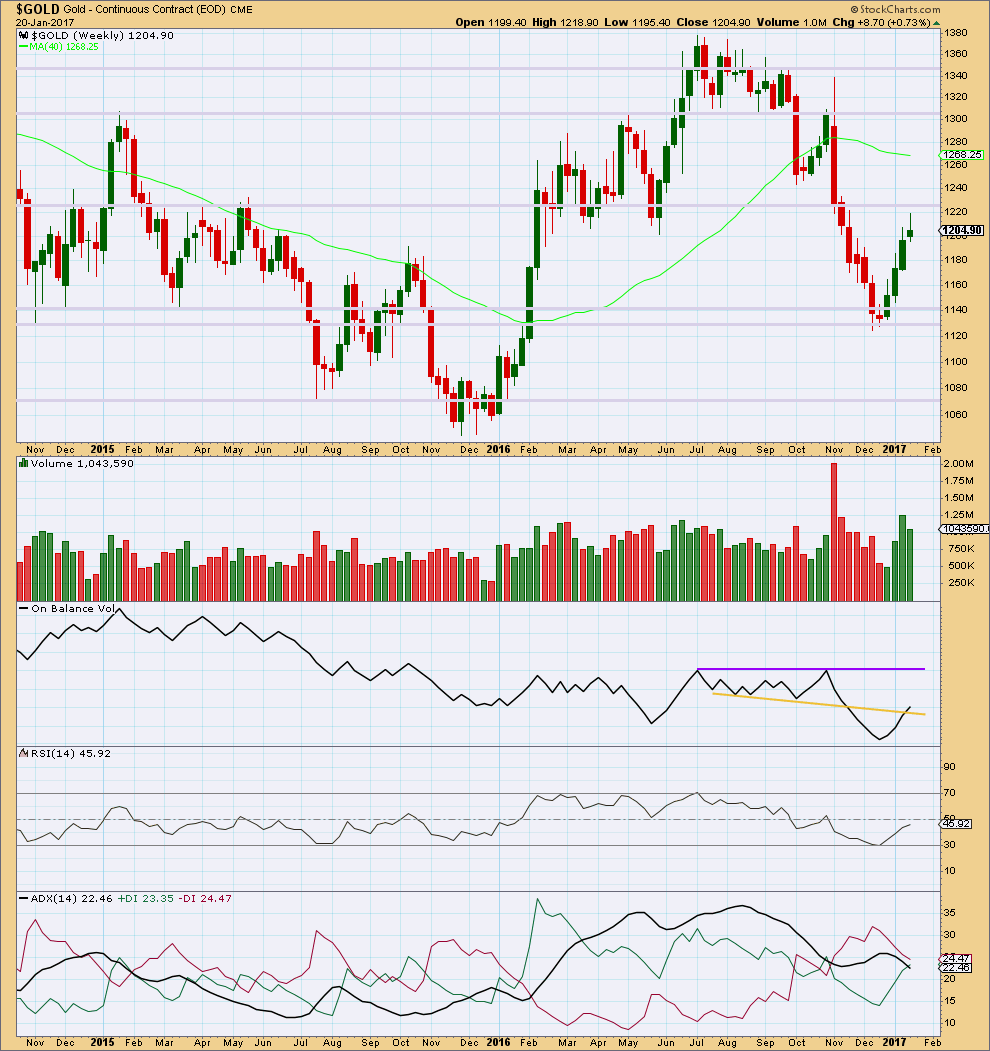
WEEKLY CHART
Click chart to enlarge. Chart courtesy of StockCharts.com.
The first three weeks of upwards movement came with a steady increase in volume to support the rise in price, but last week saw a decline in volume. This indicates some weakness for last week.
The long upper wick and small real body of the last weekly candlestick is slightly bearish. This is not a reversal signal at all but only a warning of internal weakness. This upwards trend will either end or see a correction at the weekly chart level; trend changes are often preceded by signs of weakness.
Price may find some resistance about 1,225.
On Balance Volume gave a weak bullish signal last week. The signal is weak because this line has been broken before. The purple resistance line offers stronger technical significance.
At the weekly chart level, RSI is increasing along with price.
ADX is still declining, indicating the market is not yet trending (but this is a lagging indicator). ADX has not yet indicated a trend change from down to up; the -DX line remains above the +DX line.
DAILY CHART
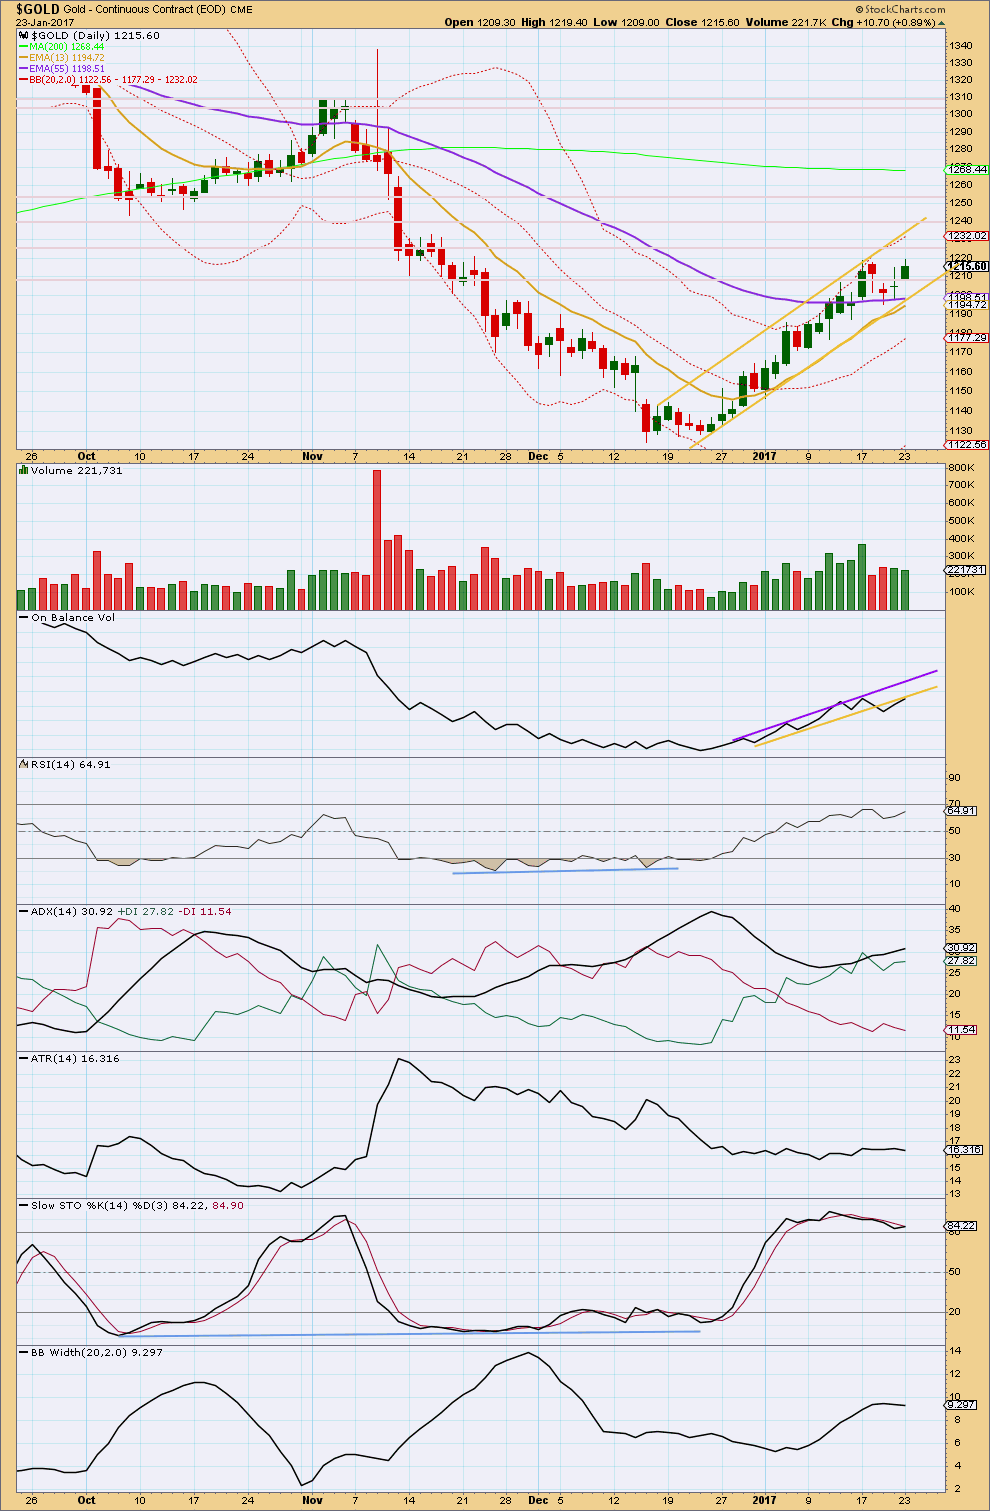
Click chart to enlarge. Chart courtesy of StockCharts.com.
Price remains within the parallel channel and continues higher. Only when the lower edge of the channel is clearly breached should a trend change be expected. Until that happens assume that the upward trend continues.
A slight new high today comes with a small decline in volume. The rise in price is not supported by volume, so it should be suspicious. This supports the alternate hourly Elliott wave count.
On Balance Volume may provide resistance and halt the rise in price here. This supports the alternate hourly Elliott wave count.
There is slight weak bearish divergence today with a slight new high for price that is not matched by a new high for RSI. This supports the alternate hourly Elliott wave count.
ADX is still increasing, indicating there is an upwards trend. The trend is in extreme territory as the black ADX line is above both directional lines. But ADX is not yet above 35, so there is room for this trend to continue.
ATR continues to be flat as price moves higher. This is normal for Gold, for both a larger correction within a trend or for the first wave within a new trend. It is impossible to tell which scenario is correct for Gold from ATR.
Stochastics now exhibits double bearish divergence with price and is overbought. This also support the alternate hourly Elliott wave count.
Bollinger Bands are now contracting; this trend now has declining volatility. This may also be interpreted as support for the alternate hourly Elliott wave count.
GDX DAILY CHART
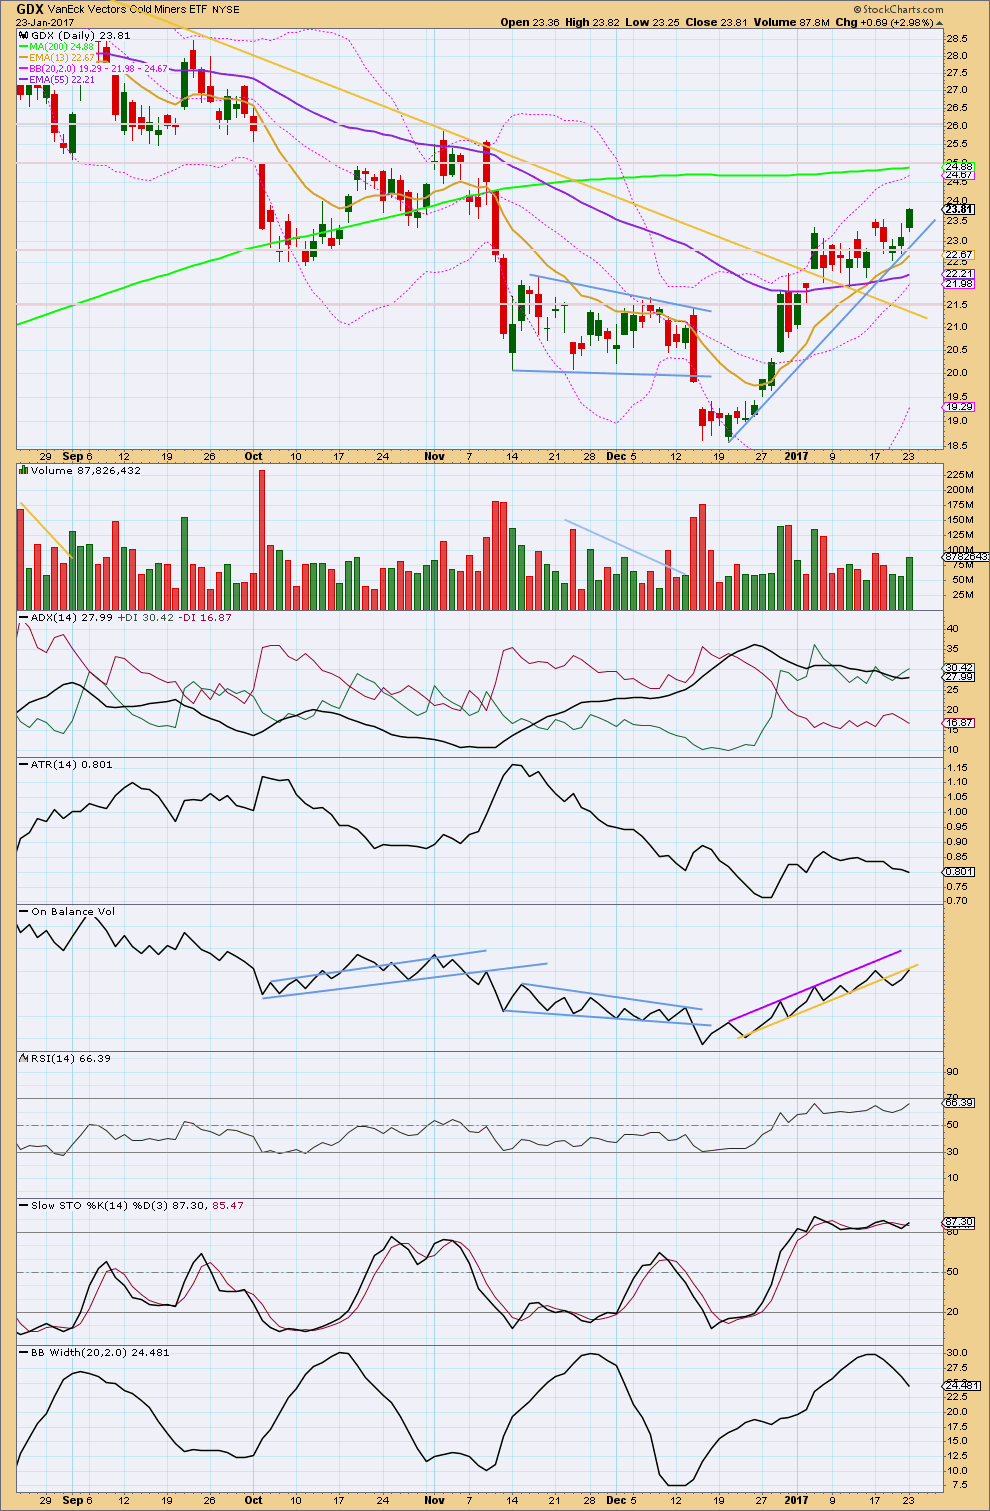
Click chart to enlarge. Chart courtesy of StockCharts.com.
Last analysis for GDX was more bearish than bullish, yet price today has made a new high. Despite strongest volume days within the last ten day consolidation being downwards, an upwards breakout today was seen.
Price closed above the prior upper range of the consolidation on a day with an increase in volume. This looks like a small upwards breakout.
ADX is today increasing and the +DX line is above the -DX line, so an upwards trend is indicated. The trend is not extreme: the ADX line is below the +DX line and below 35.
ATR is declining after a period of consolidation.
On Balance Volume moved higher today and found resistance at the yellow line, which previously offered support. This may serve to halt the rise in price here.
RSI is not yet overbought. There is room for price to rise further.
Stochastics is overbought and exhibits multiple divergence with price. This is bearish, but it cannot signal when a high is found.
Bollinger Bands reached extreme and are now contracting. This is also bearish.
A blue support line is drawn on price. The bottom line for GDX is that while price remains above this line expect it to continue upwards. If that line is breached by a full daily candlestick below and not touching the line, then it would indicate a trend change and the start of a deep pullback for GDX.
Overall, this GDX analysis today is neutral.
This analysis is published @ 07:28 p.m. EST.
So this is just one idea at the hourly chart level.
If price can break below the lower gold trend line then this would be a good wave count, it would then be my main wave count.
I’d rather see intermediate (1) over at the last high than trying to see intermediate (2) beginning earlier and starting with an expanded flat for minor A.
This looks better.
But… notice how price is bouncing up off the lower gold trend line right now. This has happened before, and each time Gold has continued higher.
We have zero confirmation of a trend change.
I may take a punt on a small long position here, and accept the possibility of a loss. I may risk about 1-2% of equity, with my stop about 1,204.91. Just an eyeball of what if the channel is breached. I don’t want to be long if that trend line is breached.
There is now a full hourly candlestick below and not touching the lower edge of the channel. I’m exiting my small long position for a small loss, and entering a short here.
I’ll place my stop now just above the trend line, allowing for an overshoot. But if price breaks back above that line I don’t want to be short (or long either actually) because then something else may be happening.
I’ll place my stop for a short about 1,211
Despite the impressive decline, we do not actually have a confirmation of a trend change. While I like the corresponding charts in the dollar index and the Euro, I am going with Lara’s mantra of assuming the trend remains the same until PROVEN otherwise. Keeping my powder dry until tomorrow. Have a great evening all!
thanks Verne…you too
We should get confirmation of the trend change thesis by a fall in the Gold price below 1198 by the close today. The big question in the event that happens is how deep the correction will be. I think the overall picture is quite bullish and I would not want to get to comfy on the short side of the metals, even with the upcoming pullback. The final trigger for my aforementioned trades will be the 1198 level in Gold. That I think will trump all the other indicators.
If we get a breach of the gold channel I’m drawing on the Gold charts, then I’d be expecting the pullback has begun. Right now price has found that line and has bounced up.
The safest most conservative way to approach this pullback would be to wait patiently for it to end, then enter long when it gets very deep. And hold on.
That may be how I’ll play it.
But… it could be time consuming. It could last weeks. How long can one wait patiently?
I know a lot of smart traders who are already long the metal and miners and plan on remaining thus for the foreseeable future. Sometimes these bull runs simply refuse to offer a clear and convincing entry point and one can spend an eternity, as it were waiting for such and opportunity. I will keep a close eye on my SLV proxy and will probably take the plunge, whatever the count, if it manages a close above 16.32. I would enter with only one half full position though as we could still see a substantial retreat. If both Silver and the SLV etf can safely clear this area of congestion I suspect it would become future support and a good place for a stop.
There is another reason why that approach may indeed be the wisest course. By the time we get a confirmation of the correction in progress with a move below 1198, price would already be close to the minor fourth around 1195 with limited reward/risk for a short side trade.
The dollar index appears to have put in a double bottom at around 99.9
FXE is in the process of printing a gravestone doji.
SLV has once again been rejected at the 16.32 prior gap.
UUP is printing a hammer with a revisit to the December 5 low around 25.80
If these signals persist into the close, I will be re-loading Feb 17 SLV 16.5 strike puts, adding UUP Feb 17, 25.50 strike calls, and adding FXE Feb 10 104 strike puts.
Extremity of price and sentiment are no longer useful in giving traders some sense of what price in markets is likely to do these days. We seem to be in a kind of Never-Land when it comes to the trading landscape. I still think looking at proxies is one way to try an navigate admittedly very difficult straits. The chart of the Euro has behaved reasonably well as it has approached its upper BB in the past. Of course that is not to say with any certainty that it will continue to do so. Along with the strong resistance SLV is encountering at the prior 16.32 gap, the Euro may be signaling an imminent turn in the metals. The last time we saw a double penetration of the upper BB was back in late July and August last year. This was followed by a brief pullback on the way to to new highs. I suspect once again any imminent pullback will be brief as both metals and the Euro plow on higher. SLV back above 16.32.
I should have maintained some discipline and waited for a close above the prior gap. Lets see if it can hold on to it this attempt.
SLV apparently still facing substantial overhead supply in the 16.32 area along with Silver attempting to break out of an area of stiff resistance. Action somewhat weak for a third wave I think.
Stopped out and I mean immediately! I knew it would not take long. I think we just had a blow-off end to minor five. If I am right, look for SLV 15.87 to fall in short order.
Dreamer
Can you post silver 4 hour chart going back to Nov 1 2016?
This is huge HnS and silver has been trying to break the NL at 17.25 for alt several month.
Thanks.
Executing a very short term trade to take advantage of Silver’s demonstrated ongoing strength. Buying the Jan 27 SLV 16.00 strike calls for 0.38 per contract looking for a move to at least 16.50. I am placing a hard stop at 16.31 and the nice thing about this trade is that I will know if I am wrong before the close today. 🙂
Silver is still finding really strong resistance at this long held trend line though Verne.
A bit squashed up, but this is how I’m drawing the line for Silver. There’s the smallest of overshoots today, but the line isn’t breached.
Oh my you are right! That really explains why SLV kept running into a brick wall around the 16.32 area. Thanks for the heads-up chart. It is a real eye-opener. I set a brutally tight stop at 16.31 for my short lived long SLV trade today and got bounced almost immediately. It does look as if the white metal is headed lower, with definite implications for its yellow cousin I would wager.
It took it its time but SlV now above the second previous gap at 16.32. If it closes above a short term long trade would be attractive.
Lara.
What if the Main Count is actually as I surmised yesterday? The point you have labelled as Minute 1 is actually Minor 3, and Minute 2 is Minor 5. So, the movement up from 1210.02 is Minor 5. This will lead to 1230-1234 target.
With the count as labelled, the target will be hitting 1288.
Like this?
I’m very visual, so I have to put it on a chart to see.
I’ve avoided the problem of a truncated fifth wave for minute v to end minor 3 by making minute iv a running contracting triangle. But that triangle looks wrong; it doesn’t adhere to it’s trend lines and it’s not supported by MACD.
I have a better solution today Alan.
The main count has Gold at the threshold of the middle of a third wave up but unless the metal is playing possum, momentum is strangely lacking. A third wave up should should have blown past SLV 16.32 in pre-Market Price action
GDX inverted H&S targets
Here it is Papudi. Inverted H&S targets 1,243
Thanks Dreamer.
That’s what I am seeing.
A trained chartist can see the bullish/bearish similar to Lara who can see the wave counts.
A massive HnS has formed in 1 hour period.
Gold is having resistance around RS 1211. Once it breaks above NL 1218 it will have impulse move to Lara”s target for several days.
That will establish Feb high in seasonality time frame. Then the big correction of wave 2 for the typical March low.
Looks pretty bullish. Gold Miner breakout vs SPX. Chart by Gary
Here’s an updated daily look at GDX that I haven’t posted in awhile.
GDX made a new high today, closing strong on higher volume and appears to be breaking out upward from a broadening top pattern.
Based on this price movement, I have swapped to my more bullish count.
The alternate expanded flat idea is still shown in Orange. For this to be viable, price should turn downward before 24.79.
Hurst cycles analysis below. I am not knowledgeable on this so don’t ask any questions!
It does seem consistent with the longer term EW count though.
http://hurstcycles.com/gold-revisited/?utm_source=feedburner&utm_medium=email&utm_campaign=Feed%3A+HurstCycles+%28Hurst+Cycles%29#sthash.Gklhn2Bf.dpbs