
Downwards movement ended 1.58 below the first target. A breach of the small channel on the hourly Elliott wave chart indicated a trend change, which was expected.
Summary: A little upwards movement on Monday and maybe also Tuesday is expected to end about 1,205. This small bounce may present another opportunity to join the short term downwards trend. I do not expect to see a new high above 1,219.11.
New updates to this analysis are in bold.
Last monthly and weekly charts are here. Last historic analysis video is here.
Grand SuperCycle analysis is here.
MAIN ELLIOTT WAVE COUNT
DAILY CHART
Click chart to enlarge.
This main wave count has a better fit for prior movement. To see the difference between this main wave count and the alternate below please refer to last historic analysis linked to above.
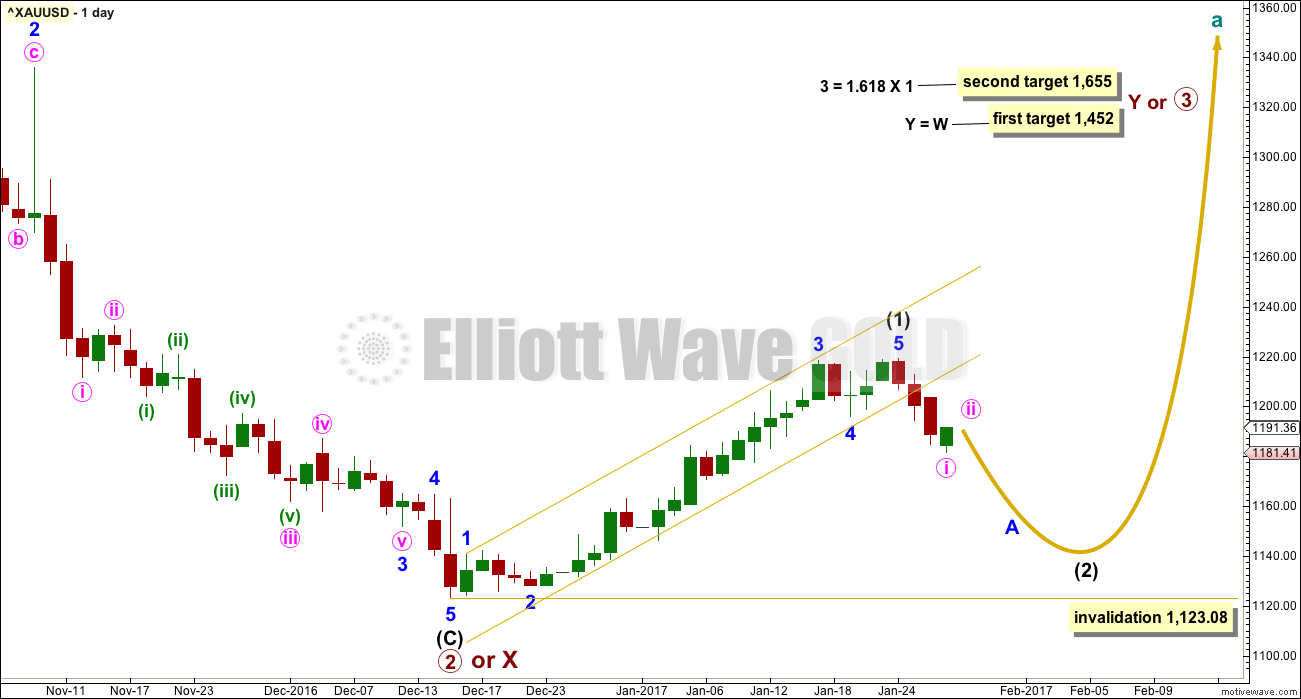
This main wave count expects Gold has had a primary degree trend change in December 2016. The new upwards wave is either a primary degree third wave, or a primary degree zigzag to complete a double zigzag.
Intermediate wave (1) lasted 30 days. Intermediate wave (2) may be about even in duration (it may last a Fibonacci 34 days), or it may be longer lasting because corrections are often more time consuming than the impulses they correct. If it does not end in a total Fibonacci 34 days, then the next Fibonacci number in the sequence is 55.
The first in a series of second wave corrections for Gold’s new impulses is usually very deep. Intermediate wave (2) is expected to be at least 0.618 the depth of intermediate wave (1), and very likely may be deeper. It may not move beyond the start of intermediate wave (1) below 1,123.08.
HOURLY CHART
Click chart to enlarge.
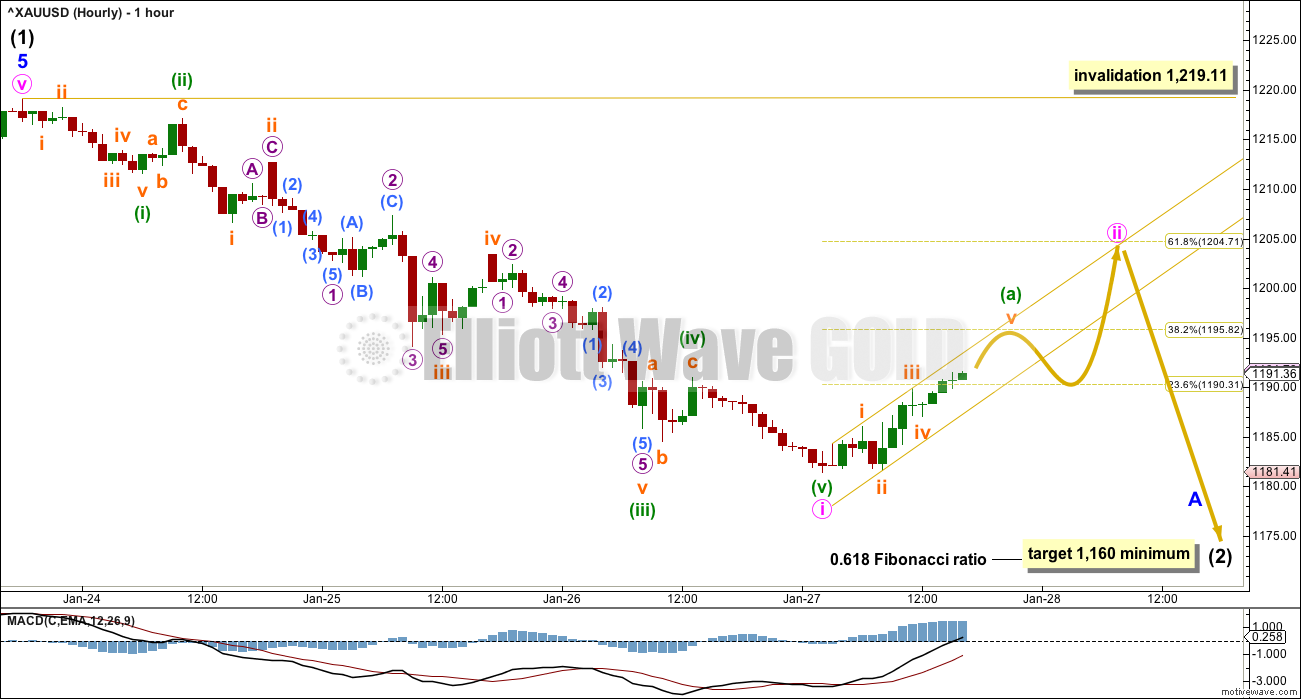
A movement at intermediate degree should begin with a five down at the hourly chart level. This is now complete.
Minute wave ii may not move beyond the start of minute wave i above 1,219.11.
Ratios within minute wave i are: minuette wave (iii) is 0.73 short of 4.236 the length of minuette wave (i), and there is no adequate Fibonacci ratio between minuette wave (v) and either of minuette waves (i) and (iii).
Intermediate wave (2) has so far lasted only three days. It should have a reasonable proportion to intermediate wave (1), so at this stage it is very unlikely that minor wave A is close to completion. Minor wave A should continue lower for a few days yet at least.
The target of 1,160 for intermediate wave (2) is a minimum. It is fairly likely to be deeper than the 0.618 Fibonacci ratio of intermediate wave (1). Within intermediate wave (2), when it arrives minor wave B should be a reasonable upwards or sideways movement. At that stage, it would be wisest to exit this market and wait patiently for minor wave C downwards to arrive. B waves do not present good trading opportunities.
At this stage, short positions should have been closed when upwards movement broke above the downwards sloping channel on the hourly Elliott wave chart in last analysis. There may be another opportunity to enter a short position at the end of minute wave ii.
Minute wave i lasted three days. Minute wave ii may last about two to three days. It may end on Monday or Tuesday next week.
ALTERNATE ELLIOTT WAVE COUNT
DAILY CHART
Click chart to enlarge.
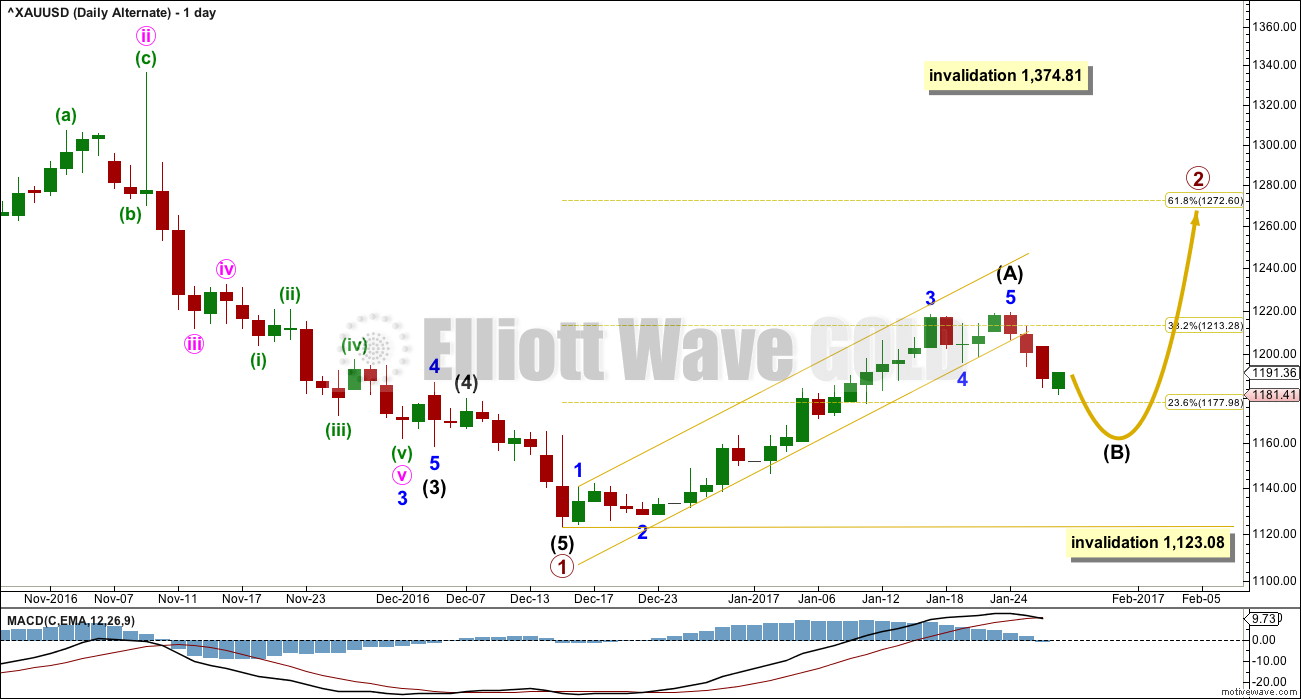
This alternate wave count expects that Gold is still within a bear market. Targets for new lows can be seen on weekly and monthly charts.
Within the bear market, a primary degree correction is underway.
Primary wave 2 is most likely to subdivide as a zigzag. Intermediate wave (A) is complete and a correction for intermediate wave (B) has begun.
Intermediate wave (B) may not move beyond the start of intermediate wave (A) below 1,123.08.
Primary wave 2 may not move beyond the start of primary wave 1 above 1,374.81.
TECHNICAL ANALYSIS
WEEKLY CHART
Click chart to enlarge. Chart courtesy of StockCharts.com.
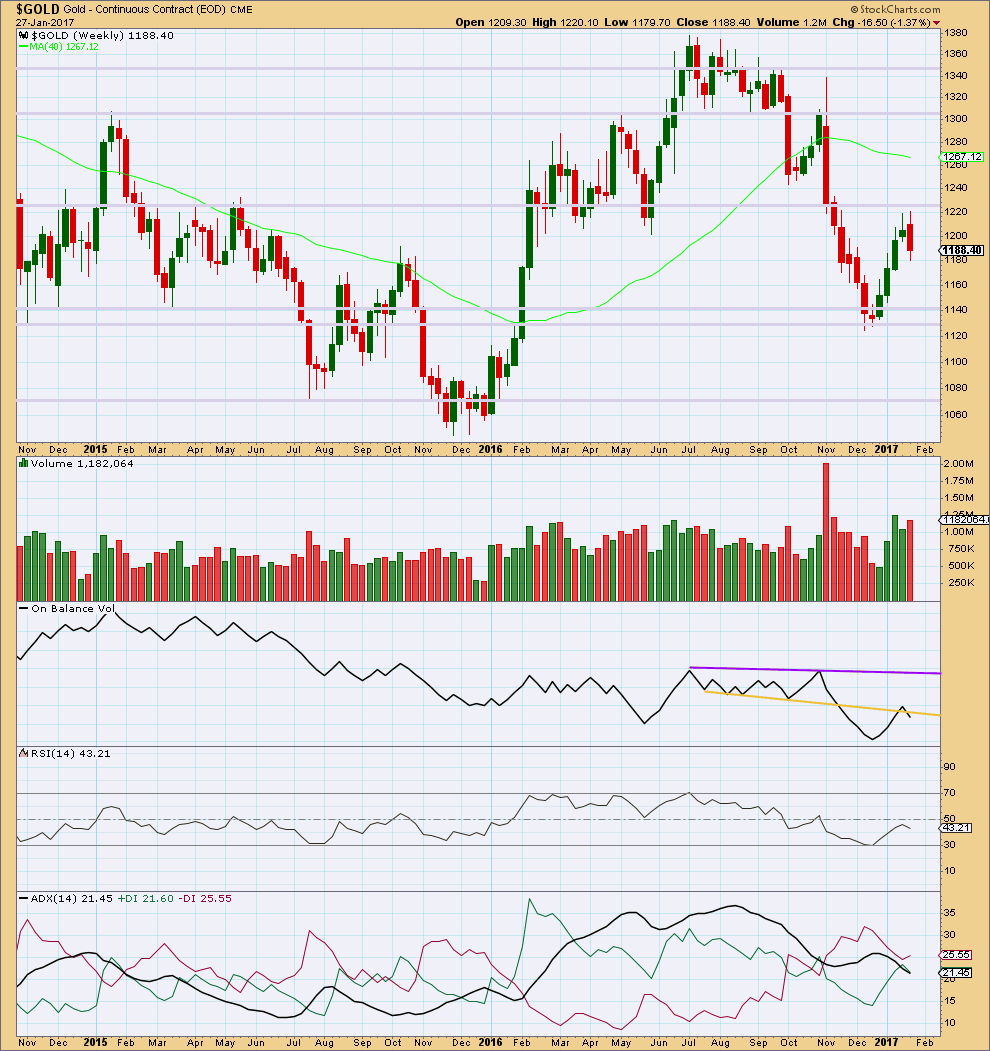
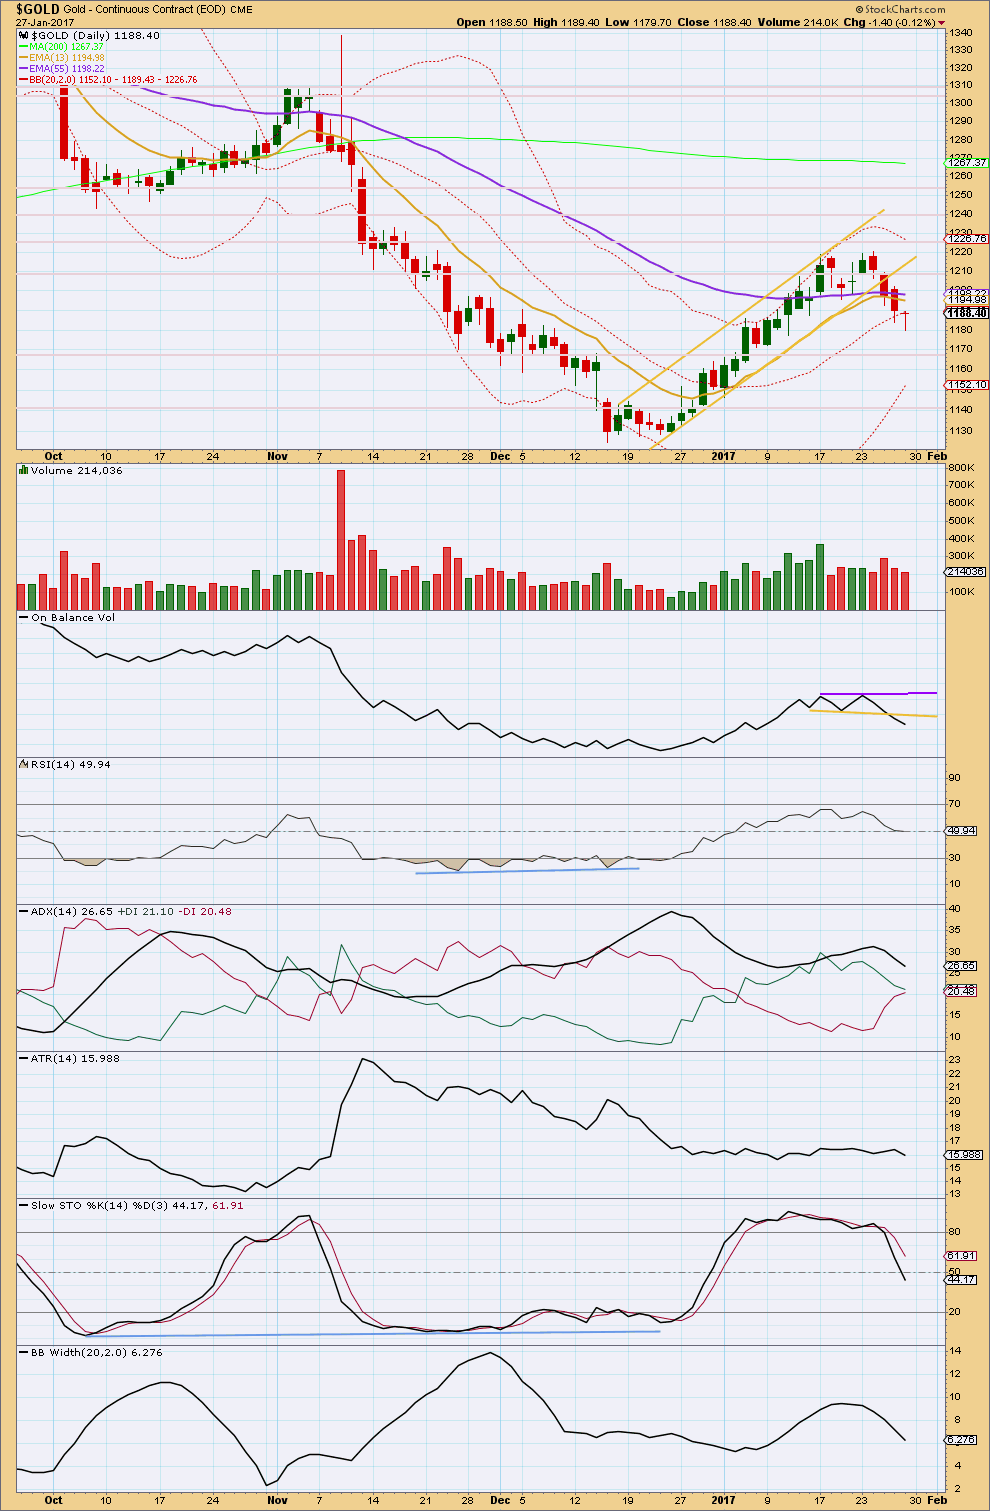
This week completes a bearish engulfing candlestick pattern. This is the most reliable reversal pattern. It is supported by an increase in volume from the prior week. Price has found strong resistance about 1,220.
On Balance Volume gives a weak bearish signal this week with a break below the yellow line. The signal is weak because the line has been broken before.
At the weekly chart level, ADX indicates no clear trend.
DAILY CHART
Click chart to enlarge. Chart courtesy of StockCharts.com.
Price has moved lower now for three days in a row and each day has seen a decline in volume. Now the third day completes a small Dragonfly doji candlestick, and coming after a decline this is a reversal pattern. It would be reasonable to expect Monday and maybe also Tuesday to see a bounce up from here, which is in line with expectations for the Elliott wave count.
Trend lines on On Balance Volume are adjusted. The break below the yellow line is a weak bearish signal. This line may now offer resistance.
RSI is neutral.
ADX is declining. The +DX line has not crossed below the -DX line, but they are converging. If they cross, that would indicate a possible trend change. At this stage, at the daily chart level, ADX indicates the market is consolidating.
ATR remains flat.
Stochastics reached overbought at highs and there exhibited divergence with price. Now it is returning from overbought. With ADX indicating a consolidation, a range bound approach to this market would expect a continuation of downwards movement overall from here (which may be choppy and overlapping) to end only when price finds support and Stochastics reaches oversold. Next support is about 1,170 and thereafter about 1,140.
GDX DAILY CHART
Click chart to enlarge. Chart courtesy of StockCharts.com.
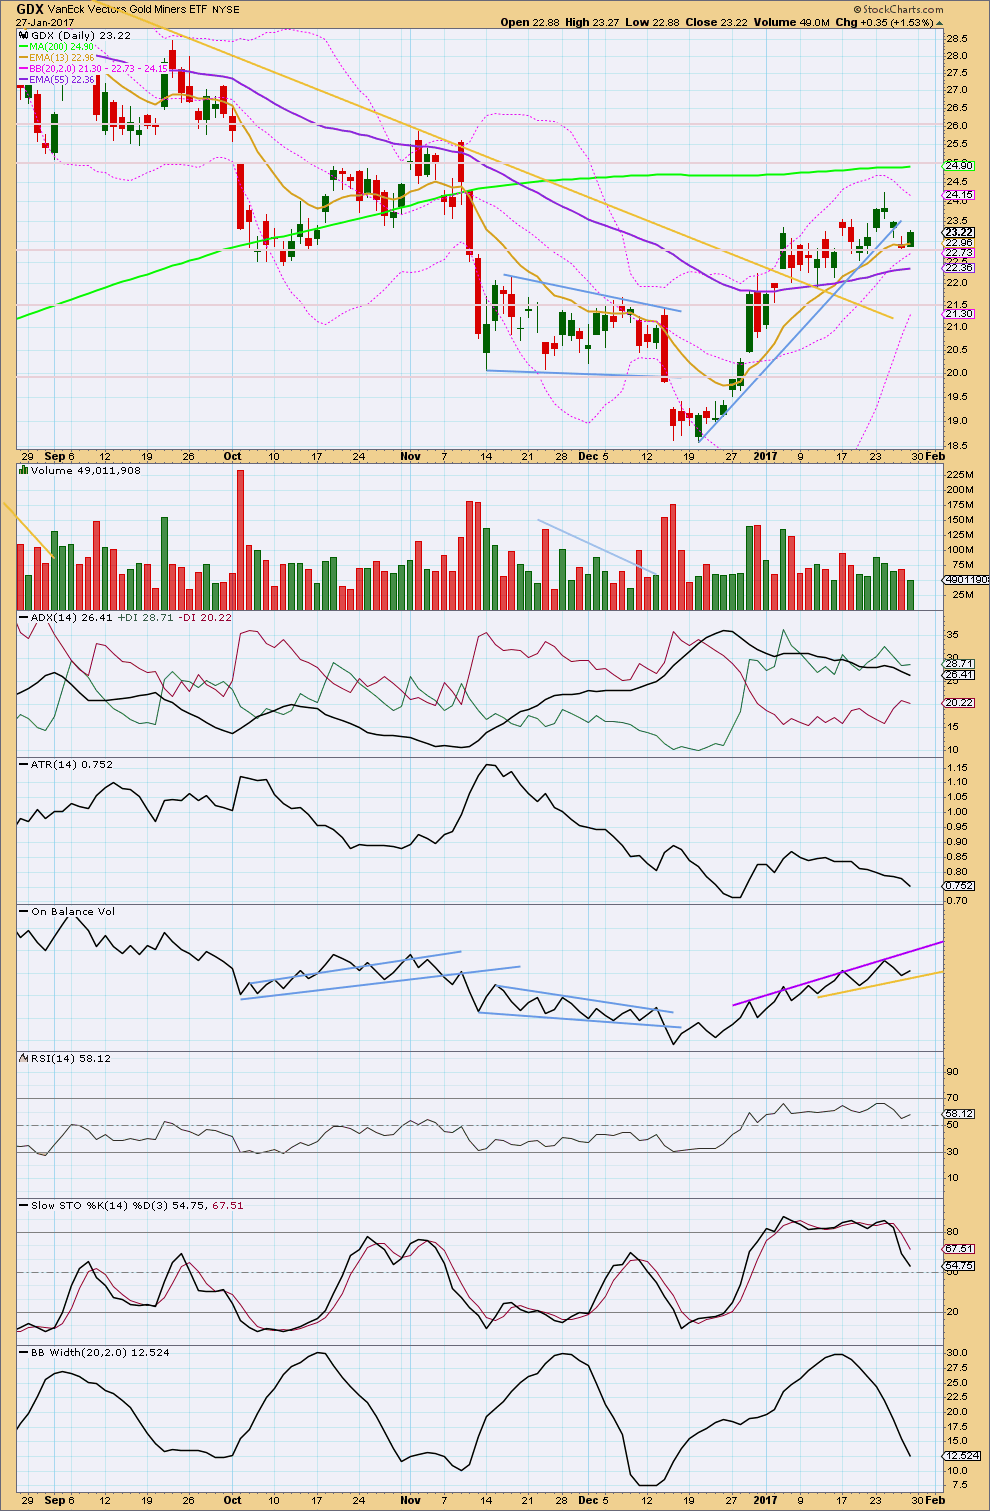
GDX has bounced up from support about 22.80. There is reasonable resistance about 23.55. Upwards movement for Friday’s session comes with a decline in volume, so it is suspicious.
ADX is declining, indicating a consolidating market. Resistance is about 23.55 to 24.20. Support is about 22.00. A range bound approach to this market would expect a downwards swing overall to continue to support and only to end when Stochastics reaches oversold.
As price moves essentially sideways in choppy overlapping movement, Bollinger Bands are contracting, typical of a consolidation.
This analysis is published @ 09:26 p.m. EST.
Interesting… GLDW
This NEW gold fund looks to hedge against a strong dollar
http://www.cnbc.com/2017/01/30/strong-dollar-can-bite-investors-looking-to-gold-as-a-safe-haven.html
The SPDR Long Dollar Gold Trust ETF gains when gold priced in U.S. dollars rises or when the value of the U.S. dollar increases. It takes a long position on physical gold in U.S. dollars and shorts a group of major global currencies that include the euro, Japanese yen, British pound sterling, Canadian dollar, Swedish krona and Swiss franc.
Lara, there does not look enough room below for this to be just minute II. Would not a simple ABC be appropriate and we could have just finished wave B?
In terms of depth, yes that looks right.
But in terms of duration this would be far too early to label minor A and now B complete.
I have some reasonable confidence today on my wave count for the S&P which expects it is going to go overall down this week. If that’s correct, then Gold should go up / sideways for longer.
However, when I look at the structure of minute ii it looks like a perfect zigzag. It looks complete. A bit more shallow than expected, but the subdivisions all fit perfectly and the proportion is about right with minute wave i.
I’d like to label minute ii complete. Gold should be starting a third wave down.
However, if my count for the S&P is right then this one here for Gold short term is wrong, minute ii may continue further as a double zigzag, double combination or flat correction. Hence my labelling of this zigzag as either minute ii or minuette (a) or minuette (w).
A breach of the channel would not confirm it’s over. That could be minuette (b) or (x). Only a five down would confirm it’s over. Which is most unfortunate.
I do hope to have more clarity when this session is over and I have data for it and for the S&P500. They are inversely correlated at this time, so I’ll assume that correlation persists until it doesn’t.
Some correlations are indeed breaking down. Cable seems to be marching to the tune of a different drummer for example, when compared to other currencies. We could be seeing some short term divergences from the norm as all markets align for a final crescendo high in Prechter’s “All the Same Market” scenario.
Does anyone here still see Gold hitting the 1205 range today/tomorrow to complete an a-b-c or has the wave count changed? Gold is all over the place this morning since a minute before the US markets opened.
http://thestockmarketwatch.com/metal/gold-price.aspx
Upward momentum for this correction waning. SLV hinting it may be done. Again it
is being rejected at the 16.32 pivot. A red print today I think would signal the end of minute two. One of my credit cards compromised for the second time in a month so gotta go do some salvage operations. 🙁
It was an imperfect ED in the Euro, but it does look as if that is what occurred. If that is correct, we should take out 1.0339 in the next few days. I am taking Lara’s caveat about the possible depth of this second wave very seriously as I suspect the price will follow the Euro to the downside. Ike Iossif is also stressing the importance of the 1160 price target and while Lara has mentioned the possibility of as high as a 90% retrace, Ike thinks if 1160 does not hold we are going to take out December’s 1123 low. I don’t think so but I do think it could go a lot lower than 1160. I will be rolling my FXE puts at the open, buying back remaining JDST short calls,and adding to my long JDST position
Silver 4 hour chart has long HnS developed since Nov 15 2016 YTD.
If silver breaks above 17.28-17.30 a rapid upward movement to 18 to 18.5.
That fits with Lara’s wave count on hourly chart.
Silver has very strong resistance at 17.28 to 17.30.
One hour time period HnS still in play.
“Surprises are in the direction of major trend.”
A weekend read. Interesting post.
https://surfcity.co/2017/01/28/weekend-reading-on-what-and-why/
The following article gives an overview of the long-term and medium-term EW counts for gold, US stock market and oil. These are largely in line with Lara’s counts.
http://seekingalpha.com/article/4040369-elroys-elliott-wave-weekly
Lots of folk conconfidently proclaiming the end and brevity of Gold’s correction. Anyone else noticing how many analysts haver labelled the second wave as already over? Meanwhile, Lara astutely points out the weekly bearish engulfing candlestick. Any thoughts?
Hi Verne..
Had to punch out to go to work yesterday afternoon, but managed to put in a sell for that JNUG I’d bought before I had left and it sold 3 cents shy of the high, but after seeing Lara’s analysis, perhaps I should have held it into Monday. Either way, all’s good.
As for the the 2nd wave..i’m thinking a small (a-b-c?)up correction to last like Lara says thru Monday or Tuesday topping around 1205, then a resumption of 2nd wave down. That appears reasonable.
The Fed meets this week. A speech is not scheduled, so very unlikely that rates will change this time, but they will release meeting text on Wednesday and that usually causes the markets some short term indigestion. ( = volatility )
Unlike gold, GDX has been correcting since Jan 5 as the high since then can’t be seen as an impulse or ending diagonal. The correction is either an expanded flat or a combination. As soon as a new low below 21.91 is made, we will need to be looking for a bottom in miners. It could come as soon as later this week.
I think Gold’s correction could end faster than Lara anticipates. When the Gold countertrend move up is over, we’ll need to watch the next leg down. Gold could also be a buy later this week near 1,160.
Dreamer I think your caveat is warranted. I am planning for a conservative initial target at 1160. Here is the tricky thing, and I know the many savvy traders on this forum are well aware of this. Even when you are right about the targets, the way the banksters still manage to trip traders, especially in US markets, is by driving wave completion after market hours. We saw a classic example of this tactic at the end of minute one down.
If intermediate two ends at the 0.618 retrace around 1160, expect the exact same stunt. Price will probably remain above 1160 intraday then hit the target and reverse sharply higher after hours in either a minor B to the upside, or a monster third wave up. How do I plan to avoid the trap?
Once again, even though it is going to feel like you are early, any intraday move below 1170 might be a good time to anticipate at least a pause, and possibly a manic after hours reversal. I will be exiting all positions with any move below 1170 and awaiting further instructions. Beat the banksters! 😀
It is kind of strange how the miners sometimes seem to move independently from the metals. They hit their last high almost a month after the metals did.
It would be interesting to look at the wave count of the miners and see if that new 52 week high they made a month after the metals on August 11 last year was also the B wave of an expanded flat…
Verne, here’s the daily count for GDX. The high last August was a wave 5 high, but there were two expanded flats that show up clearly on the daily chart. One was in March and another in June, so they are fairly common.
When GDX makes a low below 21.90, the bottom could be in. So at that time I will be looking at the structure of GDX and also looking at Gold to see if it is close enough to a bottom that it could bottom overnight. Like you said, it can be tricky, but GDX should make it’s low below 21.90 during normal trading hours.
The only reason that GDX might now go that low is if the correction turns into a combination and not an expanded flat. Time will tell. Patience for now.
Thanks Dreamer. Great charting…as usual!