
Gold has had a trend change. How high this next wave goes and what structure it takes will indicate which Elliott wave count at the monthly chart level may be correct.
Summary: Gold is in a new bull trend. In the short term, a downwards correction should be expected to have begun either today, or very soon, and this will offer an opportunity to join the trend when it completes. The correction may be very deep; the 0.618 Fibonacci ratio at 1,147 is the first expectation, but it may be deeper than this.
New updates to this analysis are in bold.
Grand SuperCycle analysis is here.
MAIN ELLIOTT WAVE COUNT
MONTHLY CHART
Click chart to enlarge.
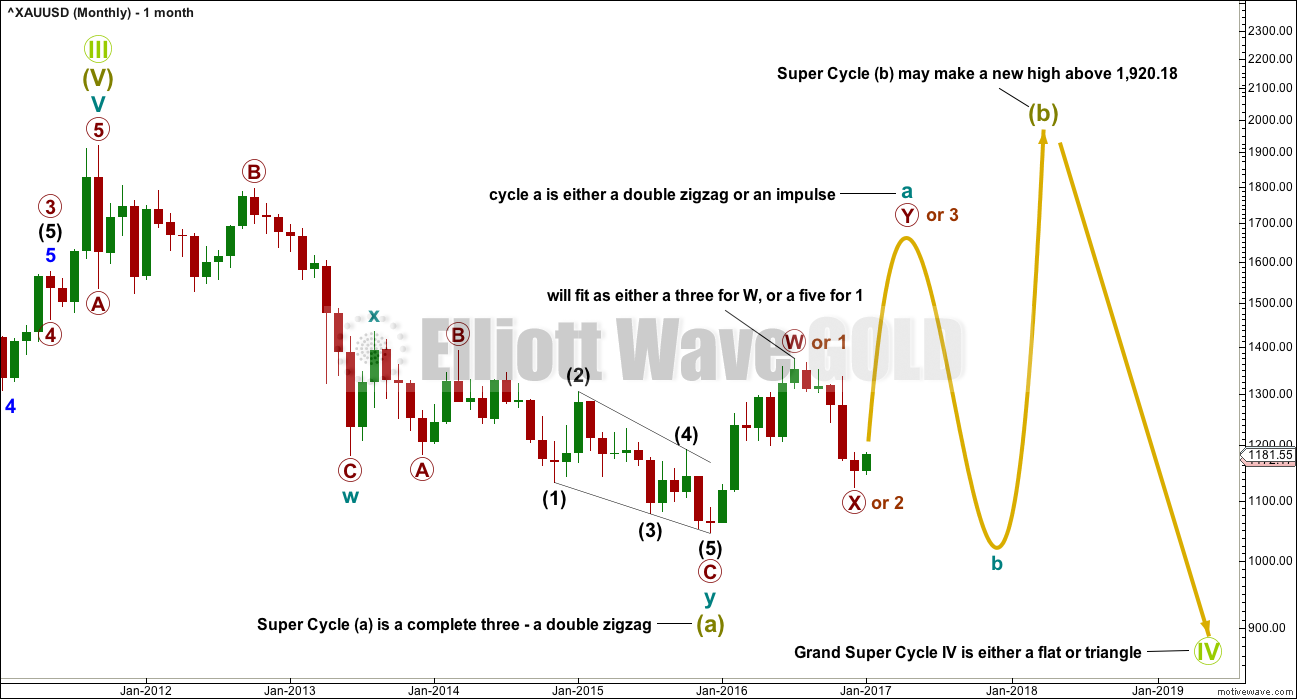
The larger picture for both this main and the alternate wave counts below see Gold within a Grand Super Cycle wave IV.
This main wave count has a higher probability because it has a better fit.
The large wave down from September 2011 to December 2014 fits best as a completed double zigzag.
When the first movement within a larger correction subdivides as a multiple, then a combination may be eliminated. The maximum number of corrective structures within a multiple is three. Super Cycle wave (a) may not be relabelled Super Cycle wave (w) subdividing as a double zigzag because that would increase the number of corrective structures beyond three and violate the rule.
Because Super Cycle wave (a) is a three, either a flat or triangle is indicated for Grand Super Cycle wave IV. Within both flats and triangles, Super Cycle wave (b) may make a new price extreme beyond the start of Super Cycle wave (a).
Super Cycle wave (b) may be any one of more than 23 possible corrective structures. None can be eliminated at this stage.
The upwards wave from the low of December 2015 to the high of July 2016 will subdivide as either a three or a five. Both are detailed below on weekly charts.
Cycle wave a may be subdividing as either an impulse or a double zigzag.
FIRST WEEKLY CHART
Click chart to enlarge.
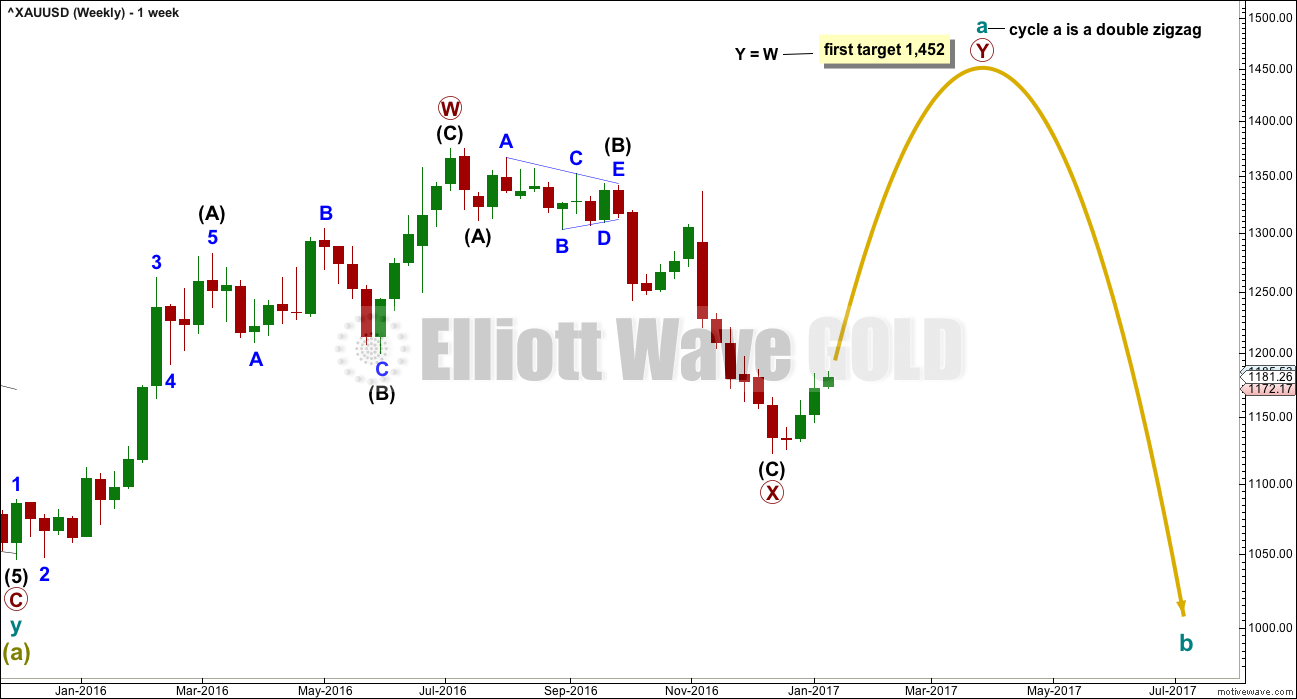
The upwards wave labelled primary wave W looks best as a three. Cycle wave a may be unfolding as a double zigzag.
Within the double zigzag, primary wave X may now be a complete three. This downwards movement fits neatly as a single zigzag.
Primary wave W lasted 31 weeks, so primary wave Y may be expected to last about a Fibonacci 34 weeks.
SECOND WEEKLY CHART
Click chart to enlarge.
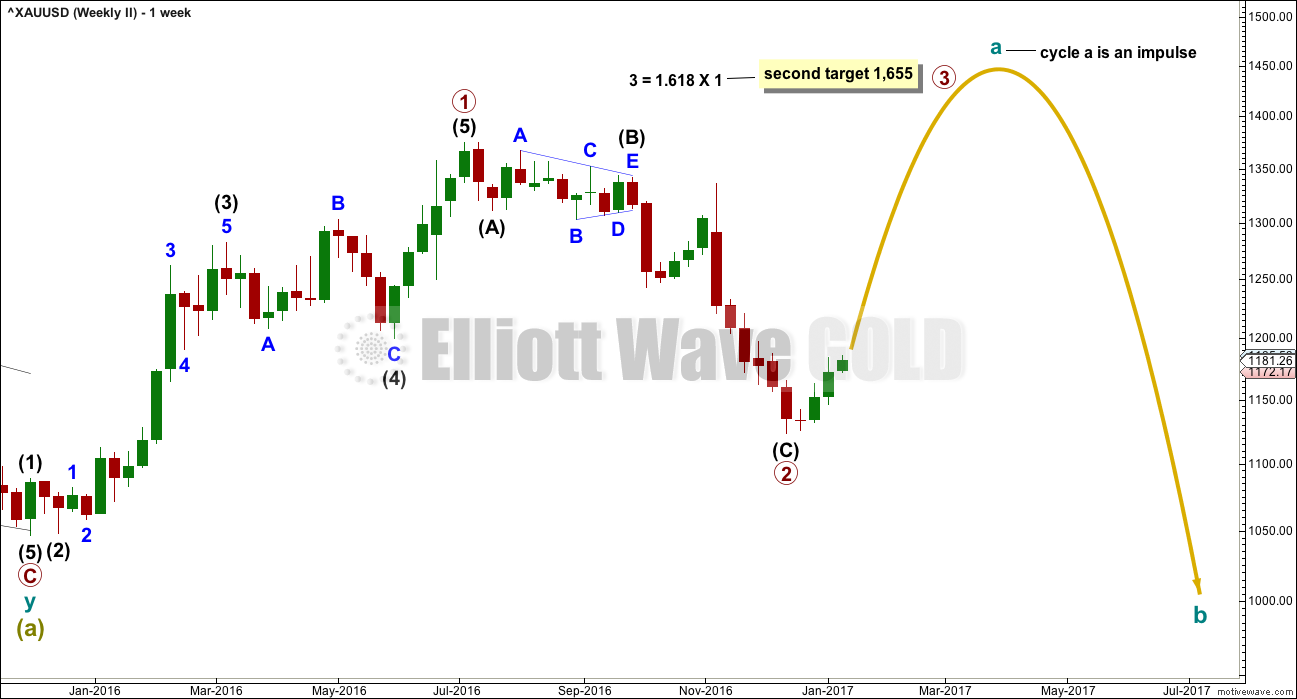
The upwards wave labelled primary wave 1 will subdivide as a completed five wave impulse.
The downwards wave labelled primary wave 2 is seen in exactly the same way for both main weekly charts, as a single zigzag. This should now be complete.
This weekly chart expects to see an increase in upwards momentum as a third wave unfolds.
Primary wave 1 lasted 31 weeks, primary wave 2 lasted 23 weeks, and primary wave 3 may be expected to last about a Fibonacci 55 weeks.
DAILY CHART
Click chart to enlarge.
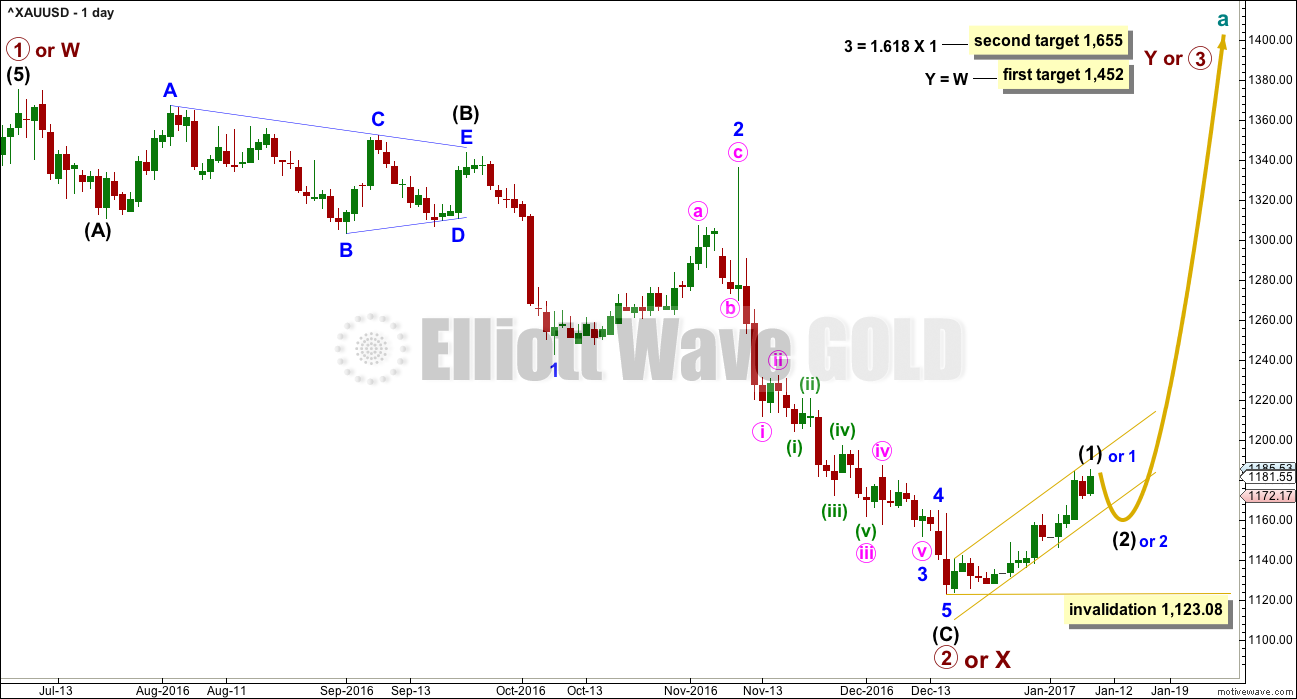
This daily chart will cover both the weekly charts above.
All detail of primary wave 2 or X will be shown today. As of tomorrow less detail will be shown.
If the downwards wave for primary wave 2 or X is seen as a zigzag, then a triangle can be seen in the position of intermediate wave (B). This has a very good fit, and was supported by MACD hovering about zero as the triangle completed.
Within intermediate wave (C), there is disproportion between the corrections of minor waves 2 and 4. However, to see Gold’s fourth waves more brief than counterpart second waves is common, so this is acceptable.
HOURLY CHART
Click chart to enlarge.
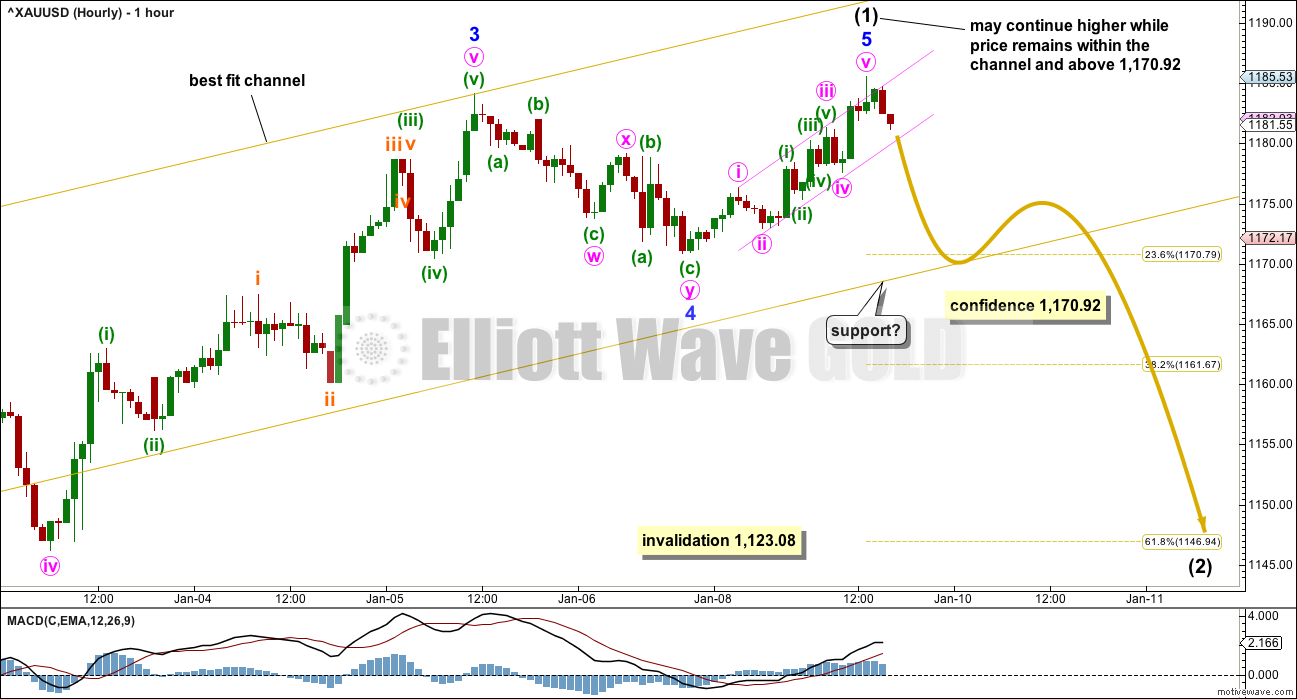
Upwards movement from the low on 15th of December will subdivide as a completed five wave impulse. This may be intermediate wave (1) as labelled, or the degree may be moved down one and it may only be minor wave 1 (as noted on the daily chart).
The gold channel is a best fit, drawn as shown on the daily chart.
A new low below the start of minor wave 5 at 1,170.92 could not be a second wave correction within minor wave 5, so at that stage the fifth wave would have to be over. This would provide confidence in a trend change.
If downwards movement is a second wave correction, then the most likely point for it to end would be the 0.618 Fibonacci ratio.
ALTERNATE ELLIOTT WAVE COUNT
MONTHLY CHART
Click chart to enlarge.
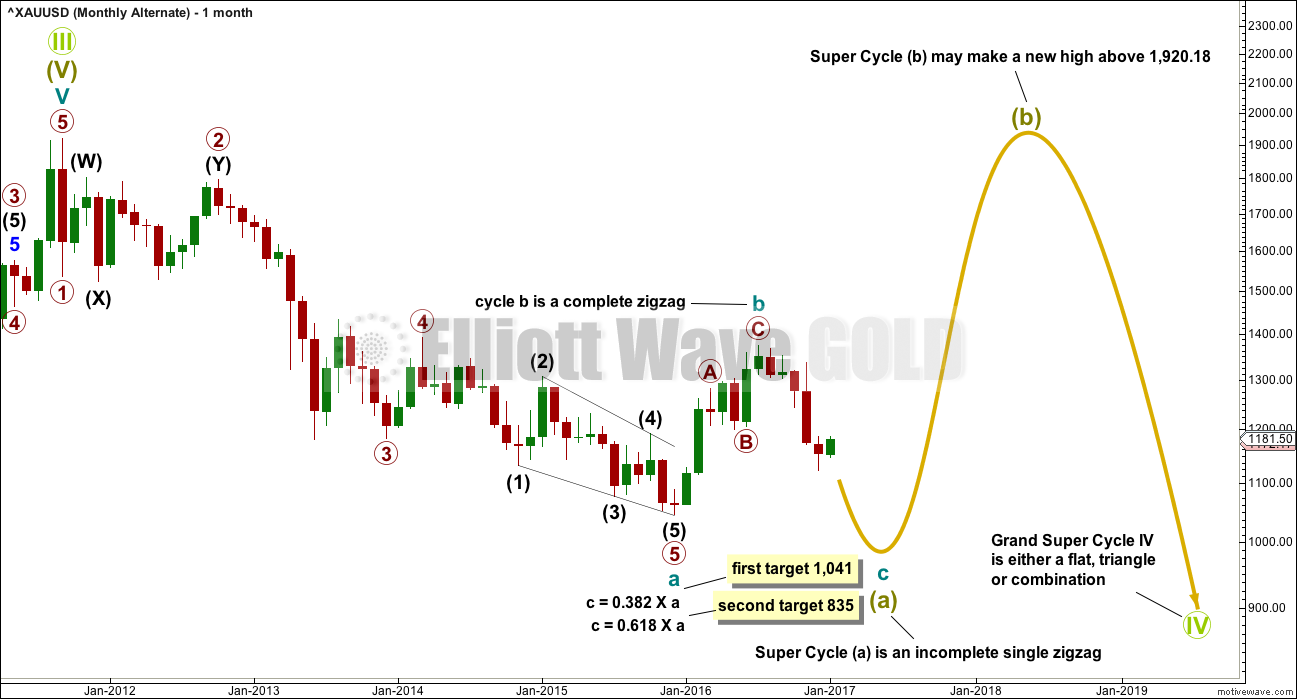
This alternate wave count sees Grand Super Cycle wave IV as either a flat, combination or triangle. The first wave down within it labelled Super Cycle wave (a) is subdividing as a zigzag.
This alternate wave count sees the big downwards wave from September 2011 to December 2015 as a completed five wave impulse for cycle wave a. Cycle wave b may now be a completed zigzag, correcting to 0.376 the depth of cycle wave a (very close to a Fibonacci 0.382).
If Super Cycle wave (a) has begun with a five wave structure down, then it may only be a zigzag.
Cycle wave c must subdivide as a five wave structure, either an ending diagonal or an impulse. It is very likely to make at least a slight new low below the end of cycle wave a at 1,046.27 to avoid a truncation.
WEEKLY CHART
Click chart to enlarge.
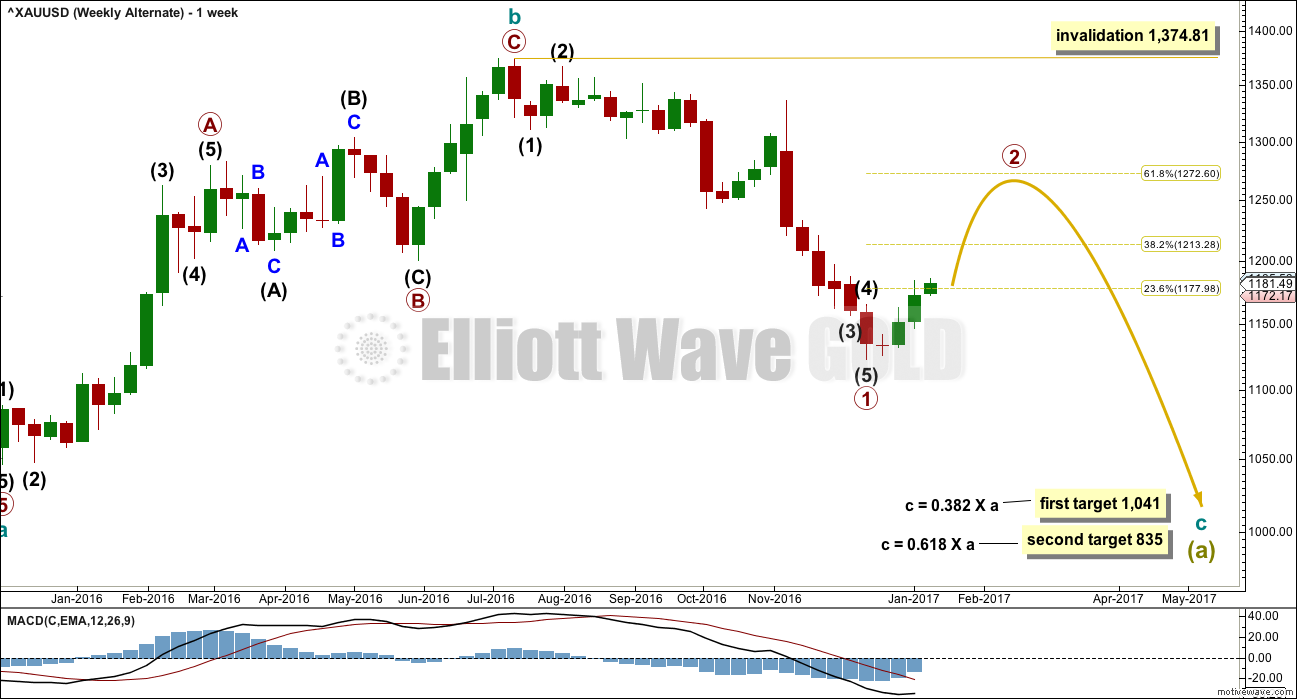
Cycle wave b is a complete zigzag. This upwards wave looks best and fits best as a three.
Within cycle wave c, a first wave down for primary wave 1 would now be complete.
Primary wave 2 is most likely to correct to the 0.618 Fibonacci ratio at 1,272.60.
Primary wave 1 lasted 22 weeks, one longer than a Fibonacci 21. Primary wave 2 may be expected to last about a Fibonacci 21 or 34 weeks in total. It should be a big three wave structure.
Primary wave 2 may not move beyond the start of primary wave 1 above 1,374.81.
DAILY CHART
Click chart to enlarge.
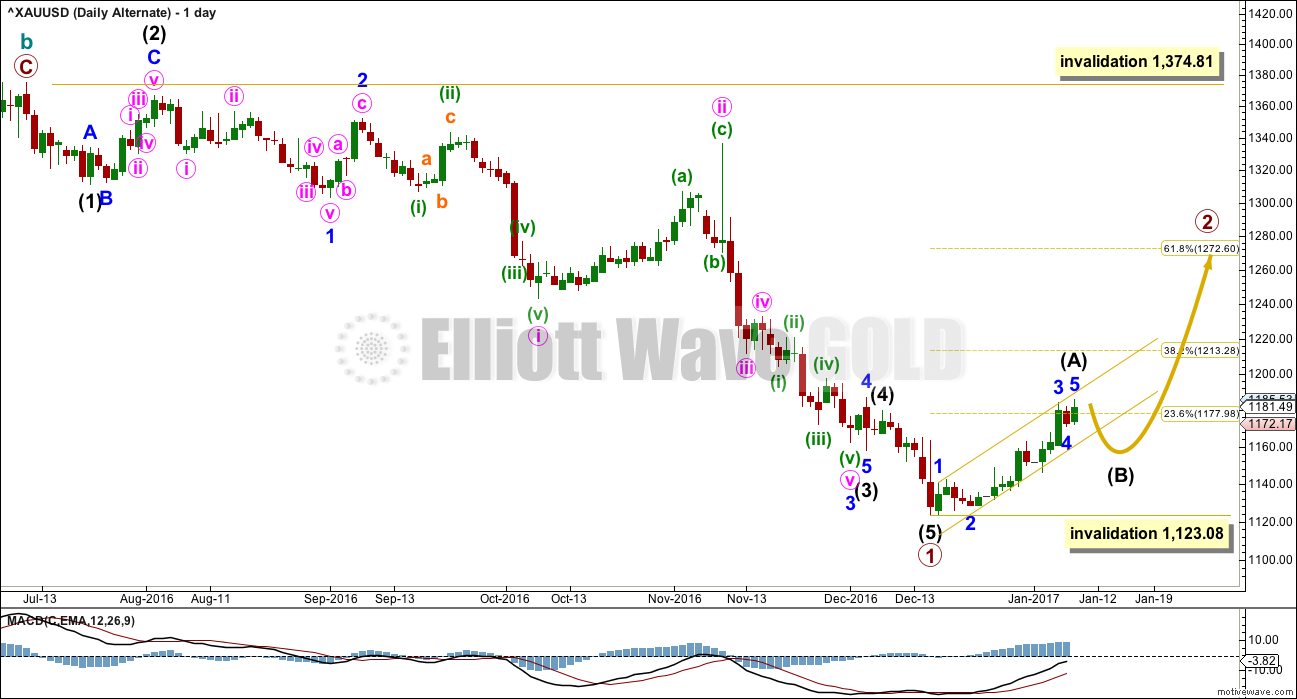
Primary wave 2 is most likely to subdivide as a zigzag. So far it looks like a five up is either complete now or very close to completion. This may be intermediate wave (A).
It is also possible to move the degree of labelling all down one degree within upwards movement for intermediate wave (A). It is possible that only minor wave 1 within intermediate wave (A) is complete. Either way the invalidation point remains the same. If a five up is complete, then the following three down may not move beyond its start below 1,123.08.
Primary wave 2 may not move beyond the start of primary wave 1 above 1,374.81.
This alternate wave count suffers from a problem of disproportion. Minute wave ii is much longer in duration at 23 days than minor wave 2 at 4 days and intermediate wave (2) at 8 days. Minute wave ii is a lower degree correction and should not be substantially longer in duration than corrections of higher degrees. This reduces the probability of this wave count.
This wave count must also ignore what fits neatly as a triangle (see main daily chart). This also must reduce the probability of this wave count.
For these reasons it is an alternate.
TECHNICAL ANALYSIS
WEEKLY CHART
Click chart to enlarge. Chart courtesy of StockCharts.com.
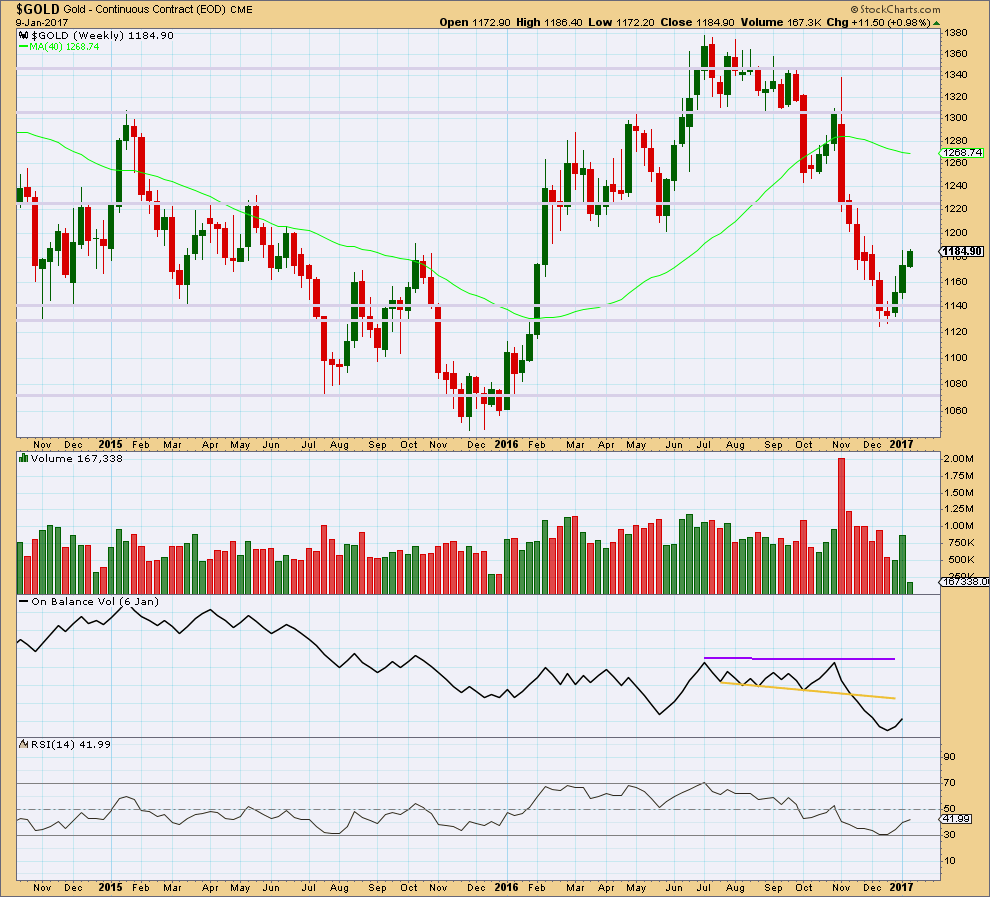
The fall in price to the last low was not supported by volume, so it should be suspicious.
The rise in price for the first two weeks has good support from volume (volume increased during the second week). The current week is incomplete, so no conclusion may be drawn at this stage for this week.
Price has found strong support about prior lines of support and resistance, about 1,140 and 1,130.
RSI almost reached oversold at the last low.
There is a Morning Star candlestick pattern at the low. At the weekly chart level, this is a reasonable reversal signal.
It would be reasonable to conclude that Gold has seen a trend change.
DAILY CHART
Click chart to enlarge. Chart courtesy of StockCharts.com.
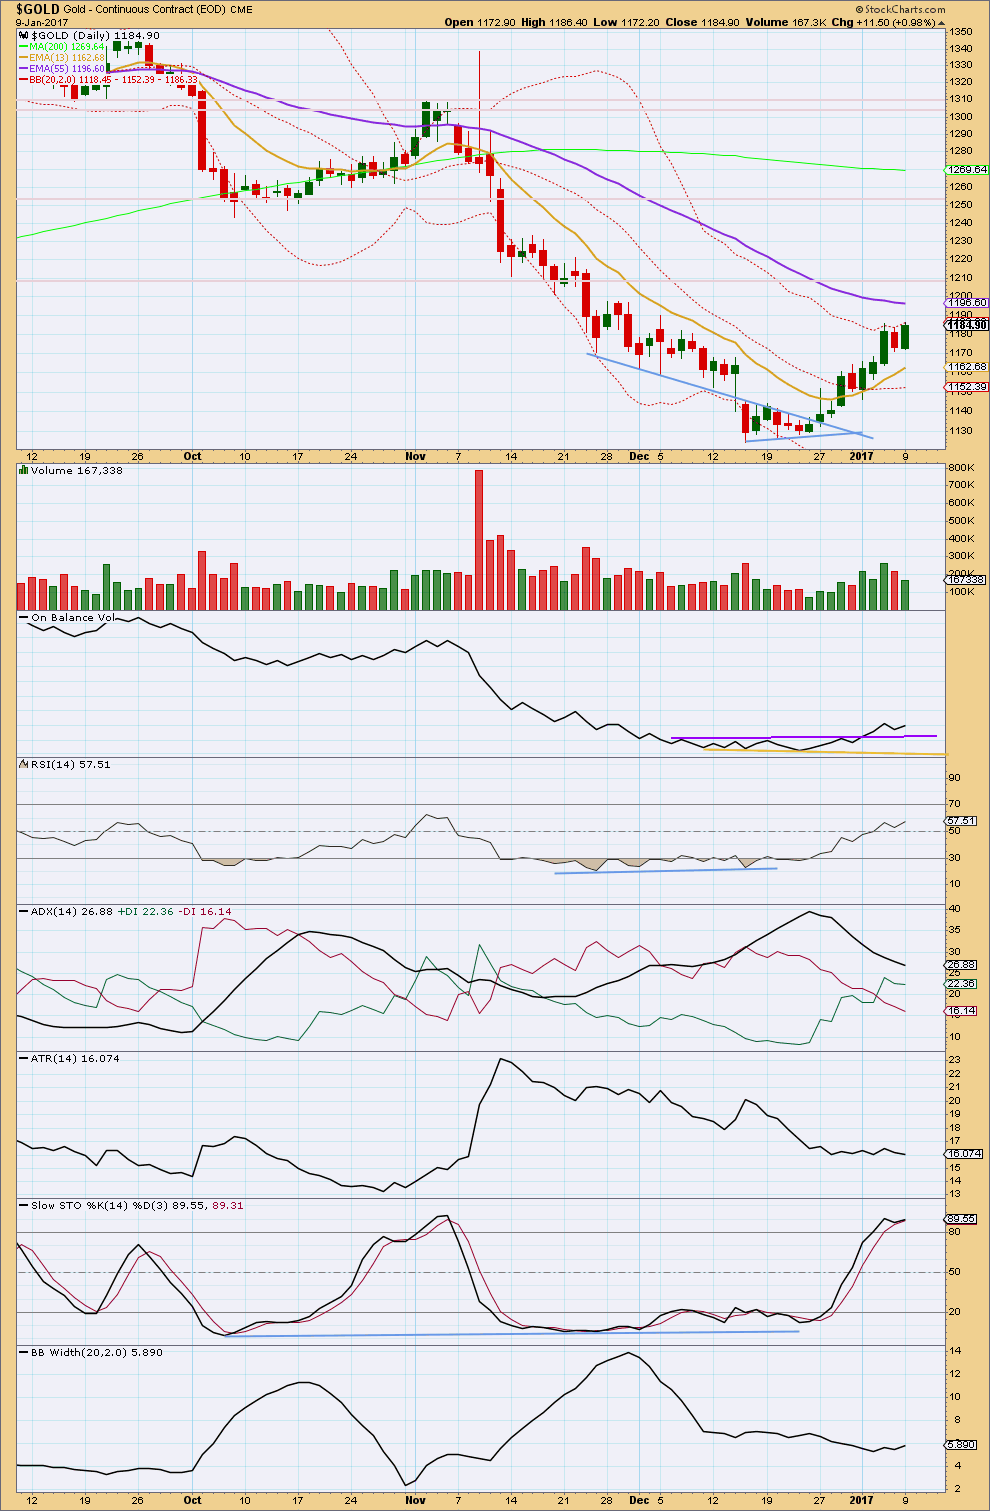
The small pennant pattern noted in last analysis failed. While these are one of the most reliable continuation patterns, that does not mean they always work. Nothing in technical analysis is certain; all is an exercise in probability.
Price comes with increasing volume overall while it has been rising off the last low. Today may show lighter volume, which may be an indication of tiredness for bulls. But this alone is not a signal for a trend change here.
Price has moved above the short term Fibonacci 13 day moving average and this may now provide some support. The short term average is pointing up.
The mid term average is still pointing downwards as is the longer term average. It is too early yet to be confident of a trend change from down to up because the longer term trend is still indicated as down. By their nature moving averages are lagging indicators.
On Balance Volume is bullish with a break above the purple resistance line. This line then provided support for a back test, which is another bullish signal. OBV is often a leading indicator.
There is some concern over ADX remaining extreme and the black ADX line above both +DX and -DX lines. But the +DX line has crossed above the -DX line and this indicates a potential trend change from down to up. No clear trend is yet indicated with the ADX line still declining. ADX is a lagging indicator also as it is based upon averages.
ATR is flat while price moves higher. This upwards movement lacks range. This is common for the early stage of a new trend, but it is also common for corrective movements.
Stochastics is overbought and price is at the upper edge of Bollinger Bands. Some downwards reaction either here or very soon is a reasonable expectation at this time, and this fits with the Elliott wave count short term.
GDX DAILY CHART
Click chart to enlarge. Chart courtesy of StockCharts.com.
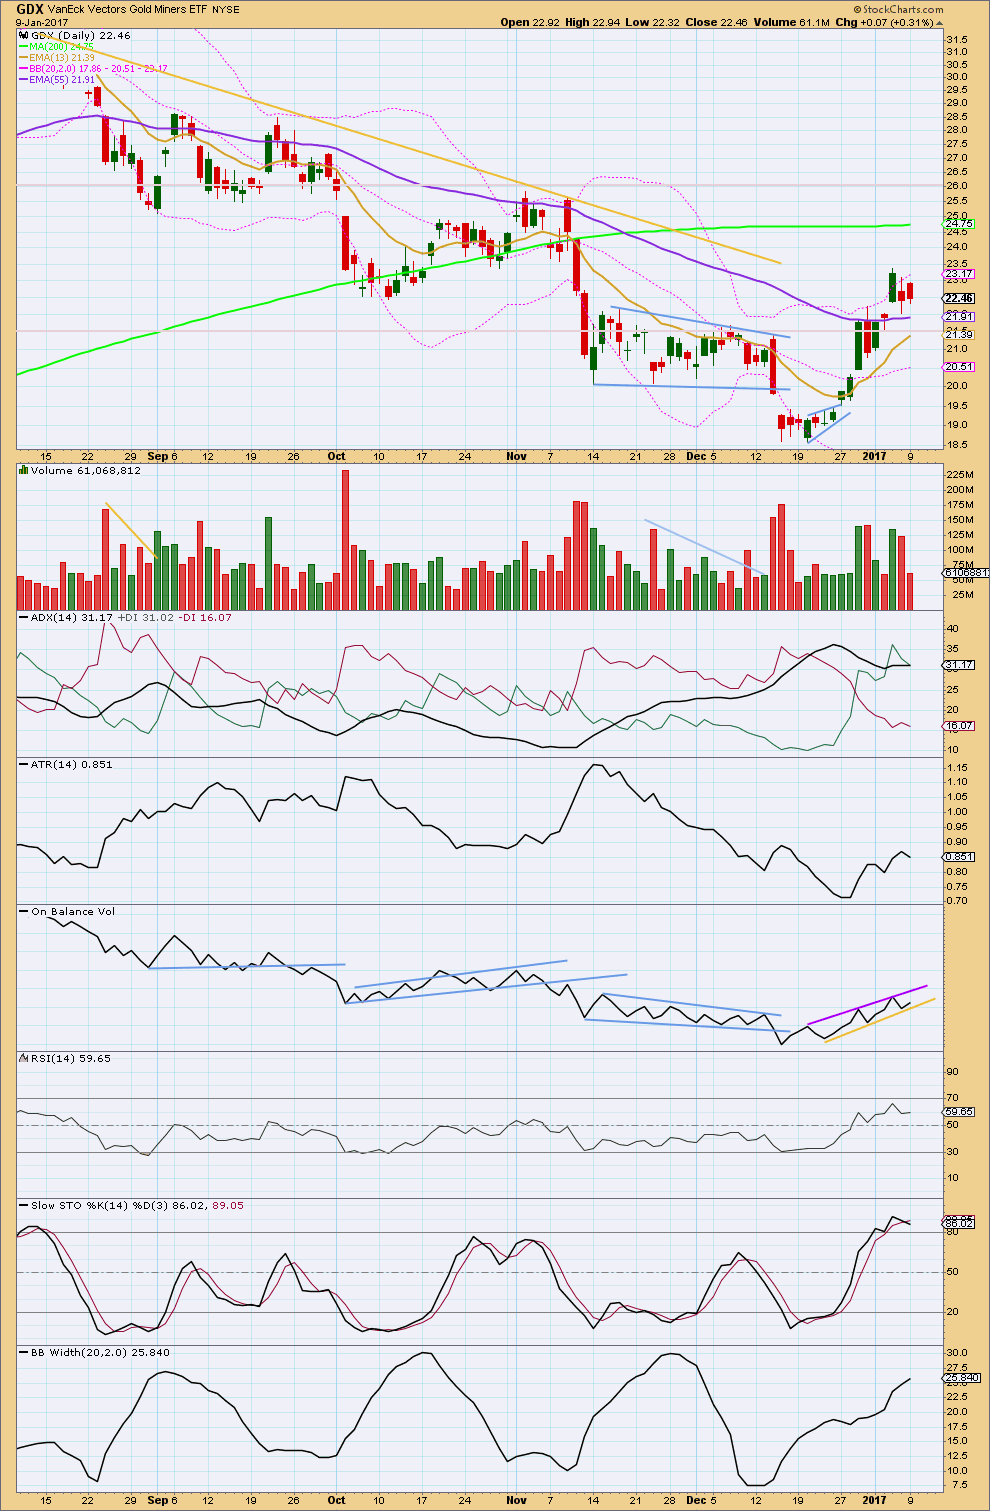
What looked like a small pennant pattern on GDX also failed after last analysis.
The trend for GDX looks clearer today than for Gold. For GDX all three moving averages are increasing, so an upwards trend is indicated. However, the short term Fibonacci 13 day average is still below the mid term Fibonacci 55 day average, which is below the long term 200 day average. If GDX is in a new trend, it is very early.
ADX, which is close to but not yet extreme, also indicates an upwards trend for GDX.
Volume has seen some increase while price rises. The last downwards day sees much lighter volume and looks like a small correction within an upwards trend.
ATR is increasing while price rises. The trend looks healthy.
RSI is bullish and is not yet extreme.
Stochastics is overbought and price is at the upper edge of Bollinger Bands. Some downwards reaction about here or very soon is a reasonable expectation before the trend continues.
On Balance Volume has new trend lines. A break above or below may indicate the next direction for price.
This analysis is published @ 06:21 p.m. EST.
Thank you…Lara…I have already set them up and will study the way your suggested.
Actually, I take it back, I think we are going up to 1200 area.
Sorry Lara,
Paragraph 4: meant to say Interm 4, Not Minor 4
Also…last question: Would Gold declining in wave (2)or 2 likely give US Dollar that final push to a top in Minor 5/Interm 3 before a sizeable pullback in Interm 4?
Thanks
Hello Lara,
I hope you and your family had a restful, fun holiday! You NEED those Holidays….well earned!!
When you can, would you kindly update the US Dollar Daily/Wkly chart?
Looks like we may be coming into longer term Trend Line resistance at about 105/106 for now.
Back in Sept 2016, your wkly chart had us nearing Minor 5/Interm (3)/Prime 3.
Do you think we are about ‘there’ Or does the US Dollar have further to go before Minor 4 takes hold?
Minor 2 took about 5-6mos. to form. In what time period do you think Min 4 may form, or is it just too early to tell?
You often mention how Gold’s 2’s are usually much deeper and lengthier than Gold’s 4’s for reasons you have explained. Wondering if US Dollar has its own idiosyncrasies?
Is there logic to the concept of Gold going Up along side withe the US Dollar. Or if this takes place, it is simple not the norm and happens for relatively Short periods of time?
Please take a look as you can. I know that there is always a lot to catch up with when we all return from Holiday.
Thank you
While they do usually move together, they don’t always.
I’ll update my USD wave count today and publish a report.
I’ve taken a look at monthly charts of Gold and USD back to the 1980’s.
They sometimes are inversely correlated, but not always.
Print these two charts out and look at them one above the other and you’ll see what I mean. Example: from December 1987 they both moved overall down, both making new lows to September 1992.
So from past behaviour they can move together, but more often they are inversely correlated.
same time frame for Gold
Looks like we’re going down now!
Looks like SLV tracing out a fifth wave ED. Took profits on my 15.00 strike calls expiring next week I may be a bit early but if that is an ED the reversal is going to be sharp.
Another BO from period 4 hour consolidation built on the HnS in 4 hour period over the holidays.
A pull back may not happen now till gold gets up to next resistance 1200.
A powerful inverse Hns in 4 hour period still playing out.
GDX hourly update
Welcome back Lara! Thanks for all the analysis today with 2 bonus videos!
Thanks Dreamer. I bounced out of bed before 7am bright and ready to come back to work. And I had an enjoyable day doing it.
I love technical analysis 🙂
Your wave count looks really good.
I’m looking forward to entering long when this correction is done. And if I’m right, then it should be a good entry to hold for quite some time. Weeks I hope!
I like reading your analysis. I am an engineer by education as I believe you might be. Much rather be following the markets.
I’m not an engineer, but I have a BSc majoring in Biology.
My science training taught me to think logically. Which is common with engineers.
It does seem that we have a fair number of engineers here. I am a mechanical engineer. At one time, Papudi had mentioned that to me that he is one too.
I guess that’s the reason why we embrace technical analysis. Engineering had taught us to be logical and analytical. The training provided us with a keen eye for detail. We deal with facts and figures, not the stories, rumours and opinions that fundamental analysts cling on to.
I think Dreamer’s count is spot on. I am expecting a high for this move up tomorrow and would not be surprised to see upper BB penetration accompanied by a bearish engulfing candle to signal a correction starting in the metals and miners. I will look for SLV to finally fill that open gap at 15.87 as a signal to exit my long SLV and NUGT trade.