
Silver has moved higher with some support from volume. The Elliott wave counts are the same.
Summary: Silver is most likely in a new upwards trend. This would be confirmed with a new high above 17.220. The target is at 23.131. In the short term, look out for a deep second wave correction.
New updates to this analysis are in bold.
To see how this analysis fits into the bigger picture, see last monthly charts here.
MAIN WEEKLY WAVE COUNT
Click chart to enlarge.
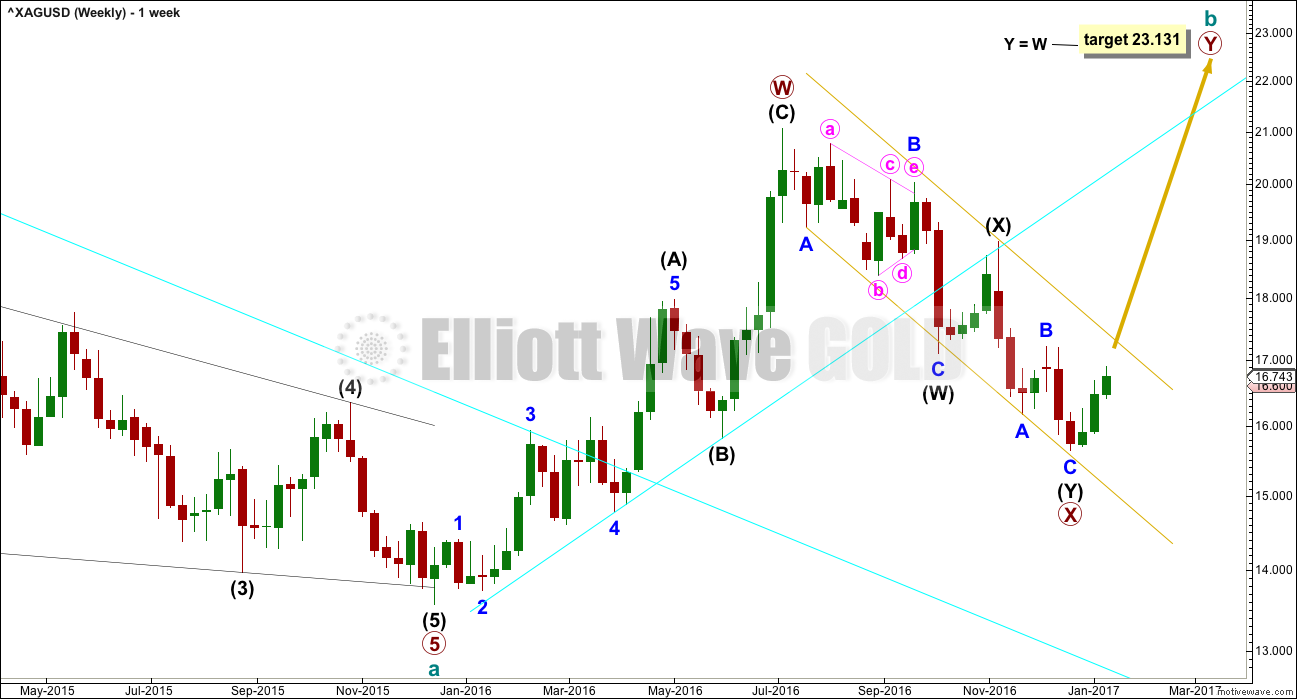
Upwards movement fits better as a completed zigzag than it will as an incomplete five, at this stage. At the daily and weekly chart level, this wave count has a better fit and better look for Silver.
Primary wave X may have continued lower as a double zigzag. This movement For Gold will now fit as a single zigzag, but for Silver it will fit only as a double zigzag.
Cycle wave b may be either a double zigzag or a double combination. If it is a double zigzag, then primary wave Y may be about equal in length with primary wave W.
If it is a double combination, then primary wave Y may be either a flat or triangle and may end about the same level as primary wave W at 19.878.
X waves within combinations are more often very deep. There is no rule stating a maximum limit for an X wave. They may make new price extremes beyond the start of the correction.
The maximum number of corrective structures within a multiple is three. This maximum applies to subwaves W, Y and Z within multiples. These may only be simple A-B-C corrections, or A-B-C-D-E in the case of triangles. To label multiples within multiples increases the maximum beyond three, violating the rule.
However, this maximum does not apply to X waves, the joining structures within multiples. X waves may be any corrective structure including occasionally multiples as in this case. This wave count is valid; the rule is not broken.
MAIN DAILY WAVE COUNT
Click chart to enlarge.
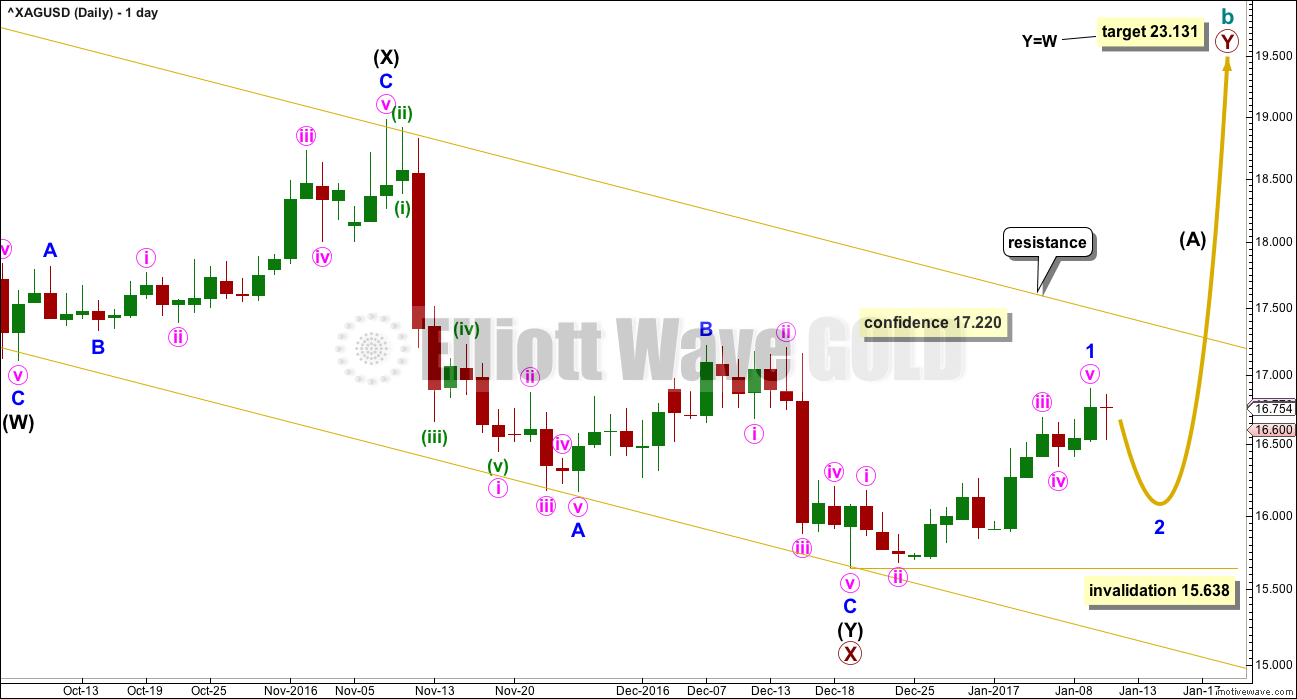
At this stage, there is still no indication of a reversal, so this wave count requires a new high above 17.220 for confidence.
Along the way up, expect price to find resistance at the upper edge of the channel.
Minor wave 2 may not move beyond the start of minor wave 1 below 15.638.
ALTERNATE WEEKLY WAVE COUNT
Click chart to enlarge.
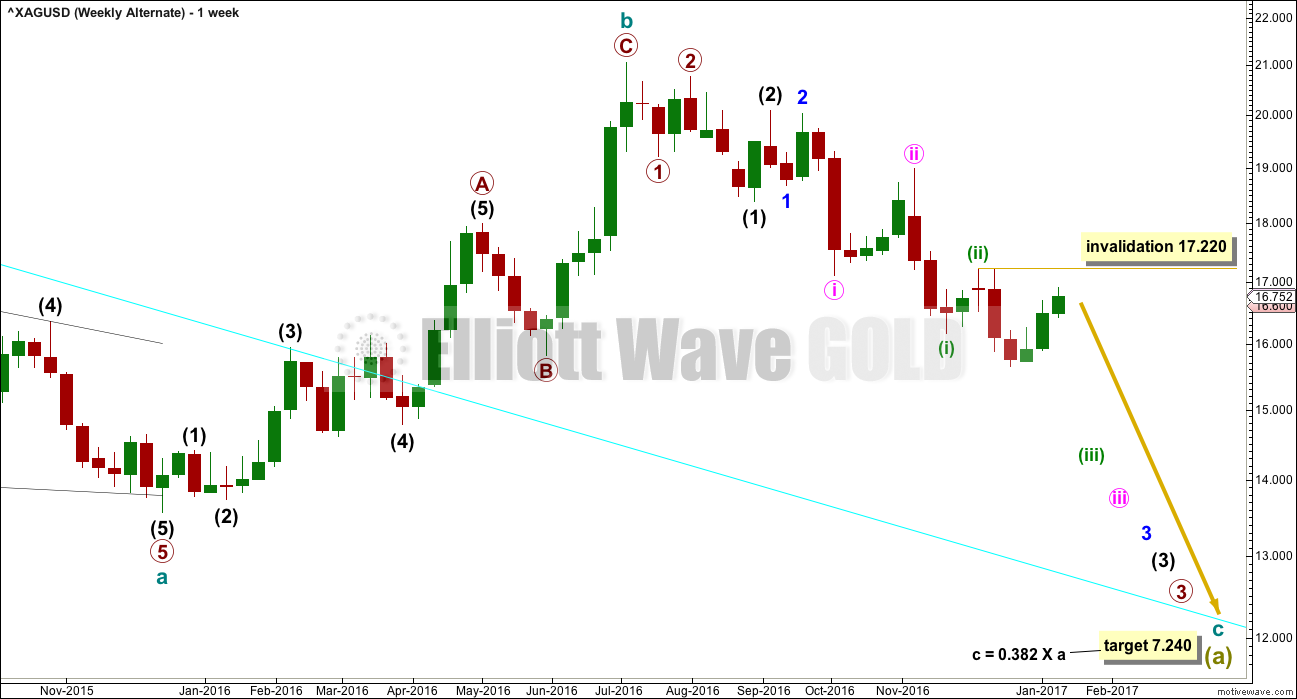
It is possible that cycle wave b is a complete zigzag and that downwards movement is the start of cycle wave c.
Within the middle of the third wave down, no second wave correction may move beyond the start of minuette wave (iii) above 17.220.
It is judged that this alternate at this stage may still be less likely. A series of overlapping first and second wave corrections ignores what looks like a triangle within this structure. Triangles may not be the sole corrective structure of a second wave.
Minute wave ii is much longer in duration than minor wave 2 and intermediate wave (2). The disproportion of this correction also reduces the probability of this wave count.
If downwards movement continues and shows an increase in strength, then this wave count should be taken seriously. It is technically possible.
ALTERNATE DAILY WAVE COUNT
Click chart to enlarge.
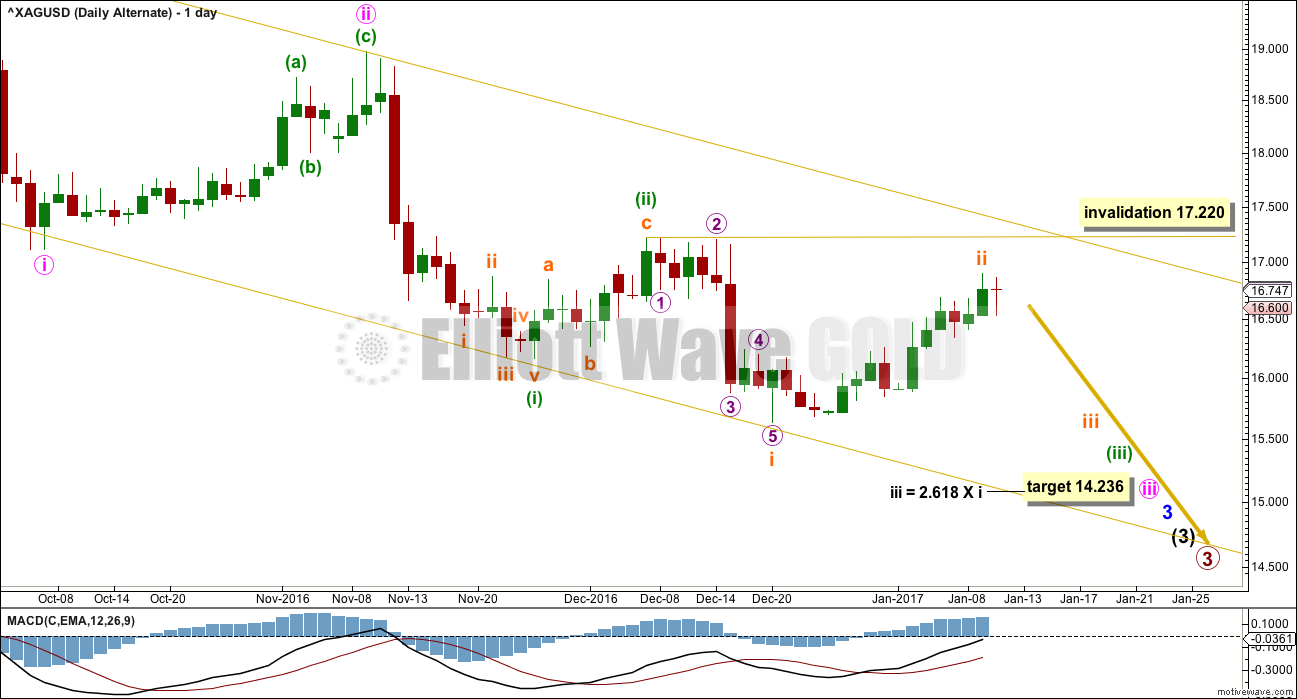
There would now be five overlapping first and second waves within a new downwards trend if this wave count is correct. A large increase in downwards momentum would be expected.
The fact that this has not happened, that price has moved much higher, substantially decreases the probability of this wave count at this stage.
Another first wave may now be complete this week for subminuette wave i. If this wave count is correct, then subminuette wave ii should be relatively brief and shallow. There should be a strong pull to the downside. This is not happening, reducing the probability of this wave count.
TECHNICAL ANALYSIS
WEEKLY CHART
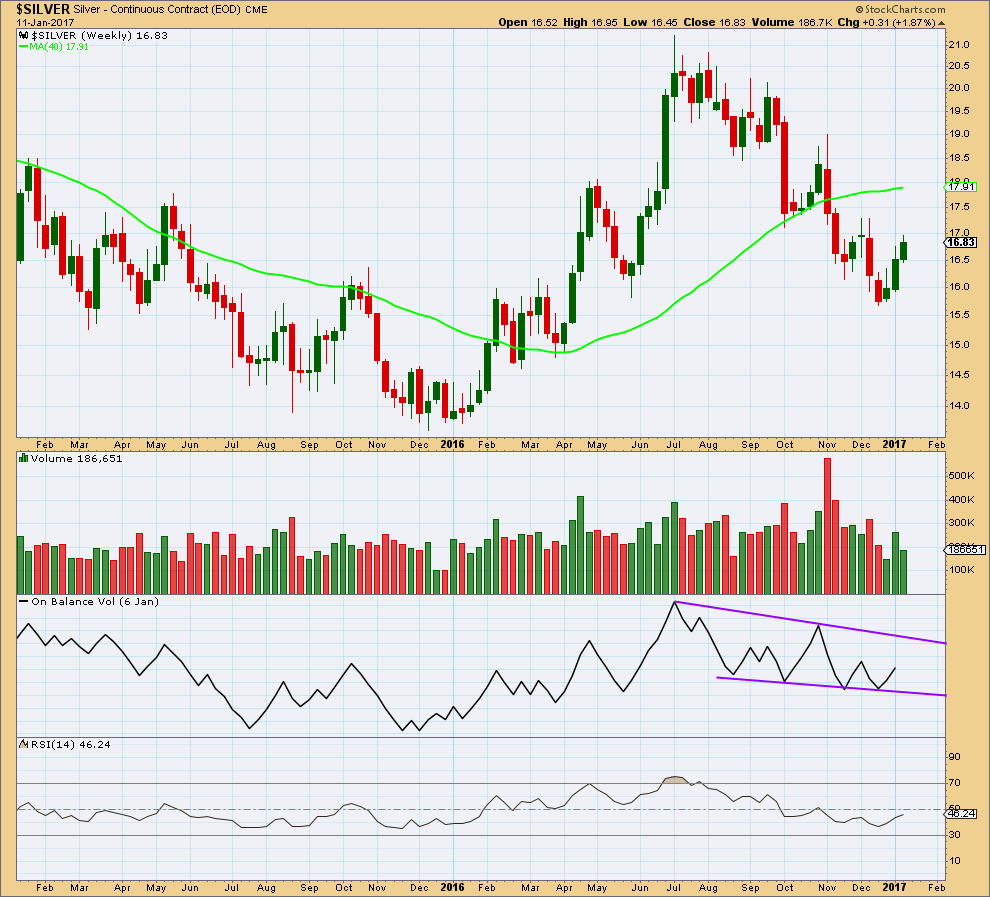
Click chart to enlarge. Chart courtesy of StockCharts.com.
Volume declined as price fell to the last low. The fall in price was not supported by volume, so it is suspicious. The market fell of its own weight.
The rise in price last week had some support from volume. No conclusion may yet be drawn for the current week as it is incomplete.
The support line for On Balance Volume is redrawn. Now this has better technical significance. A breakout by OBV may indicate a direction for price.
RSI is rising but still below 50.
DAILY CHART
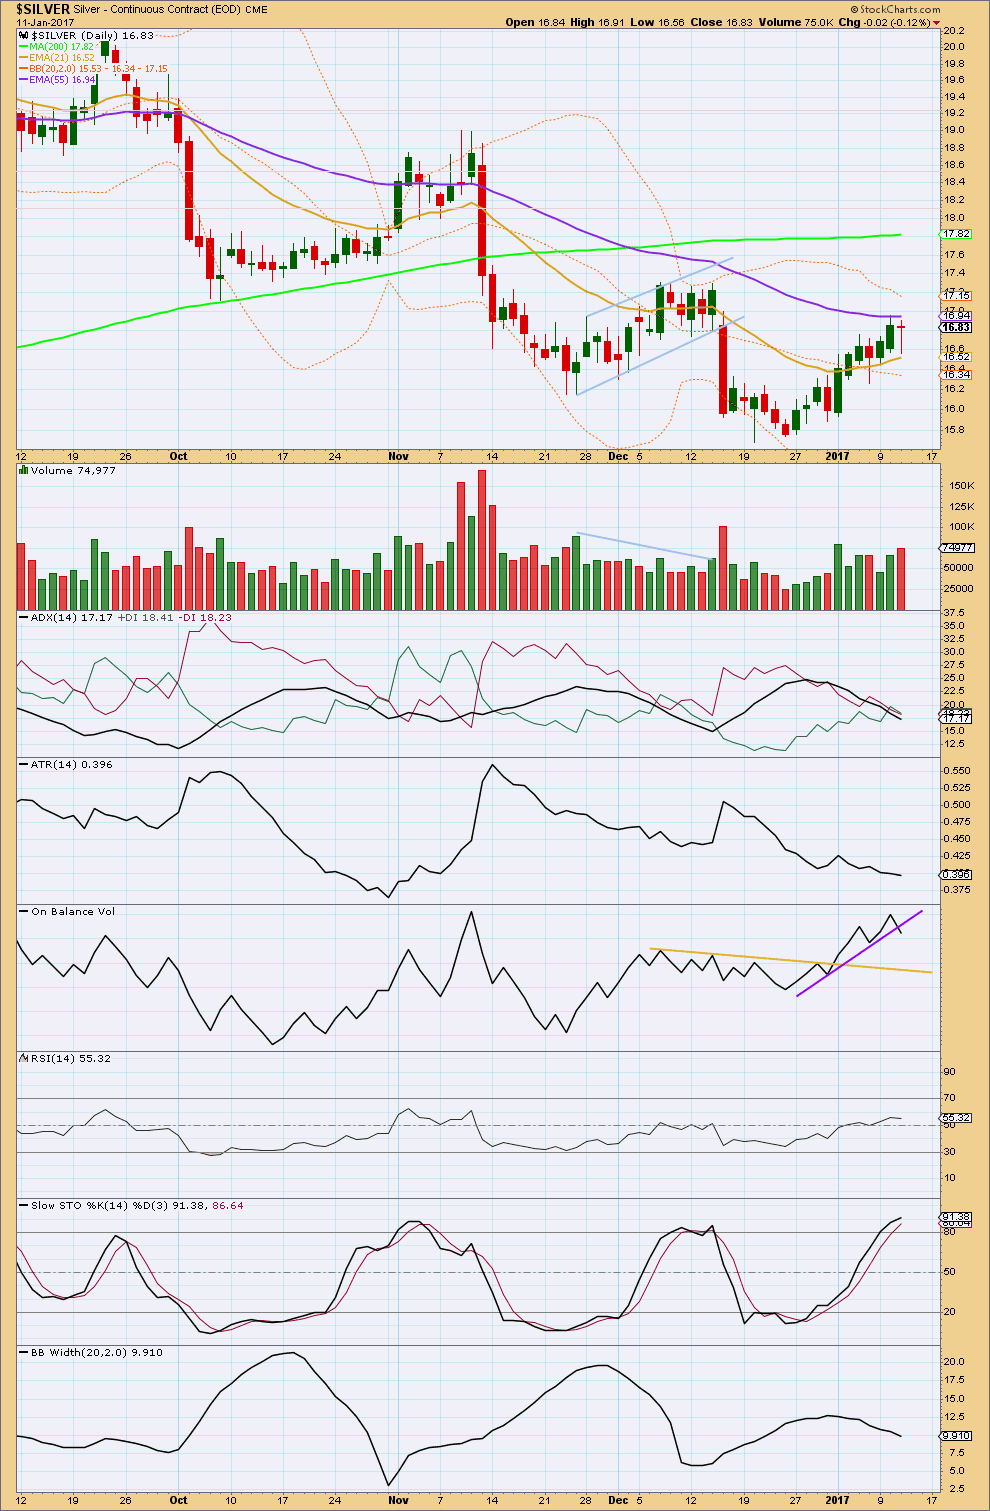
Click chart to enlarge. Chart courtesy of StockCharts.com.
The rise in price off the last low mostly comes with support from rising volume.
A downwards day closes red today and comes with an increase in volume; the fall in price today has support from volume. This is bearish for the short term. It may be reasonably expected to be followed by at least one more downwards day.
ADX is declining, indicating the market is consolidating. The black ADX line is now below both the +DX and -DX lines. There is again plenty of room for price to start a trend.
The mid term Fibonacci 55 day moving average may offer some resistance here.
The longer term trend for Silver is still indicated as upwards; the long term 200 day moving average is still pointing up. The mid term average has mostly been pointing downwards recently though, indicating a deeper correction within an upwards trend.
Price comes with declining ATR as it moves higher off the last low. This is normal for both the start of a new trend and for a consolidation, so this would suggest either may be happening.
On Balance Volume gave a bullish signal with a breach above the yellow line. It gives a weak bearish signal today with a break below the purple line. This signal is only weak because the line has been only tested twice before, is very steep, and is not long held.
RSI is bullish above 50.
Stochastics is overbought, but during a trend this may remain extreme for reasonable periods of time. It indicates this upwards wave may be over here or soon, but it cannot pinpoint a turn for price. It is a warning of an impending trend change.
Bollinger Bands have been contracting for the latter half of this rise in price indicating volatility is declining. This is a warning that this upwards movement may end soon.
This analysis is published @ 08:58 p.m. EST.
SLV filled an important gap at 15.87 and interestingly enough,closed precisely at that level. A decline ahead of a close above 16.00 likely. The next important gap is at the Nov 11 low at 16.31. Any close above 16.00 will probably speedily reach that target.
Hiya Verne…
Nicely pointed out. I missed that gap. Thanks!