
Price has moved overall lower as last week’s Elliott wave and technical analysis expected.
Summary: Downwards movement is now expected to at least 28.61. The target is at 25.59. A new low below 49.96 would add confidence that price has turned downwards. Expect more downwards movement while price remains below the green resistance line on the daily chart. If this line is breached, then the Elliott wave count is in doubt short term.
New updates to this analysis are in bold.
MONTHLY ELLIOTT WAVE COUNT
Click chart to enlarge.
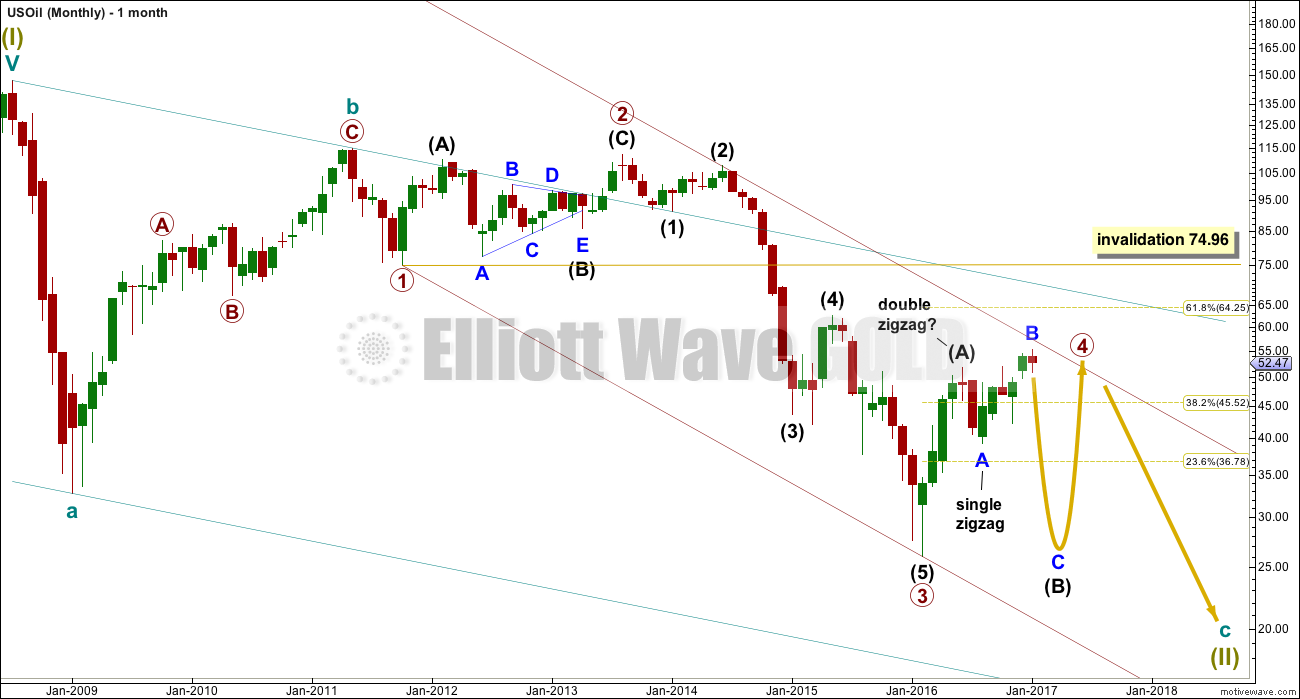
Within the bear market, cycle wave b is seen as ending in May 2011. Thereafter, a five wave structure downwards for cycle wave c begins.
Primary wave 1 is a short impulse lasting five months. Primary wave 2 is a very deep 0.94 zigzag lasting 22 months. Primary wave 3 is a complete impulse with no Fibonacci ratio to primary wave 1. It lasted 30 months.
Primary wave 4 is likely to exhibit alternation with primary wave 2. Primary wave 4 is most likely to be a flat, combination or triangle. Within all of these types of structures, the first movement subdivides as a three. The least likely structure for primary wave 4 is a zigzag.
Primary wave 4 is likely to end within the price territory of the fourth wave of one lesser degree; intermediate wave (4) has its range from 42.03 to 62.58.
Primary wave 4 may end if price comes up to touch the upper edge of the maroon channel. The upper edge of this channel has been pushed up to sit on the end of intermediate wave (2) within primary wave 3.
Primary wave 4 is most likely to be shallow to exhibit alternation in depth with primary wave 2. So far it has passed the 0.382 Fibonacci ratio at 45.52. It may now continue to move mostly sideways in a large range.
Primary wave 4 may not move into primary wave 1 price territory above 74.96.
At this stage, primary wave 4 has completed intermediate wave (A) only. Intermediate wave (B) is incomplete.
WEEKLY ELLIOTT WAVE COUNT
Click chart to enlarge.
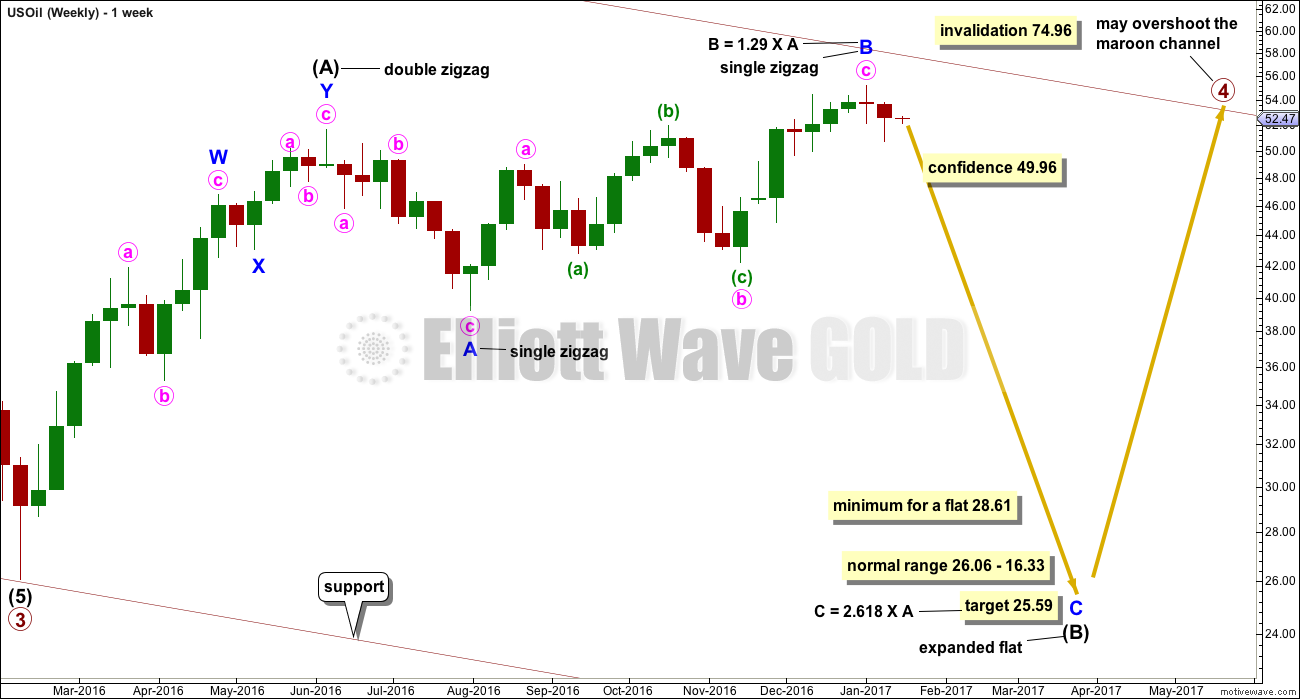
This week a weekly chart is added for clarity. The whole structure of primary wave 4 is seen here in more detail.
The first wave labelled intermediate wave (A) is seen as a double zigzag which is classified as a three.
Intermediate wave (B) is also a three. This means primary wave 4 is most likely unfolding as a flat correction if my analysis of intermediate wave (A) is correct. Flats are very common structures.
Intermediate wave (B) began with a zigzag downwards. This indicates it too is unfolding most likely as a flat correction.
Within intermediate wave (B), the zigzag upwards for minor wave B is a 1.29 correction of minor wave A. This indicates intermediate wave (B) may be unfolding as an expanded flat, the most common type.
The normal range for intermediate wave (B) within a flat correction for primary wave 4 is from 1 to 1.38 the length of intermediate wave (A) giving a range from 26.06 to 16.33.
Primary wave 4 may not move into primary wave 1 price territory above 74.96.
DAILY ELLIOTT WAVE COUNT
Click chart to enlarge.
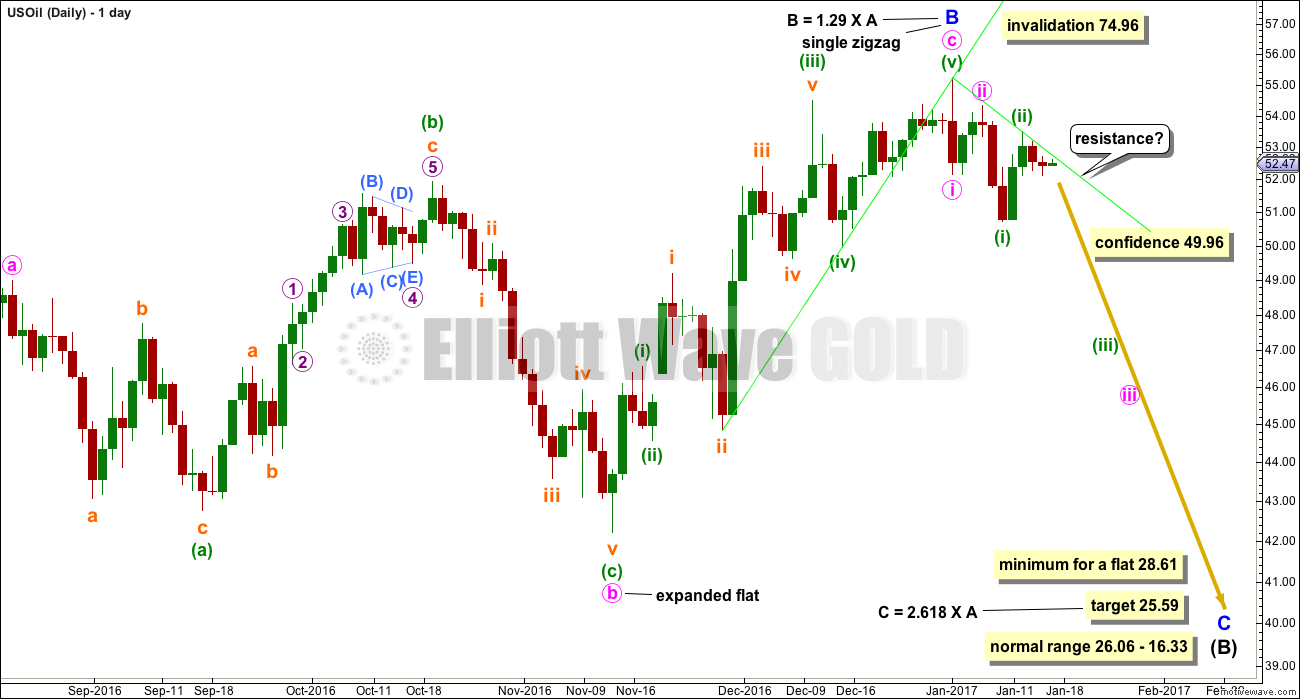
It must be accepted that minor wave B could continue higher while price remains above the confidence point at 49.96. A new low below the start of minuette wave (v) at 49.96 could not be a second wave correction within the last fifth wave up, so at that stage confidence may be had in a trend change.
Minor wave C downwards must subdivide as a five wave structure.
Price may now find resistance about the downwards sloping green trend line.
TECHNICAL ANALYSIS
DAILY CHART
Click chart to enlarge. Chart courtesy of StockCharts.com.
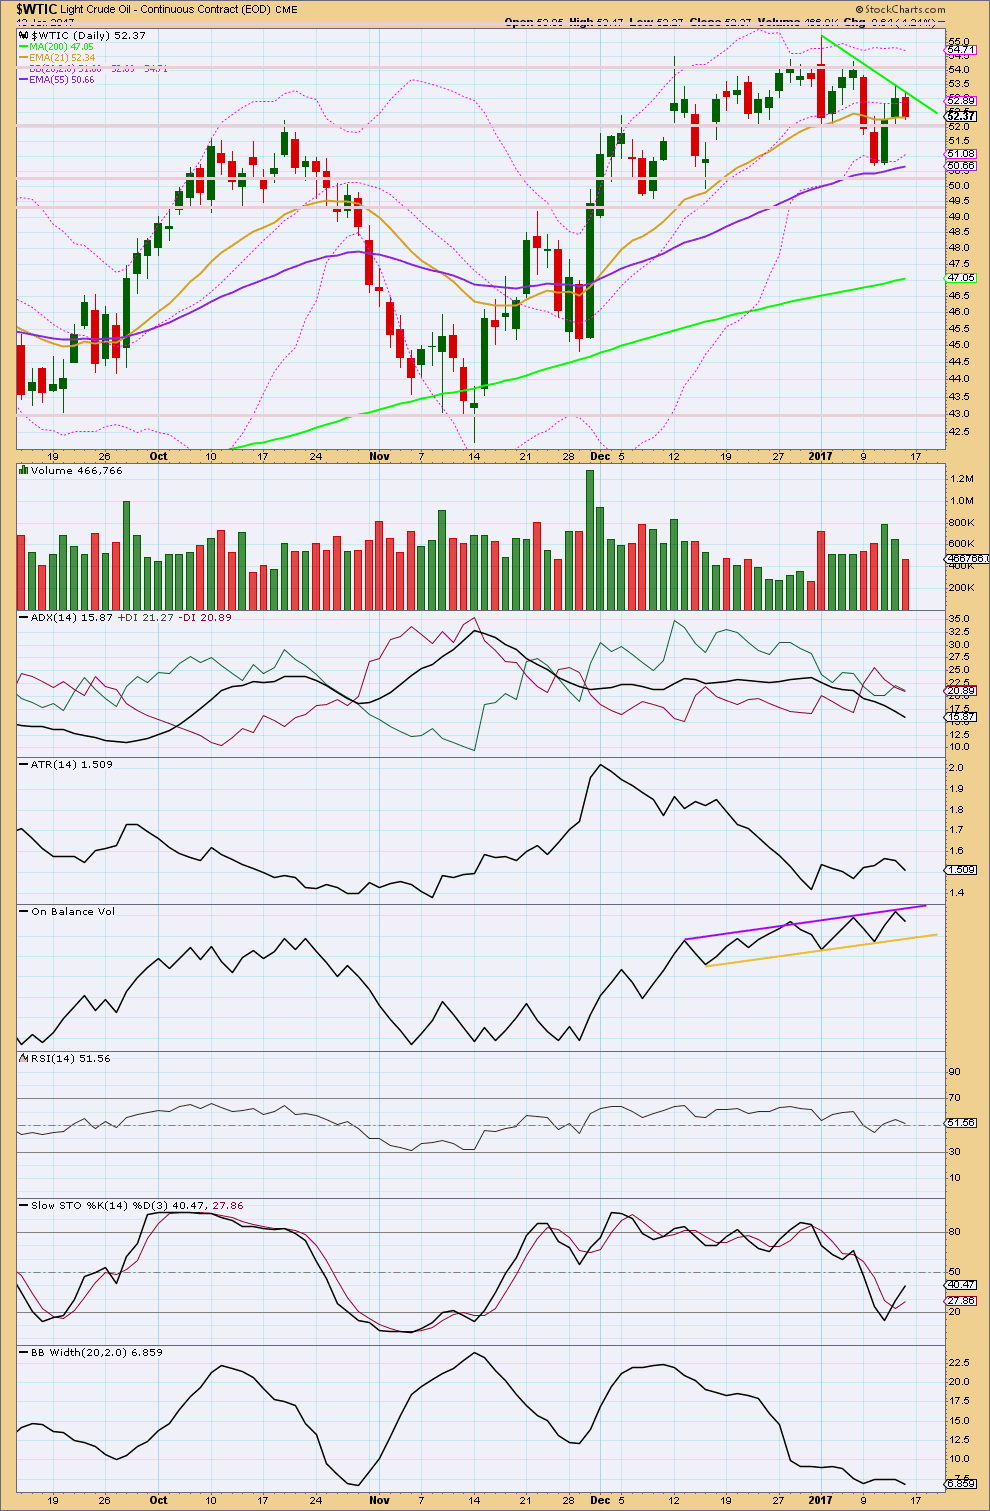
The short term volume profile is unclear. This is unfortunately typical for Oil.
The last fall to the last short term low on the 10th of January came with some increase in volume supporting the fall in price and supporting the Elliott wave count.
However, the next rise to the last high came with stronger volume although the second day was weaker than the first. Now a downwards day comes with weaker volume. In the very short term Oil may move higher.
ADX is declining and the directional lines are sitting together. No clear trend is at this time indicated and a possible trend change is also unclear.
Overall, ATR may be showing some increase since the high of the 3rd of January, so this downwards movement may be a new trend. This would need to be confirmed by ADX for confidence though.
On Balance Volume remains constrained and the upper resistance line is redrawn slightly this week. A breakout by OBV may precede the next direction for price. The resistance line may halt a further rise in price here, but there is some leeway in exactly how this line is drawn.
RSI is close enough to neutral to be unclear. There is plenty of room for price to rise or fall.
Stochastics has reached oversold. With ADX indicating a consolidating market, Stochastics may be used to signal a reversion to the mean. Some upwards movement to resistance about $54 may be expected about here using this approach.
Bollinger Bands are still tightly contracted. This is normal for a consolidation, but also at the start of a new trend, and it is impossible to tell at this time which situation the market is currently in.
Overall, this classic technical analysis this week is neutral. The situation is unclear.
This analysis is published @ 11:35 p.m. EST.