
Price has moved sideways for the week. A new Elliott wave count fits sideways movement.
Summary: A new high above 55.24 would indicate an upwards breakout, and the target would be 55.60. A new low below 50.91 would indicate a downwards breakout, and the target would be 28.61 minimum, possibly 25.59.
New updates to this analysis are in bold.
MONTHLY ELLIOTT WAVE COUNT
Click chart to enlarge.
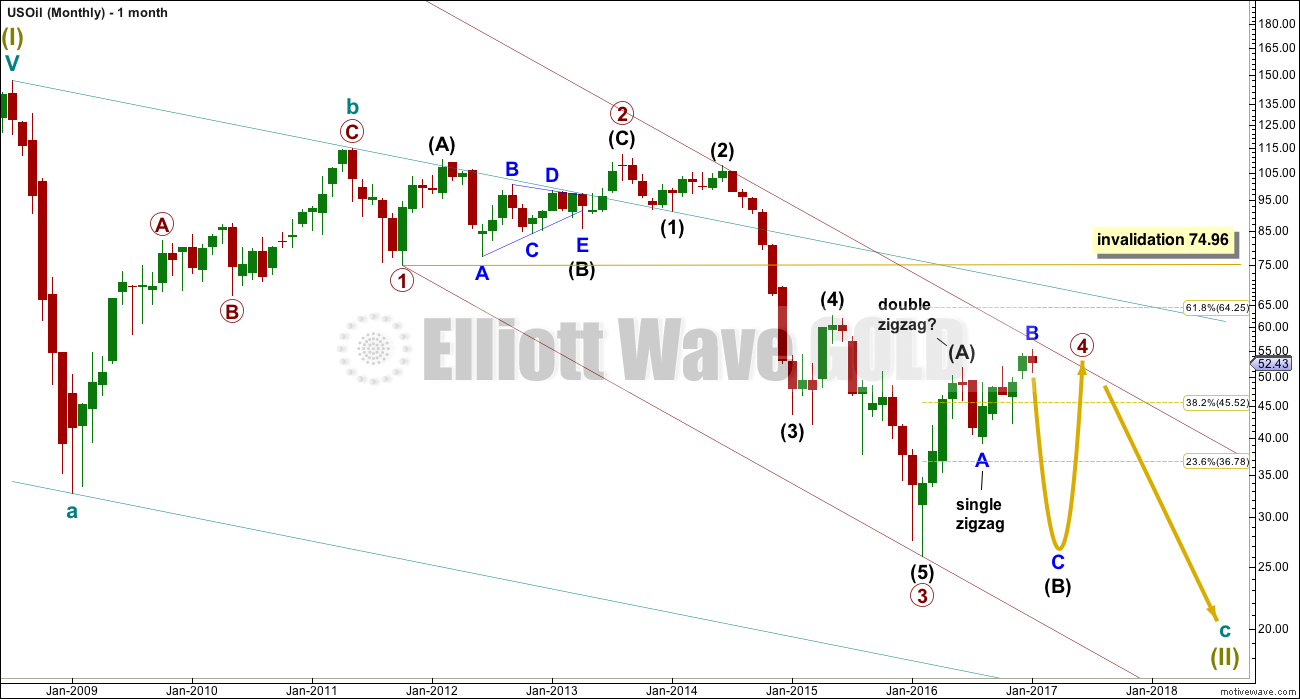
Within the bear market, cycle wave b is seen as ending in May 2011. Thereafter, a five wave structure downwards for cycle wave c begins.
Primary wave 1 is a short impulse lasting five months. Primary wave 2 is a very deep 0.94 zigzag lasting 22 months. Primary wave 3 is a complete impulse with no Fibonacci ratio to primary wave 1. It lasted 30 months.
Primary wave 4 is likely to exhibit alternation with primary wave 2. Primary wave 4 is most likely to be a flat, combination or triangle. Within all of these types of structures, the first movement subdivides as a three. The least likely structure for primary wave 4 is a zigzag.
Primary wave 4 is likely to end within the price territory of the fourth wave of one lesser degree; intermediate wave (4) has its range from 42.03 to 62.58.
Primary wave 4 may end if price comes up to touch the upper edge of the maroon channel. The upper edge of this channel has been pushed up to sit on the end of intermediate wave (2) within primary wave 3.
Primary wave 4 is most likely to be shallow to exhibit alternation in depth with primary wave 2. So far it has passed the 0.382 Fibonacci ratio at 45.52. It may now continue to move mostly sideways in a large range.
Primary wave 4 may not move into primary wave 1 price territory above 74.96.
At this stage, primary wave 4 has completed intermediate wave (A) only. Intermediate wave (B) is incomplete.
WEEKLY ELLIOTT WAVE COUNT

Click chart to enlarge.
The whole structure of primary wave 4 is seen here in more detail.
The first wave labelled intermediate wave (A) is seen as a double zigzag, which is classified as a three.
Intermediate wave (B) is also a three. This means primary wave 4 is most likely unfolding as a flat correction if my analysis of intermediate wave (A) is correct. Flats are very common structures.
Intermediate wave (B) began with a zigzag downwards. This indicates it too is unfolding most likely as a flat correction.
Within intermediate wave (B), the zigzag upwards for minor wave B is a 1.29 correction of minor wave A. This indicates intermediate wave (B) may be unfolding as an expanded flat, the most common type.
The normal range for intermediate wave (B) within a flat correction for primary wave 4 is from 1 to 1.38 the length of intermediate wave (A) giving a range from 26.06 to 16.33.
Primary wave 4 may not move into primary wave 1 price territory above 74.96.
Within the larger expanded flat correction of primary wave 4, intermediate wave (B) must retrace a minimum 0.9 length of intermediate wave (A) at 28.61 or below.
DAILY ELLIOTT WAVE COUNT
Click chart to enlarge.
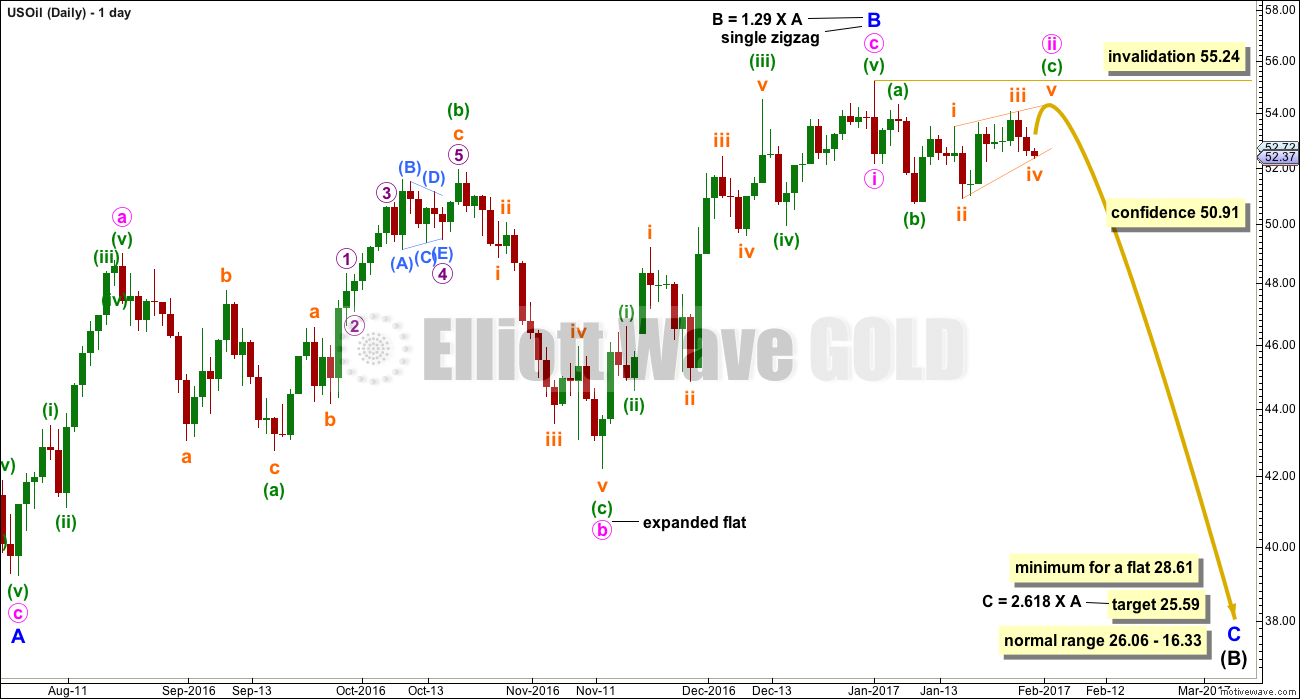
Minor wave B is seen in this main wave count as a complete single zigzag. The upwards wave labelled minute wave a is seen as a five wave impulse.
Minor wave C downwards should have begun. Within minor wave C, minute wave ii may not move beyond the start of minute wave i above 55.24.
Minor wave C downwards must subdivide as a five wave structure.
So far, minute wave i may be complete and minute wave ii may be an incomplete expanded flat correction. Within minute wave ii, minuette wave (c) must be a five wave structure that so far looks to be unfolding as an ending contracting diagonal that’s incomplete. The classic pattern equivalent is a rising wedge.
Contracting diagonals almost always end with a small overshoot of the 1-3 trend line. If this is seen, then expect an end to upwards movement as very likely.
Minuette wave (c) is very likely to make a slight new high above the end of minuette wave (a) at 54.32 to avoid a truncation and a very rare running flat.
A new low below 50.91 would invalidate the alternate wave count below and provide some confidence in this main wave count.
ALTERNATE DAILY ELLIOTT WAVE COUNT
Click chart to enlarge.
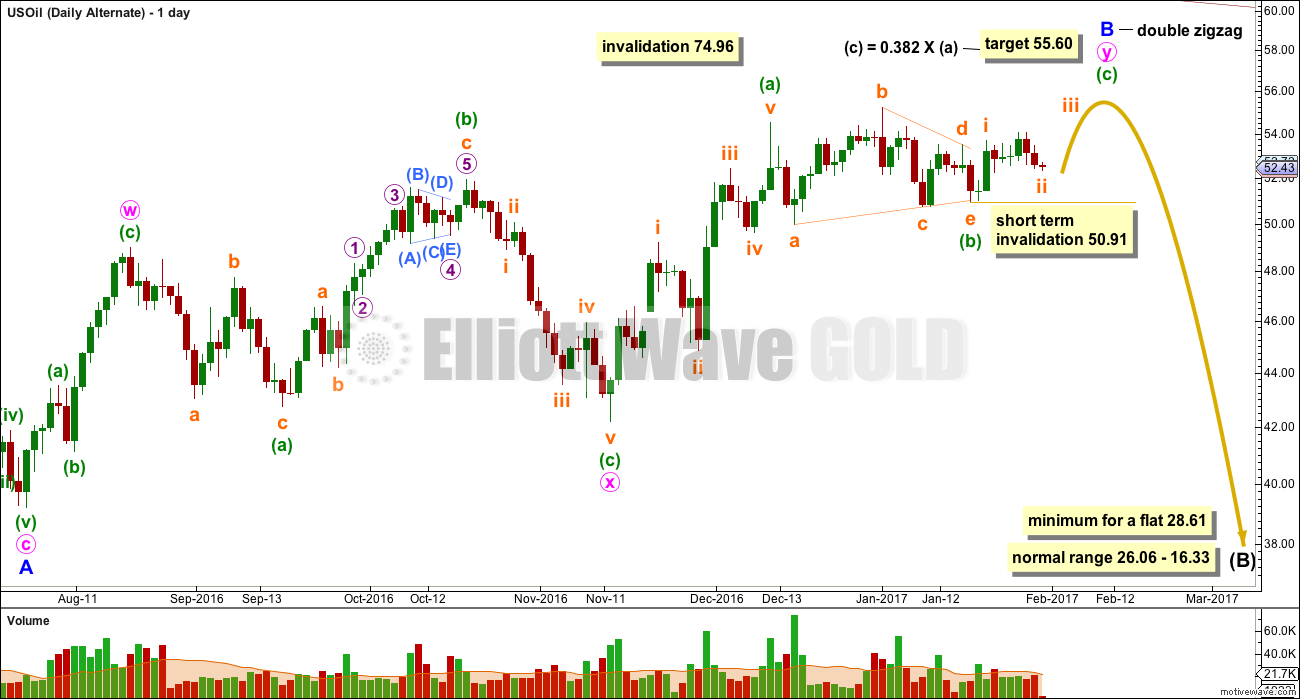
Minor wave B is seen as an incomplete double zigzag. The first wave up labelled minute wave w is seen as a zigzag. This is the main difference between the two wave counts.
Minute wave y must subdivide as a zigzag. Sideways movement over the last few weeks may be a triangle within it for minuette wave (b).
Minuette wave (c) would be very likely to make at least a slight new high above the end of minuette wave (a) at 54.50 to avoid a truncation.
The normal range for minor wave B within the larger flat correction of intermediate wave (B) is from 1 to 1.38 the length of minor wave A, giving a range from 51.67 to 56.41. The target calculated for minuette wave (c) to end would see price end within this range.
In the short term, within minuette wave (c), the correction for subminuette wave ii may not move beyond the start of subminuette wave i below 50.91.
TECHNICAL ANALYSIS
DAILY CHART
Click chart to enlarge. Chart courtesy of StockCharts.com.
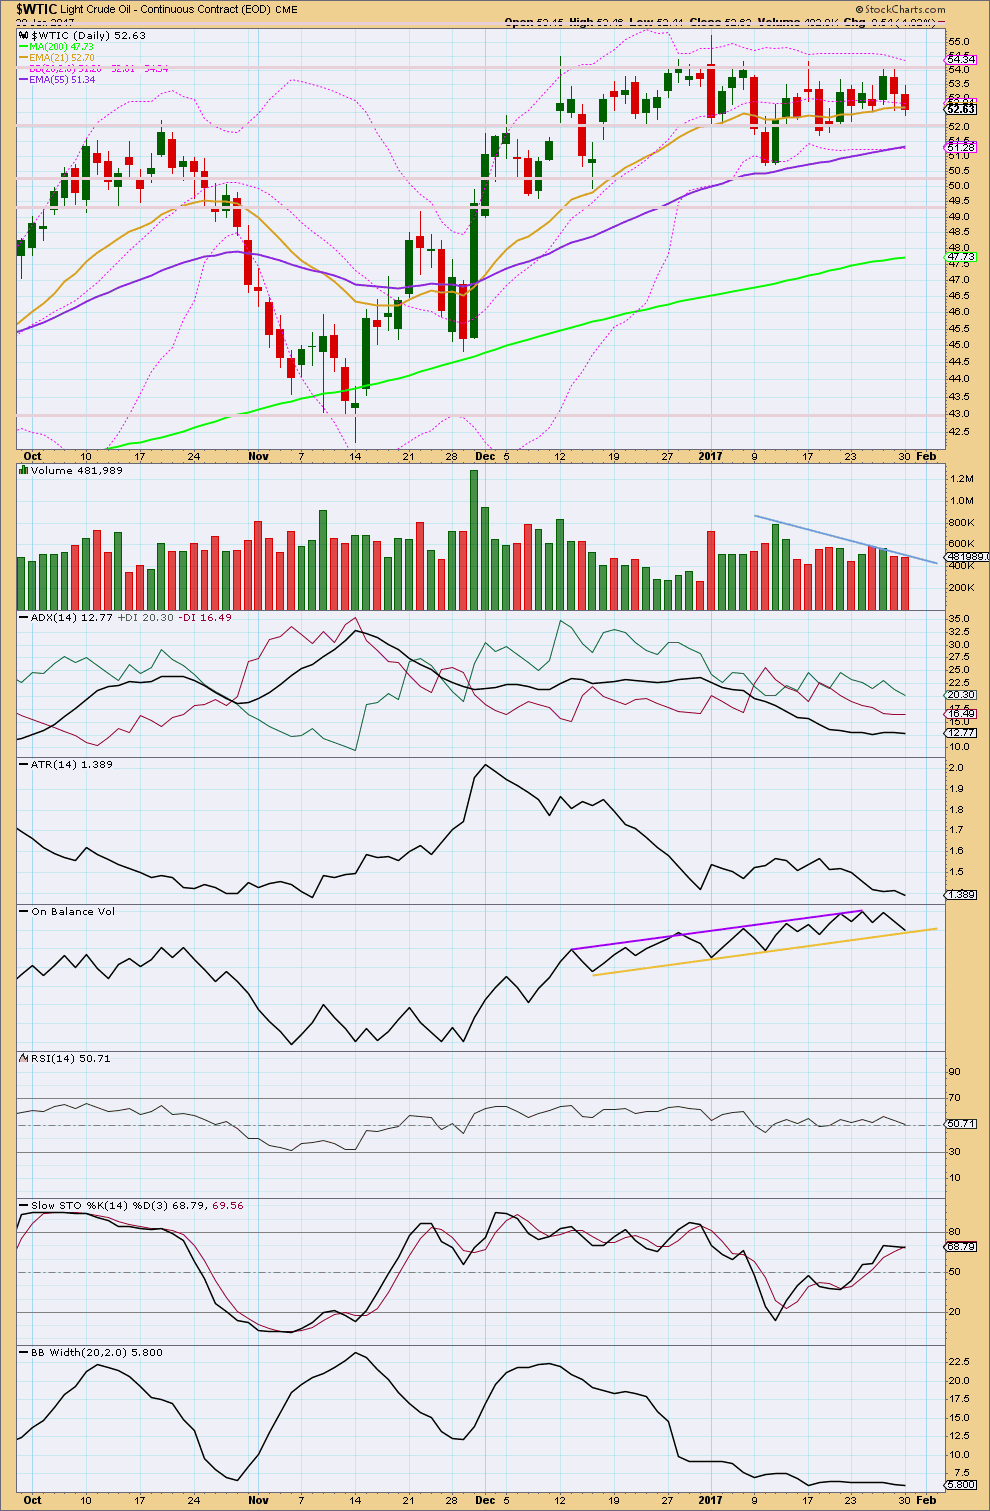
Price continues to move sideways with declining volume. Price is bound by resistance about 54.50 and support about 50.35. During this sideways consolidation, it is an upwards day which has strongest volume suggesting an upwards breakout is more likely than downwards. This supports the new alternate Elliott wave count.
ADX is flat and below 15 indicating the market is not currently trending; it is consolidating. The +DX and -DX lines are whipsawing about each other. There is no clear trend.
ATR is overall flat in agreement with ADX that Oil is consolidating.
On Balance Volume is bound by resistance and support. No breakout yet has occurred to indicate the next direction for price. OBV has come down to touch the yellow support line today. This may assist to halt the fall in price here. This supports the alternate Elliott wave count.
RSI is hovering about neutral. There is plenty of room for price to rise or fall.
Stochastics is returning from oversold.
A range bound approach to this market may now expect price to move higher and only end an upward swing when price finds resistance and Stochastics reaches overbought at the same time.
Bollinger Bands are tightly contracted. Volatility will return to this market. The longer Bollinger Bands remain contracted the more explosive the next movement may be.
This week’s classic technical analysis slightly supports the alternate Elliott wave count over the main Elliott wave count. The situation is still mostly unclear for Oil this week.
This analysis is published @ 01:47 a.m. EST.
[Note: Analysis is public today for promotional purposes. Member comments and discussion will remain private.]
https://www.tradingview.com/chart/USDCAD/UVNilkJV-USDCAD-Buy-USOIL-Bear-February/
correlation usd/cad and Oil
for thous who are interested
I had seen your comment on the gold forum about the correlation… so thanks Ursula for posting.
There is also a sentiment factor. A lot of analysts are looking for oil to hit 60-65 range stating the chart “looks great” for an upside breakout. They also cite the OPEC production cuts. Which makes shorting oil a contrarian play. Along with the massive net short position of commercials in the COT reports.
We had the overshoot today of minuette (a), and turned down from there. But I’m not sure if we hit the contracting diagonal 1-3 upper trend line?
BB’s are contracting, so big move getting closer. And commitment of traders commercials haven’t been this extreme in short position since oil was over $100 (about 500,000 net short).
On the other hand price is resilient toward’s downside. Price didn’t budge downwards even with EIA’s inventory increasing by twice as much as estimates last week.
Anyone else trading oil to the short or long side?