
Downwards movement continued as expected for Monday’s session.
The main Elliott wave count remains the same. The alternate is slightly adjusted at the hourly chart level.
Summary: The target for a deep pullback is at 1,148.
Follow my two Golden Rules of risk management:
1. Always use a stop.
2. Invest no more than 1-5% of equity on any one trade.
New updates to this analysis are in bold.
Last monthly and weekly charts are here. Last historic analysis video is here.
Grand SuperCycle analysis is here.
MAIN ELLIOTT WAVE COUNT
DAILY CHART
Click chart to enlarge.
This main wave count has a better fit for prior movement. To see the difference between this main wave count and the alternate below please refer to last historic analysis linked to above.
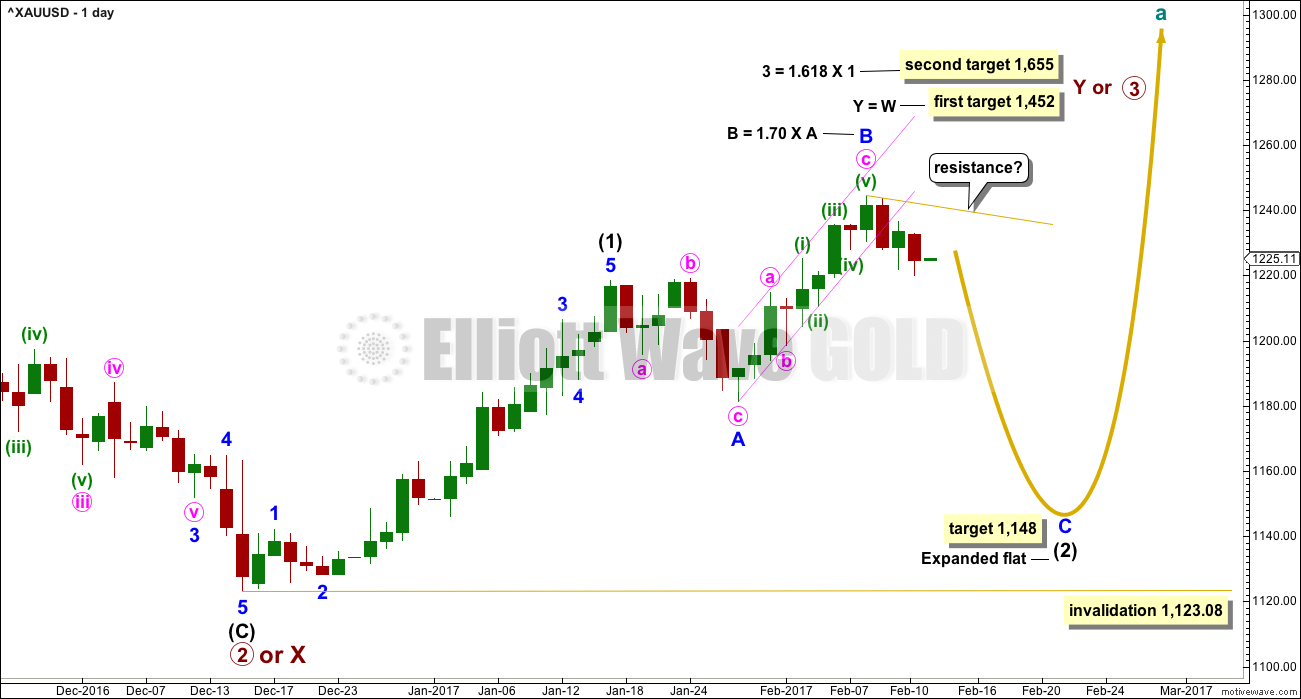
This main wave count expects Gold has had a primary degree trend change in December 2016. The new upwards wave is either a primary degree third wave, or a primary degree zigzag to complete a double zigzag.
Intermediate wave (1) is an impulse that may have lasted 23 days, two longer than a Fibonacci 21. Intermediate wave (2) may be unfolding as a very common expanded flat correction.
Within intermediate wave (2), minor wave A fits best as a regular flat and minor wave B is a zigzag. Minor wave B is longer than the common length of 1 to 1.38 times A, but within the allowable convention of up to two times the length of A.
The appropriate target for minor wave C is 2.618 the length of minor wave A.
So far intermediate wave (2) has lasted nineteen sessions. Minor waves A and B have lasted a Fibonacci eight sessions each. If intermediate wave (2) exhibits a Fibonacci duration, it may a total 34 sessions.
Alternatively, intermediate wave (2) may not exhibit a Fibonacci duration.
HOURLY CHART
Click chart to enlarge.
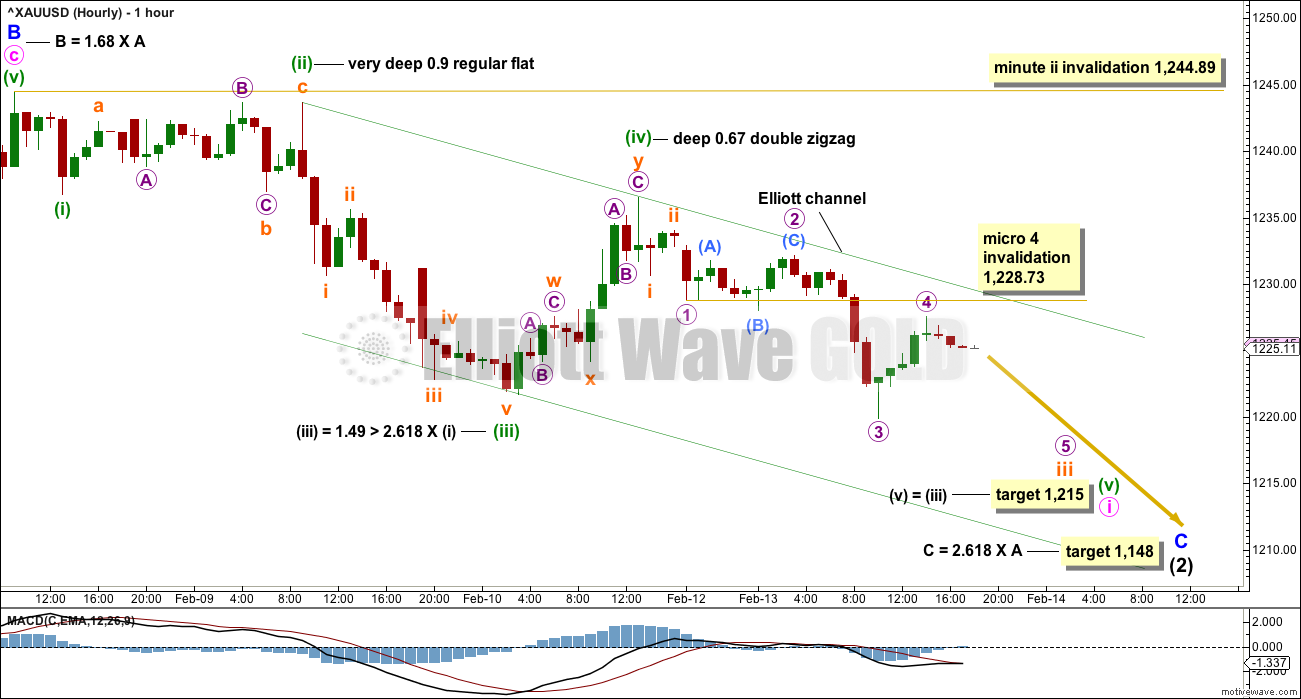
The labelling within minute wave i is changed after analysis of the five minute chart. Minute wave i may be close to completion.
This wave count has a good Fibonacci ratio between minuette waves (i) and (iii), and good alternation between minuette waves (ii) and (iv).
The channel is drawn using Elliott’s second technique. When the upper edge is breached by at least one full hourly candlestick above and not touching the trend line, then assume minute wave i is over and minute wave ii has begun.
While minuette wave (v) is unfolding, the correction for micro wave 4 may not move into micro wave 1 price territory above 1,228.73. If this invalidation point is breached before the structure of minuette wave (v) looks complete, then my labelling within minuette wave (v) would be wrong; it is possible it may be over at today’s low.
When minute wave i is a complete five wave impulse, then minute wave ii may unfold over one to three days but may not move beyond the start of minute wave i above 1,244.89. Minute wave ii may show up on the daily chart as one to three green candlesticks or doji.
Thereafter, minute wave iii downwards should exhibit an increase in momentum.
ALTERNATE ELLIOTT WAVE COUNT
DAILY CHART
Click chart to enlarge.
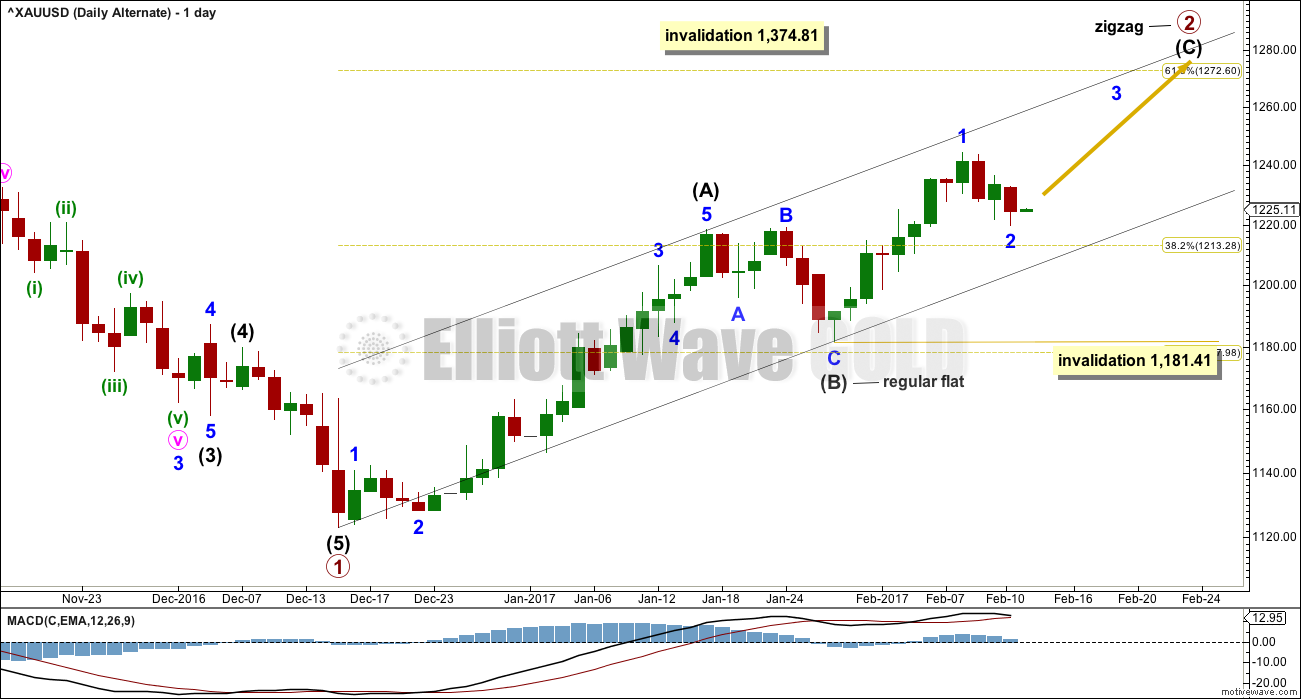
This alternate wave count expects that Gold is still within a bear market. Targets for new lows can be seen on weekly and monthly charts.
Within the bear market, a primary degree correction is underway.
Primary wave 2 is most likely to subdivide as a zigzag. Intermediate wave (A) is complete.
The alternate idea today reverts back to seeing the correction here labelled intermediate wave (B) (and for the main wave count it would be labelled intermediate wave (2) ) as a complete regular flat.
The next five up, for this alternate labelled intermediate wave (C) (and for the main wave count labelled intermediate wave (3) ), may have begun.
Within the impulse upwards, a first wave labelled minor wave 1 may now be complete. Minor wave 2 may not move beyond the start of minor wave 1 below 1,181.41.
Primary wave 2 may not move beyond the start of primary wave 1 above 1,374.81.
HOURLY CHART
Click chart to enlarge.
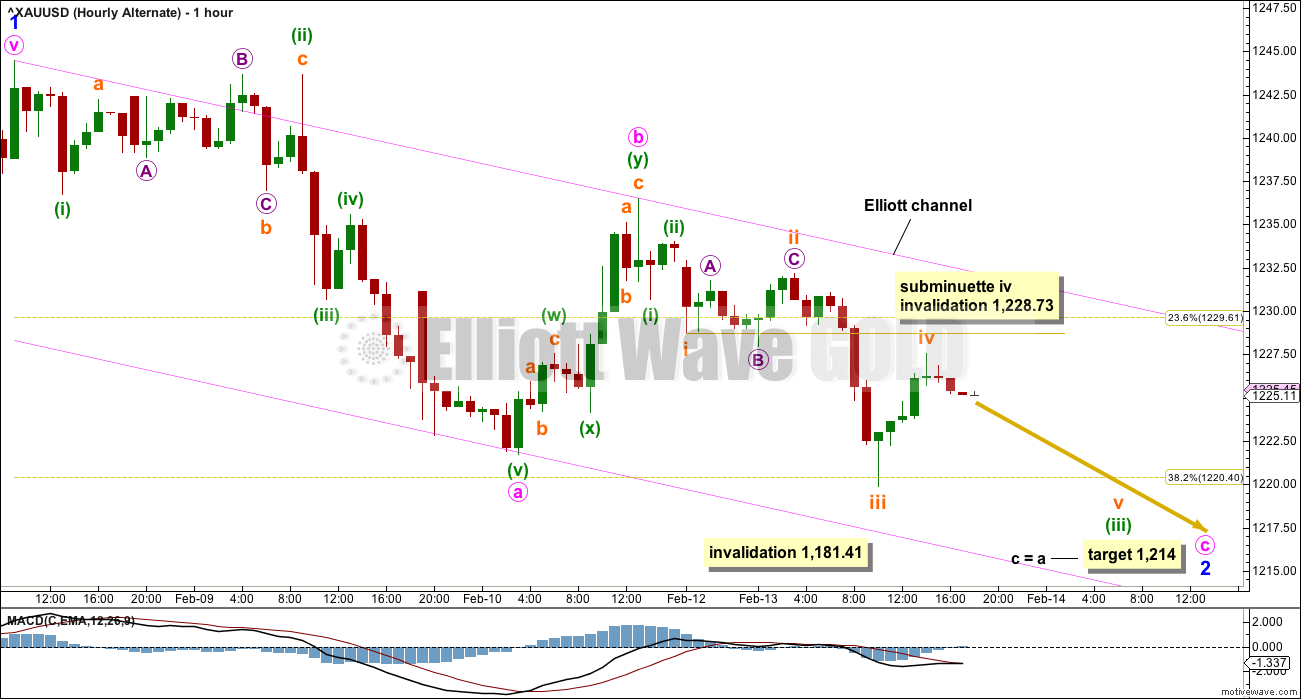
Minor wave 2 may be continuing lower as a zigzag.
The same idea here applies regarding the invalidation point for subminuette wave iv. Assume minor wave 2 is incomplete while price remains below 1,228.73. A new high above 1,228.73 could not be a fourth wave correction, so downwards movement should be complete.
This labelling fits best on the five minute chart, but it is also possible to see the structure of minute wave c as a complete five wave impulse.
TECHNICAL ANALYSIS
WEEKLY CHART
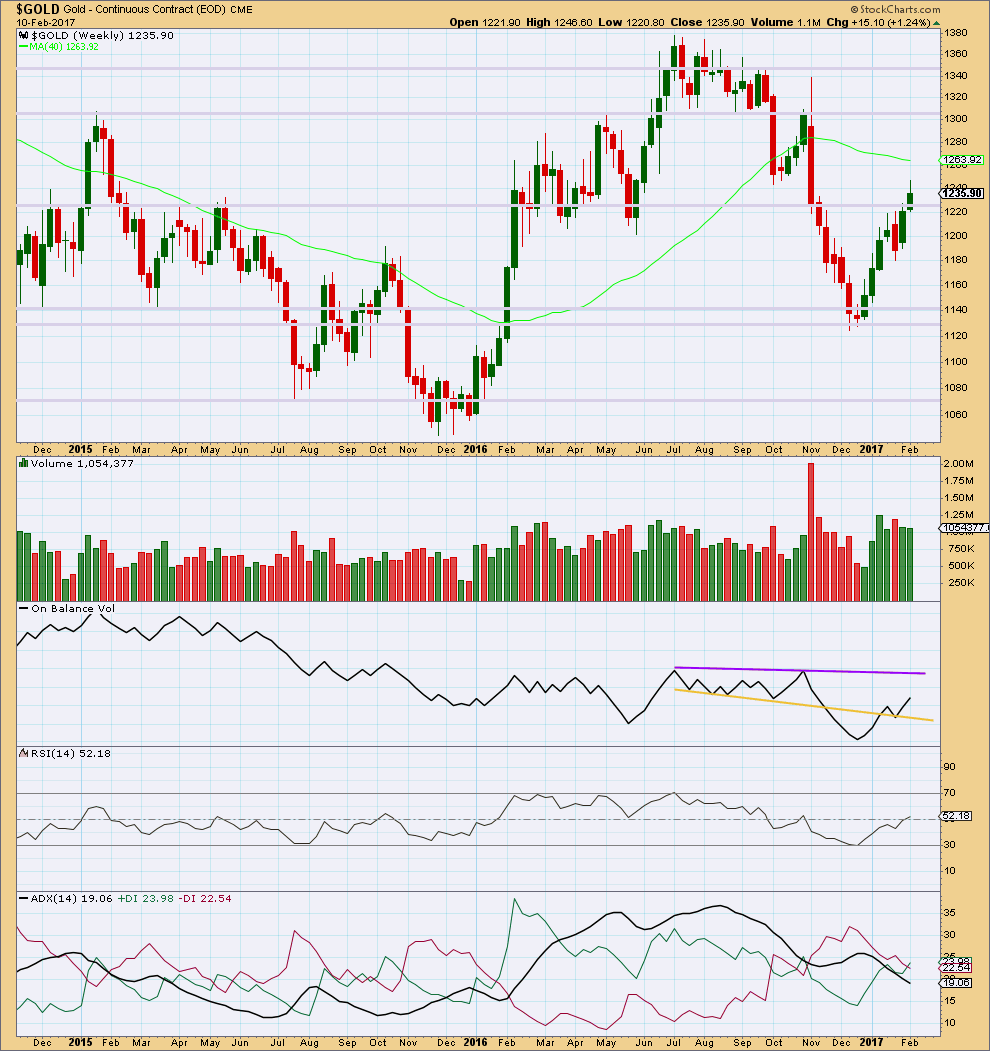
Click chart to enlarge. Chart courtesy of StockCharts.com.
The long upper wick and smaller real body on last week’s candlestick is slightly bearish. The decline in volume is also bearish.
The strongest weekly volume in recent weeks is a downwards week, and this too is bearish.
On Balance Volume is some distance away from resistance.
ADX continues to decline indicating no clear trend.
DAILY CHART
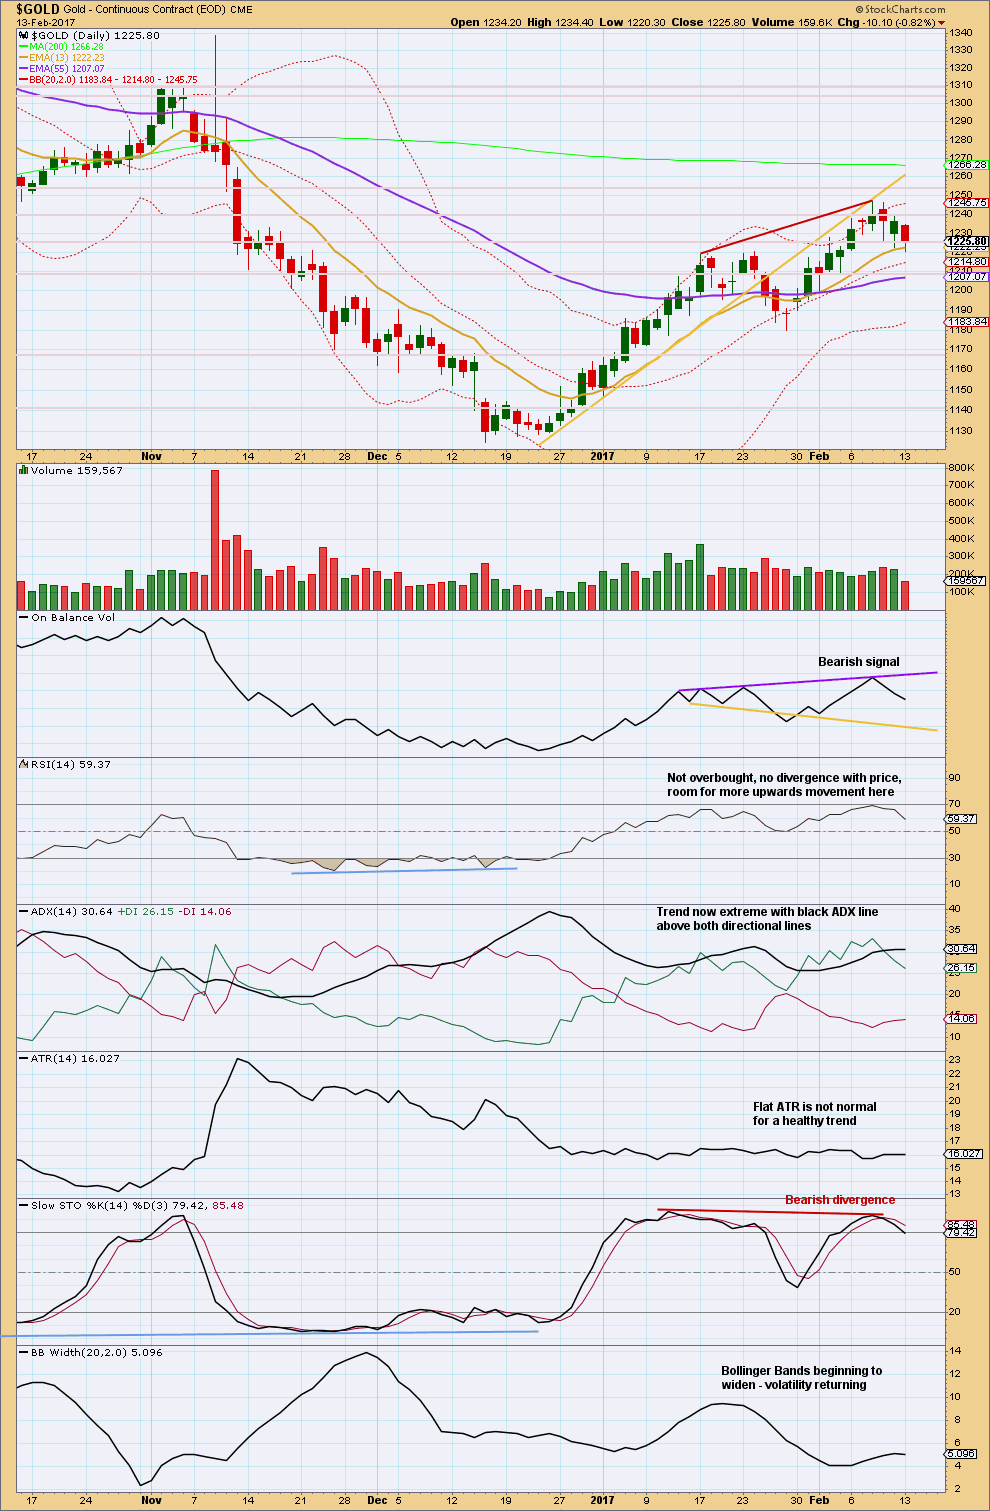
Click chart to enlarge. Chart courtesy of StockCharts.com.
Two days now of downwards movement has declining volume. The fall in price is not supported by volume; the market fell of its own weight. This is suspicious, and it does not support the main Elliott wave count.
However, overall this chart remains fairly bearish. Reasonable weight should be given to the bearish signal from On Balance Volume. In conjunction with extreme ADX and bearish divergence with Stochastics, it looks reasonable to expect some more downwards movement here.
GDX
DAILY CHART
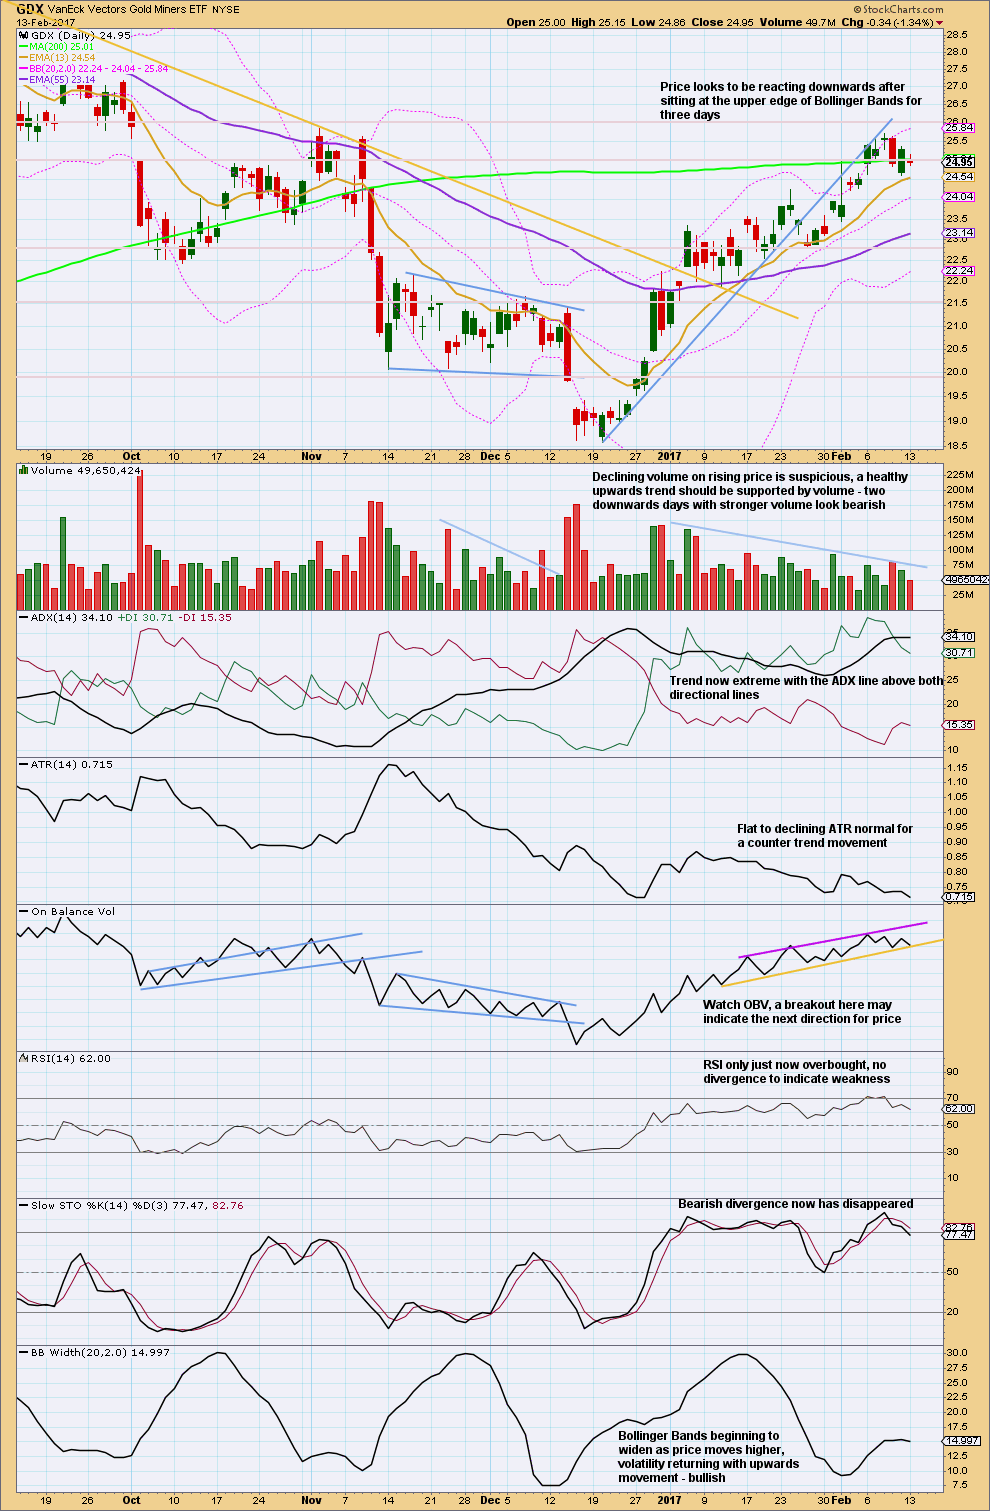
Click chart to enlarge. Chart courtesy of StockCharts.com.
It would be reasonable to expect GDX to find support here about the short term Fibonacci 13 day moving average.
Two days of downwards movement comes with a decline in volume. This small pullback does not have support from volume, so it would be reasonable to expect it may end here or very soon.
Watch On Balance Volume carefully tomorrow. One more downwards day would give a bearish signal. If that happens, it should be given substantial weight.
This analysis is published @ 06:42 p.m. EST.
Yes… Lara…
Reason comes w/age. It becomes harder to take risks with the body as we age. Water is Great!
Meanwhile… folks may wish to take a look @ http://www.gannglobal.com/webinar/2017/February/17-02-GGF-Webinar-Invite.php?inf_contact_key=099ce72f81c860b976c9d55f6f4d7270f2d100f2957f45f0796054d1209f93a7
Full Video, Thurs, Feb 16, Eve, EST. James is looking for a pull back in HUI which coincides w/Lara’s analysis.
Looks like an extremely deep pullback…back to 2015…interesting…
I have a question Lara. It looks the dollar will weaken short term against the JPY, EUR and NZD as they pull back for corrections. If this is the case wouldn’t we expect Gold to go up for a while rather than down from here?
It’s entirely possible. There will be corrections within this trend.
But I’m not seeing it happen right here right now.
I will leave the invalidation point on the hourly chart for Gold at the start of minute wave i and allow for the possibility that minute ii may continue further as a flat correction. It looks less likely, but I will acknowledge the possibility.
Thanks for the tip Lara, re trading from the daily charts. I guess it cuts out a load of movement and hence angst.
Yep. It keeps it simple and clean. Focus on the trend, let the profit run.
I find if I’m analysing all the little waves on an hourly and down to five minute chart I don’t do that, then I’m in and out like an In ‘N Out Burger and my profit is less, risk increases.
This price action not at all looking like what should be inception of a third wave down; what else could be afoot?
Clearly five up off the bottom this morning (for JNUG) – a C wave perhaps?
Verne,
I have the last ‘leg up’ as part of a retracement, last leg being a c wave of a w-x-y.
I’m hoping it is complete. From the High, near 0.70 Retrace, gold does not look too energetic.
Let’s see if I am correct. I just shorted more.
It won’t fit as a five. The third wave would be the shortest and the fourth wave would overlap first wave territory.
It will fit as a double zigzag.
Lara,
In answer to your question about the trading room I think the NZD/USD has completed a five down and I am waiting for a three wave pull back before entering.
So yes, I do think the Trading Room is useful. Dare I ask if you could publish the odd hourly update as well? That would be great.
Sure thing. I’ll post charts and updates in the Trading Room post on how I’m managing my short position.
TBH when I’m trading I use EW only at the daily level, I don’t actually do hourly charts. I use trend lines and channels along with a few indicators to show weakness in the trend.
I hold my position until I see one of these things:
1. My target is met and the position automatically closes. Best case scenario.
2. A trend line or channel is breached in the opposite direction, close the position.
3. Extreme readings and then multiple divergence at hourly and 2 hourly chart levels, depending on what else is happening may close the position.
So I’ll share this approach, I may not do an EW count at the hourly chart level. It will probably be a more classic TA approach.
Thanks guys.
Some light relief.
In my small NZ town Mangawhai we’ve built a skate park, I volunteer with the charitable trust that is building it (I’m their current secretary). We’ve built the largest skate bowl in the Southern Hemisphere, we’re super proud of this.
Every year our biggest event at the park is the annual Mangawhai Bowl Jam.
Here’s a round up of the best from that day….
While this music isn’t my cup of tea, the skating and air these guys get is pretty cool
Wow! Real high flyers! 🙂
Guessing you are involved with skating because you son skates?? Looks like Fun!..and FAST!! I can’t believe how many are Not wearing a helmet!
Yes,… I am long the US Dollar.
Looking @ EEM trade
My teenager does skate, but not very much anymore. A few years ago he broke his wrist really badly in that bowl.
It looked like a spaghetti arm… all wrong. Major surgery on it and a cast for a whole summer later and now he’s pretty nervous about skating in that bowl.
But I still do my volunteer work with the trust to complete the park. One reason for me is last on our list is a sound shell for big outdoor concerts. I’d love to see some live Reggae there in summer….
Yeah, those guys rarely wear helmets. And that concrete is HARD. I tried skateboarding myself and I just totally suck at it. Too afraid of hard concrete. I’ll stick to water thanks
Takes me back to my youth in San Diego. Lot nicer sticks now…
Thanks for sharing.
Hi Lara, I did not take the currency trades. I don’t generally take the currency trades and was just going to see how the Trading Room concept evolved. But, like you said, it doesn’t matter what we are trading as long as it makes money so I will consider them more in the future. Thanks for trying to help us.
Thanks David for your feedback.
Today was a day of currency moves. I don´t like to have a connection to EW Gold on such days. The morning hours were driven by USD/JPY, then later Eur/USD. That was all for the Gold moves. No really change in price.
My Eur/USD put is fine. I don´t have an exit point. I will take the profit by numbers 🙂 THX
So, I want to ask the membership, did anyone else take the opportunities offered in the Trading Room posts to go short NZDUSD, EURUSD and long USD Index and USDJPY?
In other words, is this proving useful for everyone’s profits?
We’re here to make money, right? So how’s that all going?
Yep! Short the Euro, long the dollar via UUP after close above 26.00. All looking good!
Nice one Verne 🙂 I did figure you would be in
No, but I will from now on. Gold’s not doing anything for me…so please keep providing, and I’ll commit to get out of my stubborn ways.
Hi Lara,
Your notes and chart are much appreciated. You show Minute iic as possibly being complete on your chart. What are the probabilities of Minute iic extending for example as an a-b-c flat or has Minute iic already consumed enough time?
Thanks
It certainly could continue further. It’s only 0.58 of minute i, so it didn’t quite reach the 0.618 Fibonacci ratio. If it continued it would be as a flat correction, now in wave B down.
But, it does look like it’s done there. The proportion looks about right to me.
I’m still holding onto my short. My other positions are now positive enough that I can move my stop down to at least breakeven on them, eliminating risk and I may be able to start to protect some profits. Because of that and because my first Gold position was very small (only slightly over 2% of equity) I may now look at adding to my Gold position if another deep bounce occurs.
So I’m going to look at it like this: minute ii looks over, that has the right look. Hold on for minute iii down. If I’m wrong and minute ii bounces higher as a flat then use the opportunity to add to my short position closer to 5% total with both.
Adding JNUG. March 17 11.00 puts. Will roll on 50% gain and compare with 11.50 puts to see which performs better. Equal dollar amounts.
The chart I published in comments yesterday was correct. That’s the problem I find with spending too much time on the five minute chart, sometimes it just confuses the issue rather than helping.
Anyway, as Alan noted in comments below the move above 1,228.73 indicated minuette (v) and so minute wave i were complete. The bounce then should have been assumed to be minute ii.
Trends don’t move in straight lines. Bounces in a downwards trend are an opportunity to join the trend.
The target remains the same. I’m still expecting intermediate (2) to be relatively long lasting, I’m not expecting at this stage that the pullback is over. Far from it.
There is a lot of reflexive buying of the metals and miners on any dip and It is causing a lot of confusion about the trend. I am assuming down
Metals are amazingly resilient. USD/Yen is breaking a downtrend line (green cirlce) and momentum indicators are rising. This is bearish gold…but gold is hanging tough and not falling much. What fundamentally is this telling us? For some reason, there is demand for gold.
Yep! Quite a bit of capital flowing into the metals complex. The last time we saw these spikes down being aggressively bought price took off so I am watching things closely. Silver heading back toward today’s high so the second wave for Gold could also continue higher…
Gold is printing a doji with a very long upper wick so far, almost a Gravestone doji on the daily chart.
That’s very bearish.
Buying to open TLT March 17 119 strike puts, limit 1.50 per contract, offered at 1.79.
Will wait for bounce…
TLT will soon breach 119.00 on close. Time to short bonds. I will try to get positioned on any bounce via TBT March 17 expiration 41 strike calls for 0.90 or better.
A more conservative trade is the 35/38 bullish put spread.
I just bought TBT today.
That should be a safe long terrm trade. TLT starting a fifth wave down.
That was interesting! Quite a tug- of- war ongoing it would seem….
Price action in Silver a cautionary note for the Gold count
I suspect the long lower wick yesterday was telling us the initial impulse down had completed. We are probably in a second wave.
The change in option prices vas also a clue.
Exactly.
Gold is showing more strength than expected. It has invalidated both of Lara’s hourly counts.
This is a possible idea. I still think it has more down to go when this move up is done.
https://www.tradingview.com/x/sJsJaw9i/
Lara wrote that “While minuette wave (v) is unfolding, the correction for micro wave 4 may not move into micro wave 1 price territory above 1,228.73. If this invalidation point is breached before the structure of minuette wave (v) looks complete, then my labelling within minuette wave (v) would be wrong; it is possible it may be over at today’s low.” (sic)
I take it to mean that her count in yesterday’s comments is correct. She made a similar comment regarding the alternate. I reckon that for Main, Minute 2 ought to complete at the 0.618 retrace, 1235.09.
Do you guys see this taking another segment up from its current drop prior to dropping? I’ve seen fed news act as a catalyst in some instances, but other times, it just dictates a spike…and the trend continues….
Exactly. Thanks Alan.
Really, I should have posted a chart of the idea in this analysis. That would have been easier.
Fed Chair Janet Yellen speaks to Congress Feb 14/15. Never know when something she says can move the Markets.
It is looking very much like the counter trend bounce in bond prices is over. If that is true, the alpha dog of financial markets, namely, the interest rate, is about to start growling. Yellen and the other banksters are going to have to fall in line…
Goodness, I sure hope so Verne. Been waiting for that literally for years now!
The overbought overextended markets need a big wash out. And the NZ property market is one of the most over inflated of bubbles I’ve seen in a while.
The Financial Tap explains the $Gold:$Silver ratio here:
http://thefinancialtap.com/2017/02/gold-silver-ratio/?utm_campaign=thefinancialtap&utm_content=A+Public+Post+for+you.&utm_medium=email&utm_source=getresponse
GDX appears to have a clear “5” down for Minute wave a to start the correction, although downwards movement is progressing slowly so far. That may change. As soon as Minute wave b is complete, GDX may move down quickly for Minute wave c.
Tomorrow GDX may see an AM bounce at the open, then hard down for the rest of the day. Let’s see how this plays out. It’s possible that the correction is over in another 2 or 5 days.
Chart link. Same as chart shown:
https://www.tradingview.com/x/q6pjqLZL/
Thanks Dreamer 🙂
I agree the move down will be sharp and conclude swiftly.