
Upwards movement for the main Elliott wave hourly chart was expected to reach a target at 1,240.
Price moved higher as expected to reach 1,241.99.
Summary: The target for a deep pullback is at 1,148. Corrections along the way down present opportunities to join the trend. A very deep second wave correction may have ended today. This is more likely than the alternate scenario, which today sees Gold in a third wave up at two degrees.
One approach to managing the main and alternate wave counts today may be to assume the main wave count is correct, so to assume a short position with a stop just above the invalidation point at 1,244.89. If this price point is breached, assume the alternate is correct and be prepared to quickly switch from bull to bear.
Follow my two Golden Rules of risk management:
1. Always use a stop.
2. Invest no more than 1-5% of equity on any one trade.
New updates to this analysis are in bold.
Last monthly and weekly charts are here. Last historic analysis video is here.
Grand SuperCycle analysis is here.
MAIN ELLIOTT WAVE COUNT
DAILY CHART
Click chart to enlarge.
There is an alternate wave count that differs at the weekly and monthly chart level. At the daily chart level, the alternate also expects overall more upwards movement, but it will not be published daily while it does not diverge from this main wave count. See historic analysis linked to above.
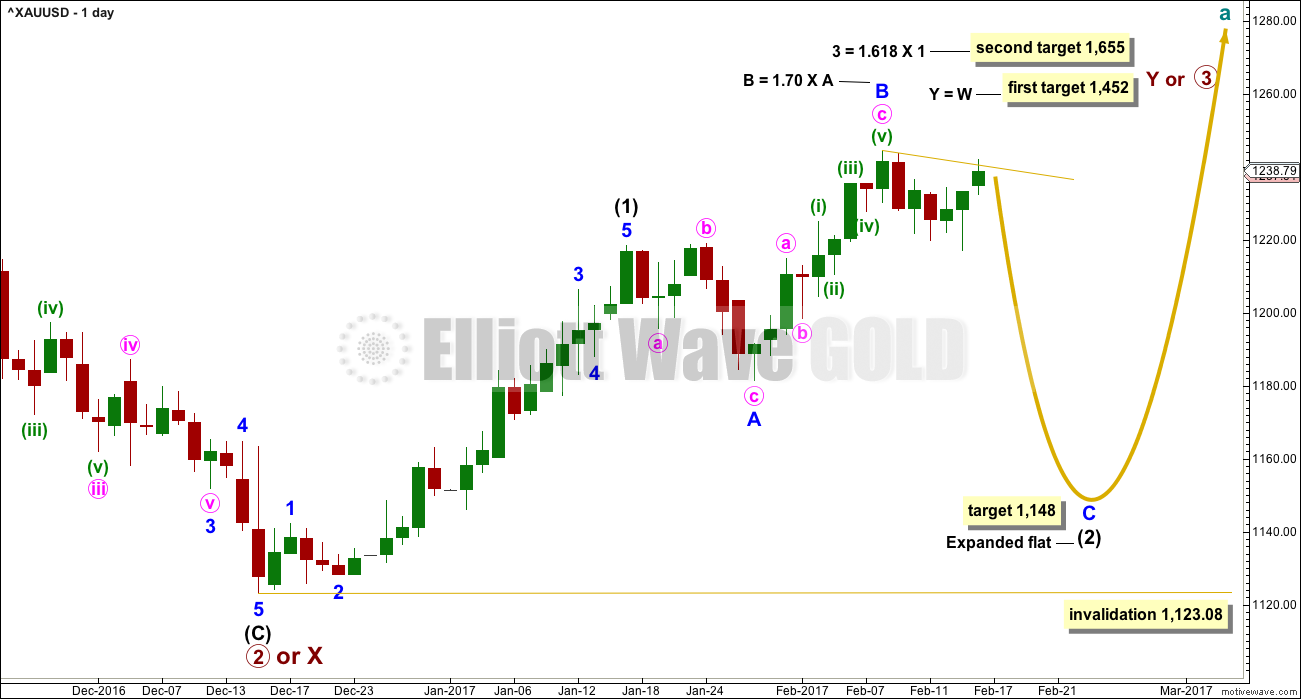
This main wave count expects Gold has had a primary degree trend change in December 2016. The new upwards wave is either a primary degree third wave, or a primary degree zigzag to complete a double zigzag.
Intermediate wave (1) is an impulse that may have lasted 23 days, two longer than a Fibonacci 21. Intermediate wave (2) may be unfolding as a very common expanded flat correction.
Within intermediate wave (2), minor wave A fits best as a regular flat and minor wave B is a zigzag. Minor wave B is longer than the common length of 1 to 1.38 times A, but within the allowable convention of up to two times the length of A.
The appropriate target for minor wave C is 2.618 the length of minor wave A.
So far intermediate wave (2) has lasted 22 sessions. Minor waves A and B have lasted a Fibonacci eight sessions each. If intermediate wave (2) exhibits a Fibonacci duration, it may be a total 34 sessions.
Alternatively, intermediate wave (2) may not exhibit a Fibonacci duration.
The alternate daily and hourly charts below will look at the possibility that intermediate wave (2) is not continuing, that it may have been over already.
HOURLY CHART
Click chart to enlarge.
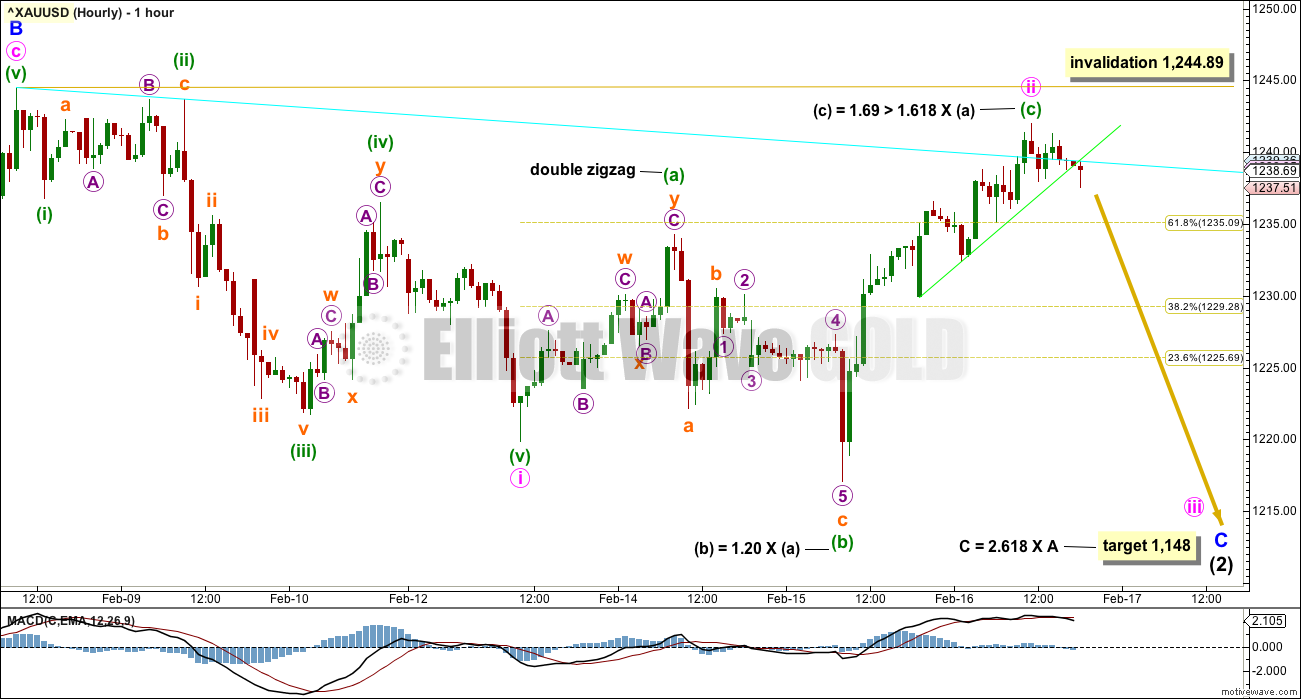
Minute wave ii should now be a complete expanded flat correction.
In a new wave, Gold often exhibits a very deep second wave correction for the very first in a series. Minute wave ii here is 0.90 the depth of minute wave i and this is fairly common for an early second wave correction.
The invalidation point is now very close by. If minute wave ii continues any higher, it may not move beyond the start of minute wave i above 1,244.89. If this wave count is invalidated within the next 24 hours, then members would be advised to be flexible and switch over immediately to using the alternate. The alternate would be considered confirmed.
At its end, minuette wave (c) now exhibits a typical Fibonacci ratio to minuette wave (a). Expanded flats and deep second waves are common scenarios.
A support line is drawn about minuette wave (c) in green. This is now breached. This breach may be the earliest indication that minute wave ii is over.
Price may now find resistance at the cyan trend line along the way down.
The prior upwards wave labelled minor wave B can be seen as a zigzag for this main wave count. The subdivision has a much better fit for this idea increasing the probability of this main wave count over the alternate below. To see the subdivision within minor wave B see analysis from the 9th of February.
ALTERNATE ELLIOTT WAVE COUNT
DAILY CHART
Click chart to enlarge.
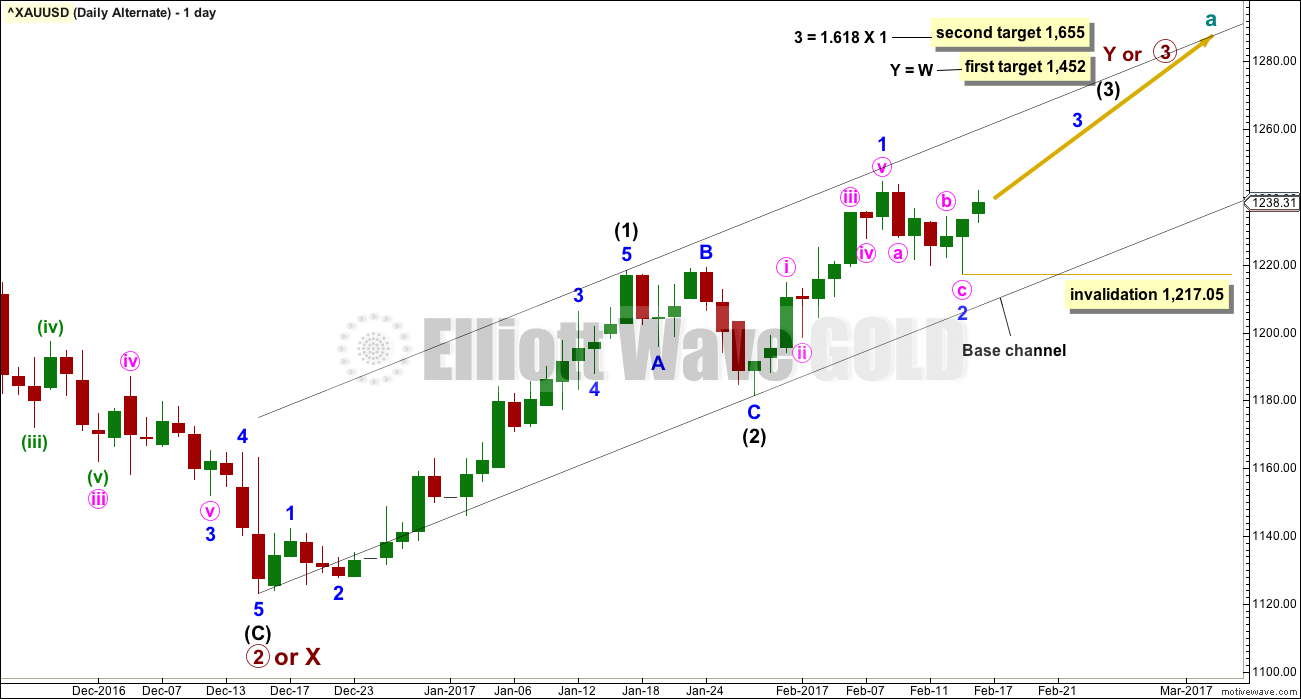
This alternate wave count today is an alternate idea to the main wave count. What if intermediate wave (2) was over as a brief shallow regular flat correction? It would have lasted just 8 days compared to intermediate wave (1) at 23 days. It would have been only 0.388 the depth of intermediate wave (1) and this is more shallow than normal for an intermediate degree second wave.
The black channel is a base channel about intermediate waves (1) and (2). Along the way up, lower degree second wave corrections should find support at the lower edge of the base channel. For this reason minor wave 2 looks most likely to be over now.
Within minor wave 3, no second wave correction may move beyond the start of its first wave below 1,217.05.
Minor wave 2 would have lasted a Fibonacci five sessions compared to minor wave 1 at a Fibonacci eight sessions. This proportion looks right.
This alternate wave count expects that the last two days of upwards movement has been the first two days of minor wave 3 within intermediate wave (3).
HOURLY CHART
Click chart to enlarge.
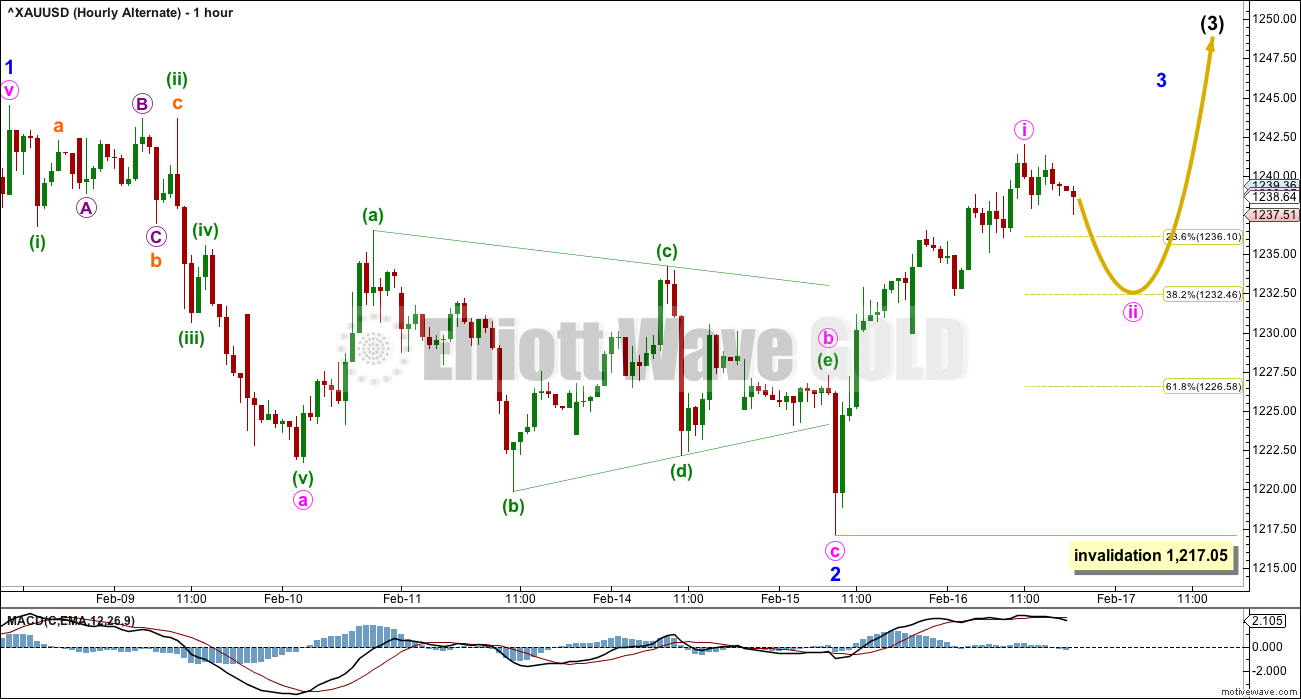
Minor wave 2 will subdivide as a three wave zigzag with a running contracting triangle for minute wave b.
Within the triangle, the final wave of minuette wave (e) falls well short of the (a)-(c) trend line and this does not look right. However, all Elliott wave rules are met.
Minute wave ii should now be a more shallow correction as the power of a big third wave winds up. For this reason the 0.382 Fibonacci ratio would be favoured, but the 0.618 Fibonacci ratio is still possible as a target.
Minute wave ii may not move beyond the start of minute wave i below 1,217.05.
Within minor wave 1 upwards, the structure must be seen as as five wave impulse. This can fit but requires a very rare running flat with a substantially truncated C wave. To see the subdivisions as an impulse for minor wave 1 see hourly charts in analysis for the 9th of February.
TECHNICAL ANALYSIS
WEEKLY CHART
Click chart to enlarge. Chart courtesy of StockCharts.com.
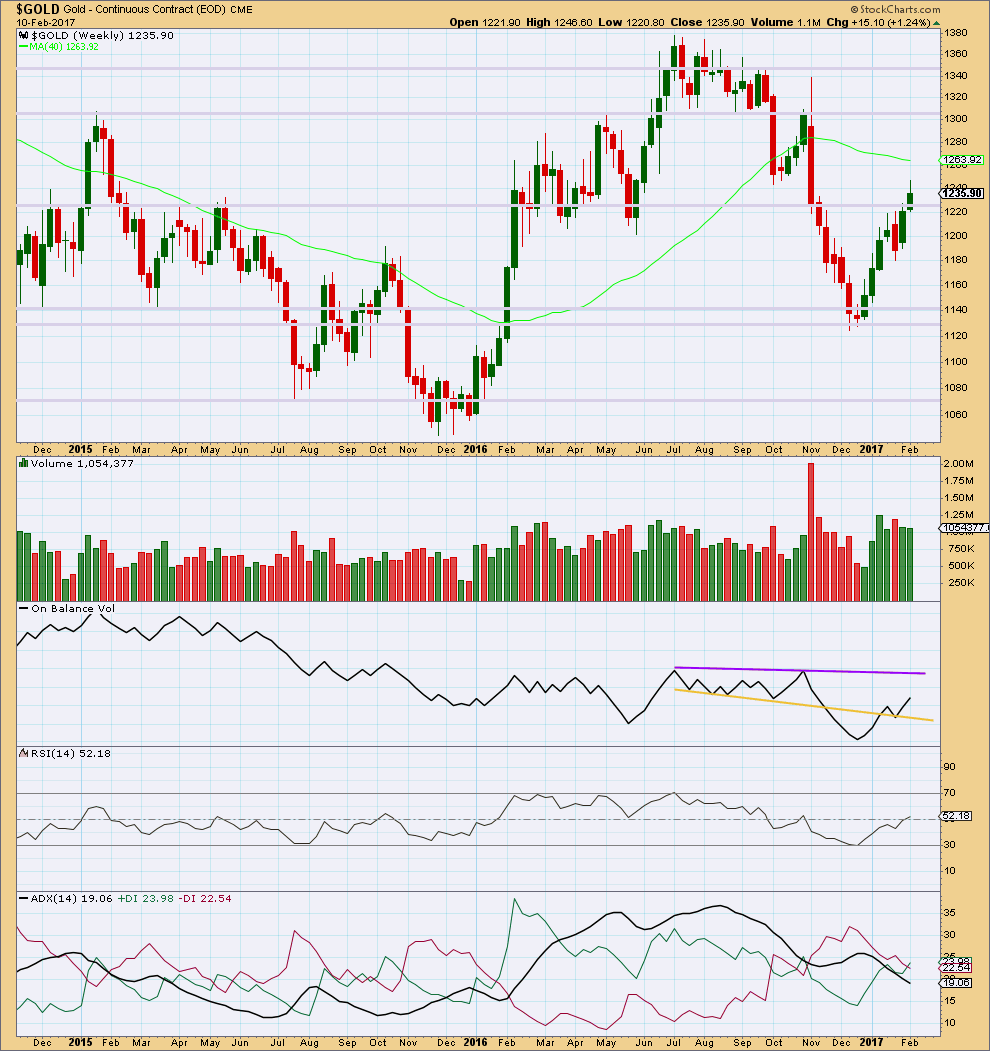
The long upper wick and smaller real body on last week’s candlestick is slightly bearish. The decline in volume is also bearish.
The strongest weekly volume in recent weeks is a downwards week, and this too is bearish.
On Balance Volume is some distance away from resistance.
ADX continues to decline indicating no clear trend.
DAILY CHART
Click chart to enlarge. Chart courtesy of StockCharts.com.
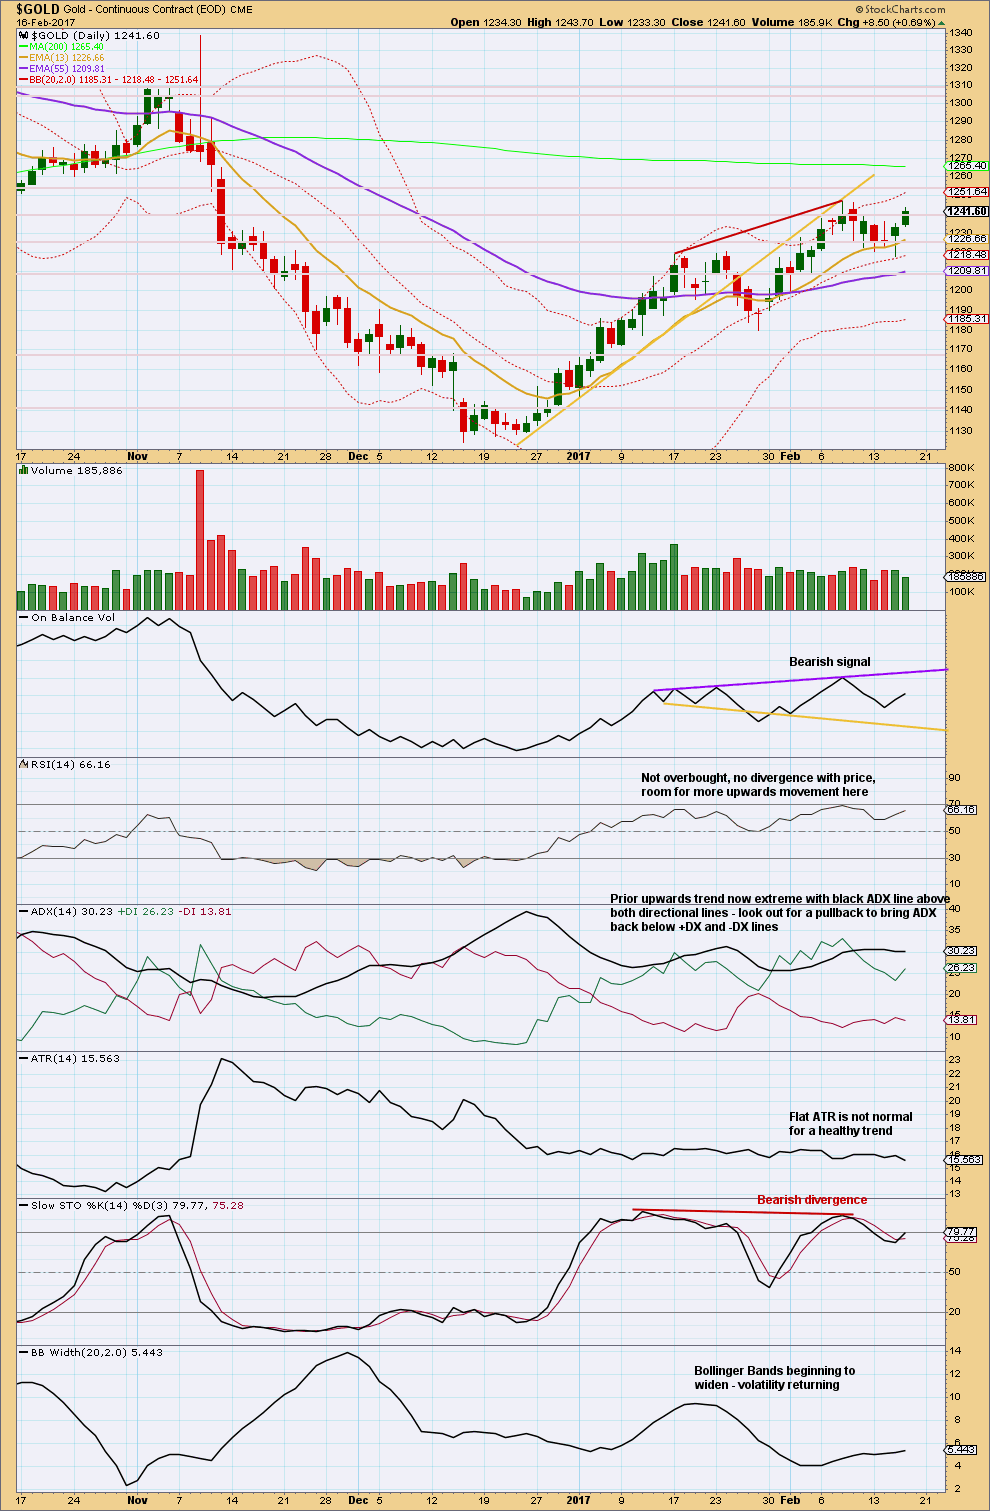
Yesterday saw a balance of volume during the session upwards and a decline in volume from the prior downwards session. Yesterday, there was no support from volume for upwards movement and today another upwards day sees a further decline in volume. This supports the main Elliott wave count and does not support the alternate Elliott wave count.
On Balance Volume is still bearish.
ADX is still extreme.
Price is now range bound with resistance about 1,245 and support about 1,215 to 1,210. During this period, it is the downwards day of the 9th of February that has strongest volume suggesting a downwards breakout may be more likely than upwards.
GDX
DAILY CHART
Click chart to enlarge. Chart courtesy of StockCharts.com.
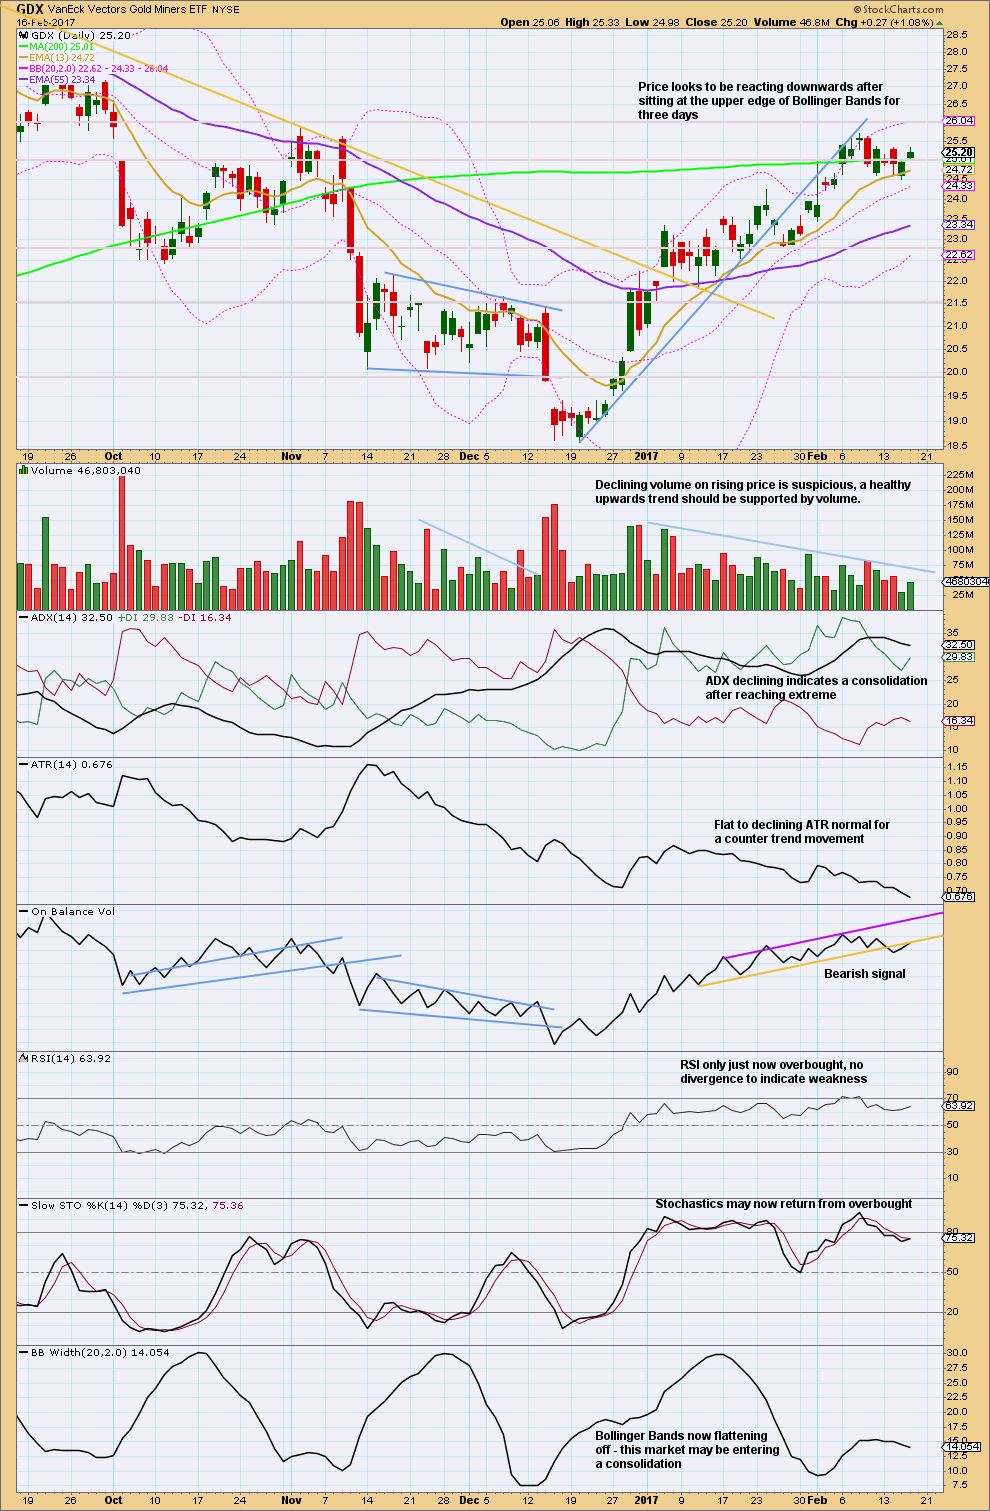
On Balance Volume still provides resistance, and a back test may still be unfolding here.
Price is range bound with resistance about 25.70 to 26.00 and support about 24.50. During this small range, it is the downwards day of the 9th of February that has strongest volume suggesting a downwards breakout may be more likely.
A small range upwards day today shows an increase in volume. This is bullish for GDX short term. Look for possibly a continuation of an upwards swing to resistance.
Overall, this chart remains more bearish than bullish.
This analysis is published @ 07:57 p.m. EST.
GLD printed a bearish engulfing candle by the close. It looks like we will be getting that long-awaited correction after all….have a great week-end everyone!
You too Verne and everyone else.
It’s been a long week and thankfully I was working most of it!
Tried to stay connected, but it was a big challenge.
Cheers!
I would not be at all surprised if this move down into the close results in a violent reversal in futures over the weekend. It is really way too convenient that this move is happening so close to the end of the trading session….hmmnnn…..
This looks more like a second wave to me.
Why hello Mr Third Wave, nice of you to finally join us *taps watch*
Be careful; this could be a very nasty bear trap….
Looking at what is happening with SPX, it could well be that this move down in Gold is going to be very brief indeed if the inverse correlation continues to hold. I am holding onto my calls for the time being….
I will be going out today to do my volunteer work with Marunui Conservation, resetting trap lines in a Kiwi zone to protect Kiwi 🙂 Awesome, bush crashing for about 5 hours…
Analysis for end of week will be done either this evening my time or tomorrow morning. Published by late Saturday evening EST.
Alternate hourly updated:
Minute i fits a little better. Minute ii may be expected to move a bit lower to the 0.382 Fibonacci ratio.
The main wave count remains valid while price has not made a new high above 1,244.89. It has fallen short (BarChart data) by 1.4 so far.
Second waves can be very deep. This still looks more likely to be a second wave than it does to be a third wave up at two degrees.
The green line was too steep, it’s redrawn. Price is again breaking below the line. If this count is right then this has to be it for Gold, there’s almost no room left for minute ii to move so now it should be over.
Gidyap! Little Gold Pony! Get a move on thar’…. 🙂
That’s all well and good Lara, but how do you explain what John’s dog said?
Woof! 🙂
It seems to me we have neither an impulsive third up nor down, and are therefoore still in some kind of correction. Frustrating, but it is what it is….
The main count does expect this is still minute ii.
And second waves can be very deep indeed.
So the count was not invalidated by the very minor poke over 1244.89? Which seems very reasonable but some of the EW rules are absolute like 4 can’t go into wave 1.
US dollar making a H&S top? Neckline right on a Composite Low Volume Node (CLVN) which often marks lines of support and resistance as it is a low traded price. If neckline breaks, it measures to 94.6.
Red dashed line is the highs from March, 2015, if this area fails, this last run to 103.8 could be a false upside break and could mark the rally over.
This move down is a bit different from the last three, which were sharp and quickly reversed. We now have stair stepping…
I think if 1238 breaks down, it looks like a freewheel down to 1230. Then the ‘double top’ theories really will abound!
Lara said the main wave count gets invalidated on a move over 1244.89, Think or Swim data shows it hit 1245.1 at 7:06 am est. So her recommendation was to close shorts and go long. But now gold is pulling back. Not sure what to do…long DUST.
Kitco shows a high of $1,244.60 – Lara’ main count is still valid.
BarChart data has not invalidated the wave count. That’s the data I’m using.
3rd wave down?
We should know within the hour…
I think we all agree it is going higher, the pertinent question is WHEN…. 😉
Fascinating how traders and/or bots continue to agressively short volatility. Absolutely no one thinks volatlity is going higher. While Gold makes up my mind, I will continue to scalp volatlity during this SPX correction by buying the dips and selling the rips! Works great on options expiration, even with laughable spreads.
My GLD calls are not doing much and frankly that is a big red flag. Win or loose, they get unloaded at the close.
Probably your significant other said to you, “Dear, I’m going to the mall to buy a few things. Bye bye, I’ve got to go”. Whilst engrossed with your charts on the computer, all you heard was “bye” and “go”.
By Golly! I think you’re right on the money!
Your dogs name isn’t Sam is it?
Good luck with that, I’ve certainly heard of worse trading strategies!
Lara’s : “The alternate daily and hourly charts below will look at the possibility that intermediate wave (2) is not continuing, that it may have been over already.”
I believe it is correct. Int wave 2 is over at low 1123.
Gold is at resistance 1241. Plus gold has broken the water fall down trend line.
Also is some one can draw a parabola from July 2016 top to bottom 1123 one can see that price has broken above the down parabola line.
No EW count here. I am still learning from Lara and every one here.
Lara: In EWP book on page 193 and 194 there is equivalent wave count for TA analysis Head and Shoulder pattern.
For an inverse HnS pattern one must be there also?
Since Dec 2016 bottom gold has been forming multiple mini HnS in 1 hour periods on top of each other.
Again right now in 1 hour period another HnS has formed.
Is there an equivalent wave count in lower degree for these inverse HnSs????
I see a breakout in G/S coming soon.
Thanks for your excellent work.
An inverse head and shoulders would be:
LH shoulder the end of a third wave down.
Head the end of a fifth wave down.
RH shoulder the end of a second wave correction within a new impulse up.
Exactly the same but opposite to the regular H&S
Lara
Sorry if this has already been mentioned and I missed it but I was wondering whether you have a timeframe approximation for the two longer term targets of 1452 and 1655?
TIA
Big bet on GLD by December
http://www.bottarelliresearch.com/free/2017/02/16/2017-year-gold
Those “Sharp Paper” alerts from Bryan are fascinating. They more often than not are big winners…
In your summary on top: ” If this price point is breached, assume the alternate is correct and be prepared to quickly switch from bull to bear.” – You mean quickly switch from bear to bull, right?
So sorry, yes. From bear to bull.
For what it’s worth, American Bulls issued BUY signals on GDX, GDXJ, & GLD today. SLV was a BUY as of yesterday.
Yes, their algorithm does sometimes get whipsawed, so something to watch for.
Algos are becoming increasingly prevalent across all kinds of markets. Many of them are programmed to buy a certain standard deviation from the mean and I think that is why we are seeing these sharp and erratic moves in more and more instruments. It is the main reason I switched from trying to swing trade the market to being a scalper. This kind of activity is now even starting to show up in volatility instruments such as SVXY which is today sporting a very long lower shadow, and had a very wide trading range . Exiting that trade at the low of the day, as opposed to staying in the trade made an order of magnitude difference in the trade’s profitability, as incredible as that sounds! You can really beat the algos by paying attention to when they are buying dips against the trend, and they did exactly that with volatility today. Even though these programs are designed by very bright people, they are too stupid to recognize a big standard deviation that is also accompanied by a trend change, and that is when you can really take them to the cleaners. They are making that blunder with volatility as we speak. When they buy the spikes after a trend change they are handing you free money. I re-loaded SVXY after this plunge was bought up by the machines (and those traders who think volatility has forever died!). When these algos start trading the coming bear market it is going to be, I am afraid, a very frightful affair. The waves are going to be deep, long and sustained, and will absolutely bury the banksters in their own hubris. You are not going to believe what you are seeing when this thing gets going to the downside. ‘Nuff said!
Lara, just curious why you wouldn’t label wave e of the triangle for the hourly alternate as shown? “e” then ends closer to the A-C trend line and you can see the subdivisions for Minute wave c. Thanks
I know, that would resolve (partly) the problem of the shortfall wouldn’t it.
But it’s a judgement call. It just wouldn’t look right.
Because when triangles are over price normally reverses and moves out of the triangle quite quickly. If the triangle is labelled over earlier then the reversal below the b-d trend line just too far too long.
OK. Thanks