
Price moved higher for Friday’s session, which was not expected but was allowed for. Price remains below the invalidation point on the main hourly Elliott wave count.
This week volume and ATR are giving some clues as to what the upwards movement for the last three days most likely means.
Summary: The target for a deep pullback is at 1,148. Corrections along the way down present opportunities to join the trend. A very deep second wave correction may have ended. This is more likely than the alternate scenario, which today sees Gold in a third wave up at two degrees. At the end of this week, classic technical analysis is more bearish than bullish.
One approach to managing the main and alternate wave counts today may be to assume the main wave count is correct, so to assume a short position with a stop just above the invalidation point at 1,244.89. If this price point is breached, assume the alternate is correct and be prepared to quickly switch from bear to bull.
Follow my two Golden Rules of risk management:
1. Always use a stop.
2. Invest no more than 1-5% of equity on any one trade.
New updates to this analysis are in bold.
Last monthly and weekly charts are here. Last historic analysis video is here.
Grand SuperCycle analysis is here.
MAIN ELLIOTT WAVE COUNT
DAILY CHART
Click chart to enlarge.
There is an alternate wave count that differs at the weekly and monthly chart level. At the daily chart level, the alternate also expects overall more upwards movement, but it will not be published daily while it does not diverge from this main wave count. See historic analysis linked to above.
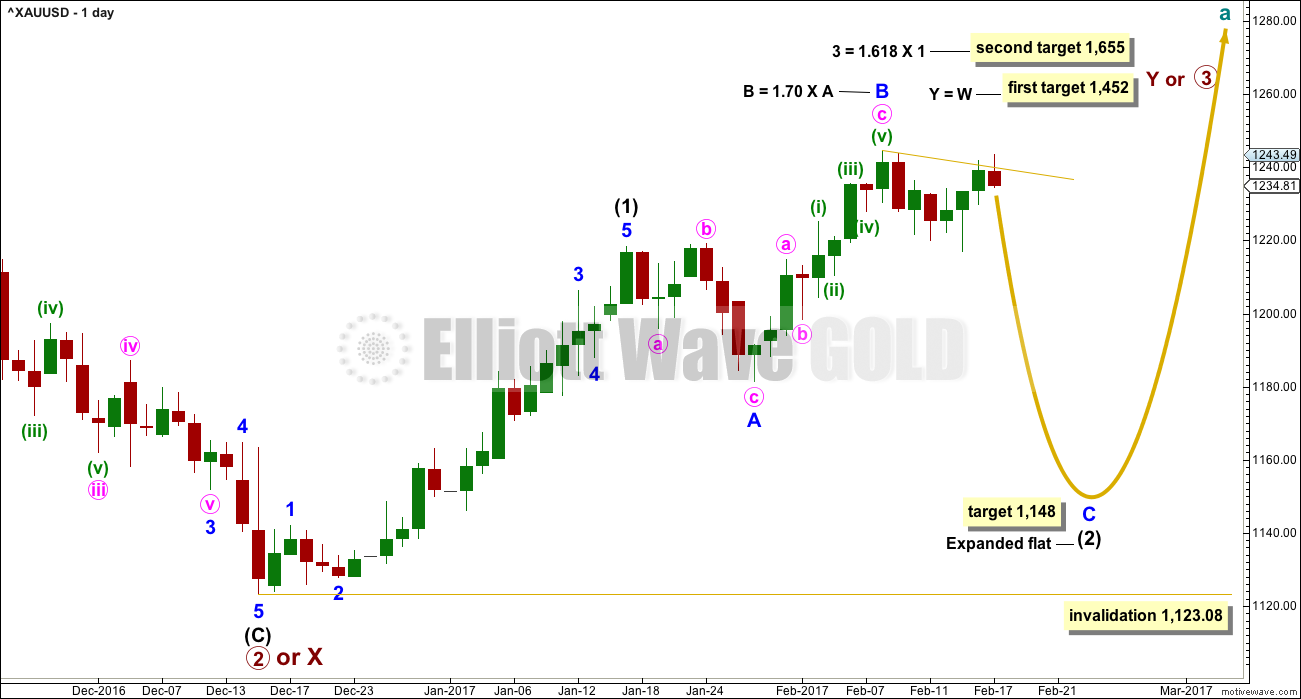
This main wave count expects Gold has had a primary degree trend change in December 2016. The new upwards wave is either a primary degree third wave, or a primary degree zigzag to complete a double zigzag.
Intermediate wave (1) is an impulse that lasted 23 days, two longer than a Fibonacci 21. Intermediate wave (2) may be unfolding as a very common expanded flat correction.
Within intermediate wave (2), minor wave A fits best as a regular flat and minor wave B is a zigzag. Minor wave B is longer than the common length of 1 to 1.38 times A, but within the allowable convention of up to two times the length of A.
The appropriate target for minor wave C is 2.618 the length of minor wave A.
So far intermediate wave (2) has lasted 23 sessions. Minor waves A and B have lasted a Fibonacci eight sessions each. If intermediate wave (2) exhibits a Fibonacci duration, it may be a total 34 sessions.
Alternatively, intermediate wave (2) may not exhibit a Fibonacci duration.
The alternate daily and hourly charts below will look at the possibility that intermediate wave (2) is not continuing, that it may have been over already.
The longer term targets for primary waves 3 or Y may be met in a total Fibonacci 34 weeks from their start. So far this upwards trend has lasted nine weeks.
HOURLY CHART
Click chart to enlarge.
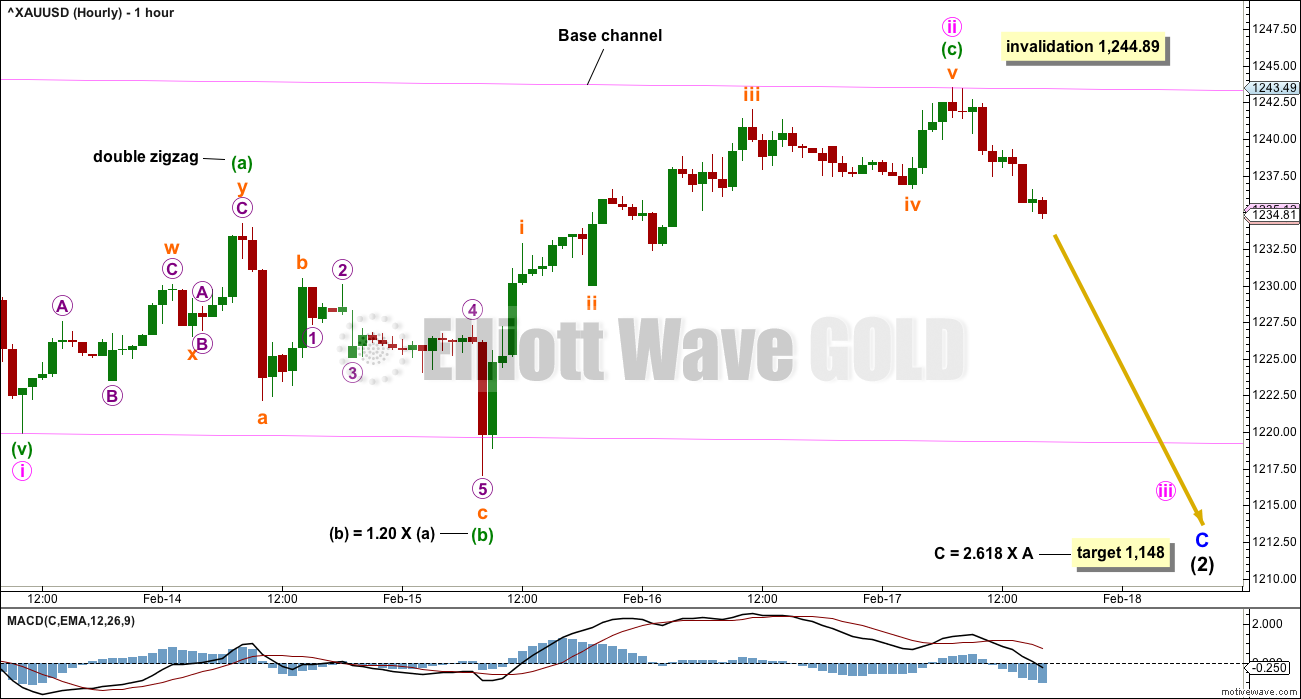
Again, minute wave ii should now be a complete expanded flat correction. There is almost no room left for it to move into. At this stage. it is a very deep 0.96 correction of minute wave i.
With the new high during Friday’s session, the structure of minuette wave (c) now has a slightly better fit. The new swing low below the end of subminuette wave iv offers just a little confidence in a trend change.
In a new wave, Gold often exhibits a very deep second wave correction for the very first in a series.
The invalidation point is now very close by. If minute wave ii continues any higher, it may not move beyond the start of minute wave i above 1,244.89. If this wave count is invalidated within the next 24 hours, then members would be advised to be flexible and switch over immediately to using the alternate. The alternate would be considered confirmed.
At its end, minuette wave (c) no longer exhibits a Fibonacci ratio to minuette wave (a). Expanded flats and deep second waves are common scenarios.
A base channel is drawn about minute waves i and ii in pink. Along the way down, upward corrections should now find resistance at the upper edge of the channel. A breach of the lower edge would provide confidence that a third wave down is underway.
Price may now find resistance at the cyan trend line along the way down.
The prior upwards wave labelled minor wave B can be seen as a zigzag for this main wave count. The subdivision has a much better fit for this idea increasing the probability of this main wave count over the alternate below. To see the subdivision within minor wave B see analysis from the 9th of February.
ALTERNATE ELLIOTT WAVE COUNT
DAILY CHART
Click chart to enlarge.
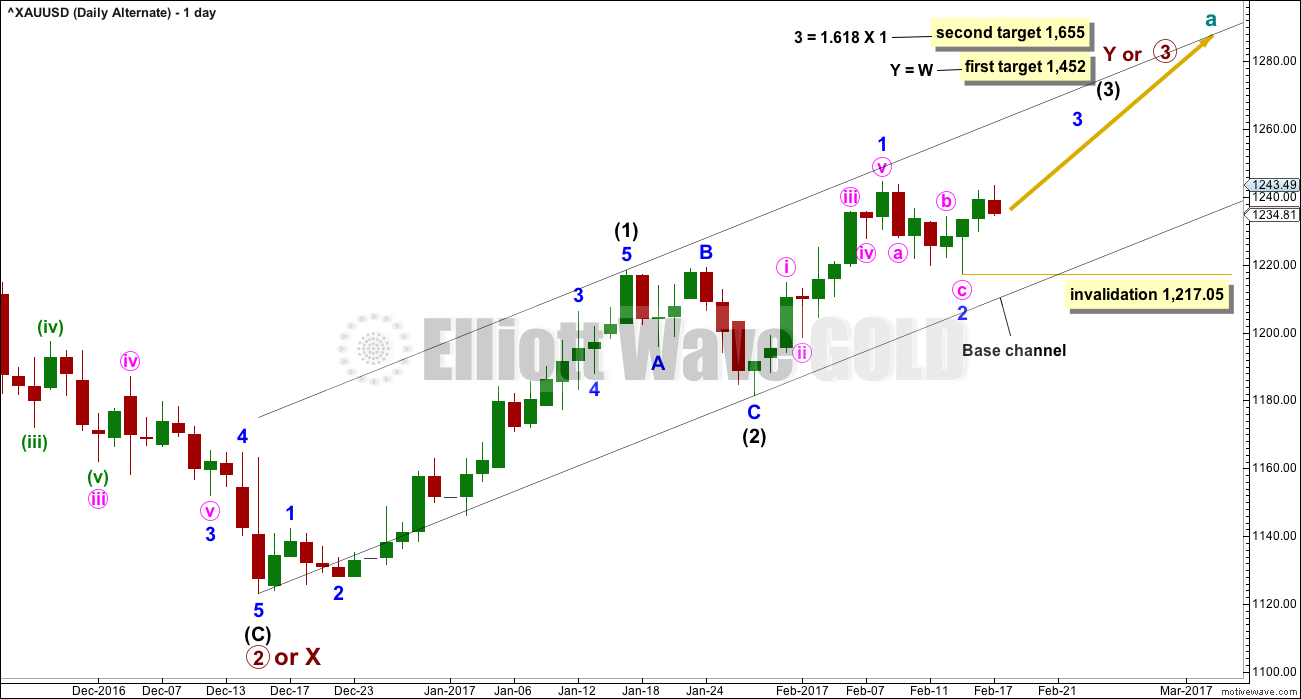
This alternate wave count is an alternate idea to the main wave count. What if intermediate wave (2) was over as a brief shallow regular flat correction? It would have lasted just 8 days compared to intermediate wave (1) at 23 days. It would have been only 0.388 the depth of intermediate wave (1) and this is more shallow than normal for an intermediate degree second wave.
The black channel is a base channel about intermediate waves (1) and (2). Along the way up, lower degree second wave corrections should find support at the lower edge of the base channel. For this reason minor wave 2 looks most likely to be over now.
Within minor wave 3, no second wave correction may move beyond the start of its first wave below 1,217.05.
Minor wave 2 would have lasted a Fibonacci five sessions compared to minor wave 1 at a Fibonacci eight sessions. This proportion looks right.
This alternate wave count expects that the last two days of upwards movement has been the first two days of minor wave 3 within intermediate wave (3). However, a third wave up at two degrees should begin with clear and strong upwards movement. The small range and red candlestick for Friday does not look convincing for this wave count. This problem could be overcome if Monday sees a very strong upwards day, but at this stage the probability of this wave count is reduced with the behaviour of price during Thursday and Friday.
HOURLY CHART
Click chart to enlarge.
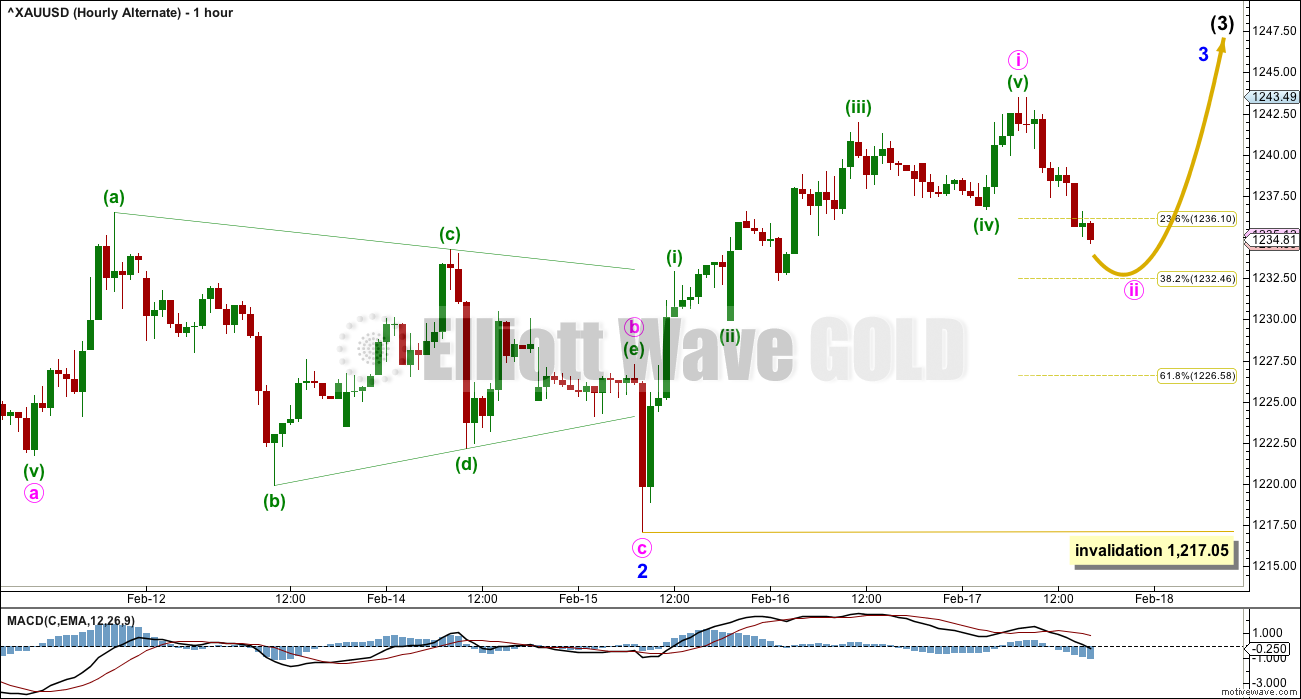
Minor wave 2 will subdivide as a three wave zigzag with a running contracting triangle for minute wave b.
Within the triangle, the final wave of minuette wave (e) falls well short of the (a)-(c) trend line and this does not look right. However, all Elliott wave rules are met.
Minute wave ii should now be a more shallow correction as the power of a big third wave winds up. For this reason the 0.382 Fibonacci ratio would be favoured, but the 0.618 Fibonacci ratio is still possible as a target.
Minute wave ii may not move beyond the start of minute wave i below 1,217.05.
Within minor wave 1 upwards, the structure must be seen as as five wave impulse. This can fit but requires a very rare running flat with a substantially truncated C wave. To see the subdivisions as an impulse for minor wave 1 see hourly charts in analysis for the 9th of February.
TECHNICAL ANALYSIS
WEEKLY CHART
Click chart to enlarge. Chart courtesy of StockCharts.com.
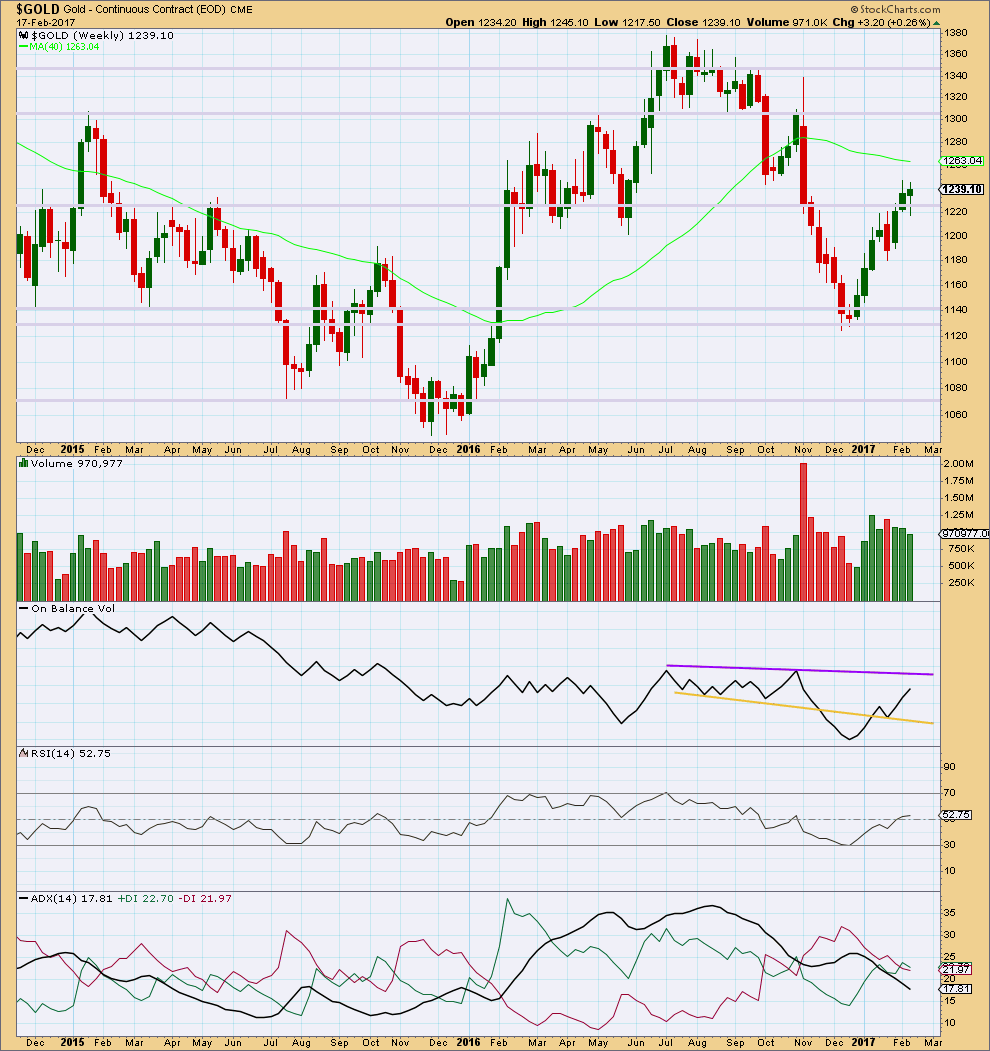
Price for this week made a lower high and lower low, the definition of downwards movement. However, the candlestick closed green and the balance of volume during the week was upwards. A decline in volume for upwards movement during the week is bearish. The long lower wick and green colour of the candlestick is bullish.
Resistance for On Balance Volume is some distance away as is support. The last break above resistance at the yellow line and backtest of support is bullish.
RSI is close to neutral. There is plenty of room for price to rise or fall here.
ADX is still declining after reaching extreme during the last upwards trend. The +DX and -DX lines have now crossed. If ADX turns up here, then an upwards trend would be indicated.
DAILY CHART
Click chart to enlarge. Chart courtesy of StockCharts.com.
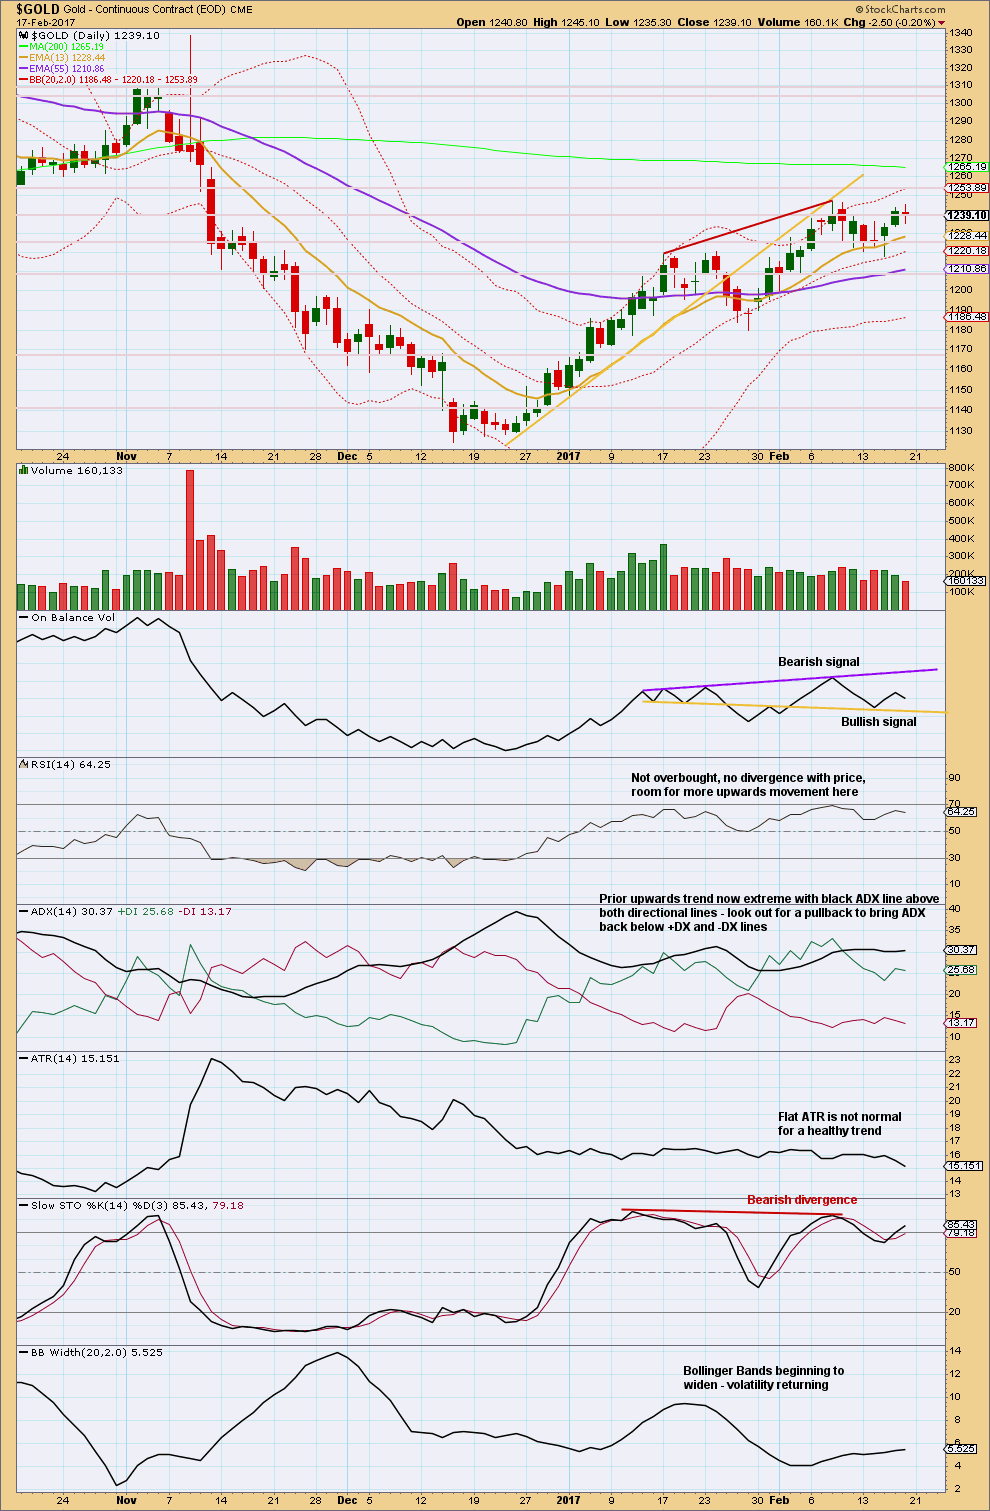
Friday saw a higher high and higher low, the definition of upwards movement. But the candlestick closed as a red doji, and the balance of volume was downwards. During the session a decline in volume did not support downwards movement.
Price has moved higher for the last three sessions on now declining volume. Overall, this supports the main wave count and not the alternate. Stronger green candlesticks for the alternate should be seen with increasing volume, but this is not happening.
Declining ATR for the last three days also supports the main wave count over the alternate. The start of a big third wave should see decisive upwards movement with increasing range. This is not happening.
On Balance Volume is still bearish.
ADX is still extreme.
Price is now range bound with resistance about 1,245 and support about 1,215 to 1,210. During this period, it is the downwards day of the 9th of February that has strongest volume suggesting a downwards breakout may be more likely than upwards.
GDX
DAILY CHART
Click chart to enlarge. Chart courtesy of StockCharts.com.
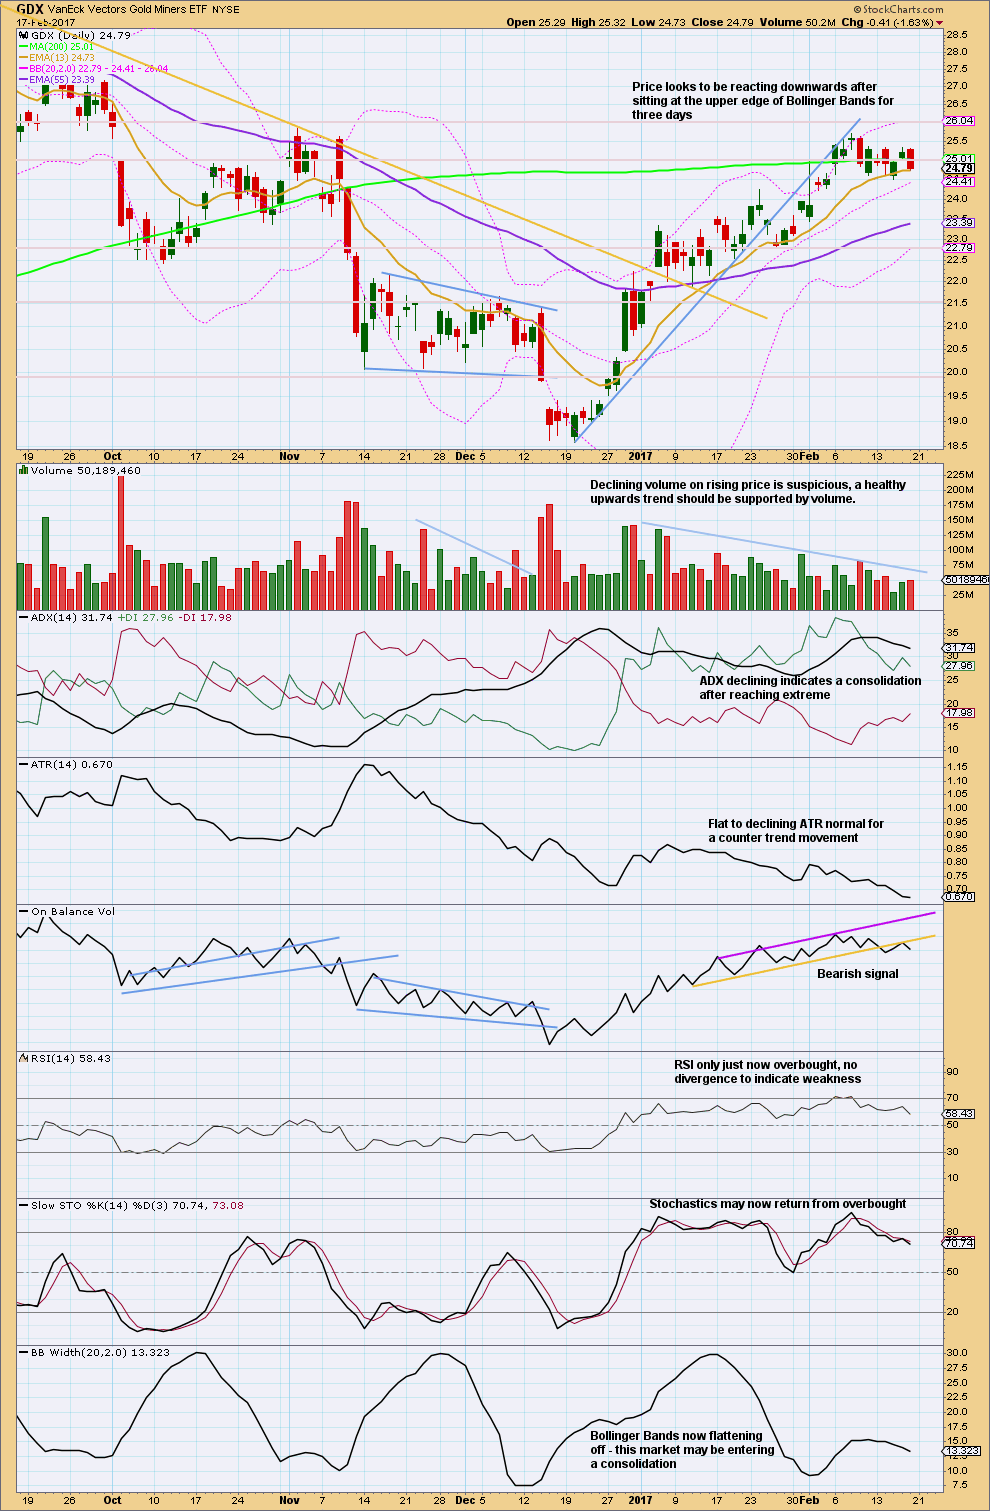
It looks increasingly like GDX has entered a consolidation. Resistance is about 25.70 and support is about 24.50. During the consolidation, so far it is the downwards day of the 9th of February that has strongest volume suggesting a downwards breakout may be more likely than upwards.
Some increase in volume for Friday’s downwards day offers a little further support for this view.
On Balance Volume offers another bearish signal for Friday. This supports a downwards breakout. Give this signal reasonable weight; it is often (not always) reliable.
This analysis is published @ 06:11 p.m. EST on 18th February, 2017.
Long GannGlobal free video sharing a lot of statistics. First 27 minutes on SPX and the balance about 26 minutes on Gold stocks and gold.
Highly recommended if you can find the time
http://www.gannglobal.com/webinar/2017/February/17-02-GGF-Webinar-Recording.php?inf_contact_key=d2c60ba901b1d4e5ceb0428b0f83167288af4a25dcd03ba119862257c65abe70
Alan:”It does look like another double top formed at 1244.49 / 1243.49, with the low point of 1217.05.”
Yes it is double top and it is a neckline also. The right shoulder of this another inverse HnS is at 1232 like Lara’s alt hour wave count suggests.
Correctly with Lara’s wave count if gold falls below 1217 currently the head of this HnS gold’s main wave count may get validated and this inverse HnS will be negated.
That’s what I see.
Nice change of scenery on the board. Very cool, so calming! IMO looks like a tough ask as yet to see Gold price break below 1233/1232 for 1226+; looking for a discount to stay long on this; ROC and momentum are bullish, upside move is likely….
Hi Lara…is there a way you can indicate, from your perspective, your assumption on the probability of the main count vs the alternate count on a regular basis? Rightfully so, the past few weeks have seen some unpredictable price actions and we saw growth in markets and gold on a lot of days… but as things become clearer (to some degree)…it’d be nice to understand clearer trends. “Guys, full breakout…Lara confidence level of 94″… or something. I’ve seen it a couple times… just wanting it more. W/ this potential downtrend forming, it’d be nice to know you think it’s a confirmed downtrend vs. consolidation. Thanks!
Okay, a good idea. I should make this a part of my daily analysis if there is an alternate.
At this stage I’d judge the main count to be about 75% likely, with the alternate about 25%.
Thanks Lara, that would be an extremely helpful addition to your daily analysis, though I’m sure it must be difficult to quantify a lot of the time.
It is. And TBH sometimes it’s just a bit of a guess, and I don’t like guessing. That’s why I don’t often do it.
If I have to do it every day then I’ll get used to giving it more careful thought.
Thanks, Lara…cool stuff, and thanks for being accommodating!!
Very good idea!
Lara: ” If this price point is breached, assume the alternate is correct and be prepared to quickly switch from bear to bull.”
If one looks at the Jan 9 report weekly chart it shows that gold broke down from a triangle weekly wave count and continued down. A valid bearish count.
Today’s alt hourly wave count shows gold broke down from triangle wave count and quickly turn around and is trading above the triangle. A failed break down. MAY be gold is ready for up trend in alternate count?
IMO!
Both the main and alternate daily counts here do expect Gold is in an upwards trend.
The difference is the main count expects a deeper pullback first.
It does look like another double top formed at 1244.49 / 1243.49, with the low point of 1217.05. The last time the double top formed at 1218.43 / 1219.11, prices dipped.
The expectation of the current drop will initially be 2*(1243.99 – 1217.05) = 53.88, towards 1243.49 – 53.88 = 1189.61. But, as the drop has to go below 1181.41 (Minor A) to avoid a truncation, Lara’s target of 1148 looks highly probable.
From a fundamental perspective, gold prices rose unexpectedly on Friday due to Yellen’s inconsistent testimony, hawkish on Wednesday but lacklustre on Thursday. Traders perceive the no follow-through as a sign of vacillation on her part. At the same time, the uncertainty of the outcome of the French elections in April would still bolster any strong drop. Traders would surely monitor this coming Wednesday’s Fed minutes to glean any indication of March’s Fed rate hike. The balance of power between the probable rate hike and the European chaos could be telling on the near future direction of gold.
It does appear that the thirty year bull market in bonds is over. If this is the case, the FED now has no choice but to follow the market. Yellen can yap dovishly all she wants. The big question is how higher rates will affect Gold and the dollar. Conventional wisdom on this score could be proven wrong….at least in the near term.