
Gold is still range bound.
Classic analysis, with a heavy reliance on volume analysis, is used to determine probability of the main versus alternate Elliott wave counts today.
Summary: Gold has now been range bound for nine sessions. Resistance is at 1,245 and support is at 1,220. A downwards breakout still looks more likely than upwards. If price breaks below 1,217.05, the target is at 1,148. If price breaks above 1,244.49, the target is at 1,452.
New updates to this analysis are in bold.
Last monthly and weekly charts are here. Last historic analysis video is here.
Grand SuperCycle analysis is here.
MAIN ELLIOTT WAVE COUNT
DAILY CHART
Click chart to enlarge.
There is an alternate wave count that differs at the weekly and monthly chart level. At the daily chart level, the alternate also expects overall more upwards movement, but it will not be published daily while it does not diverge from this main wave count. See historic analysis linked to above.
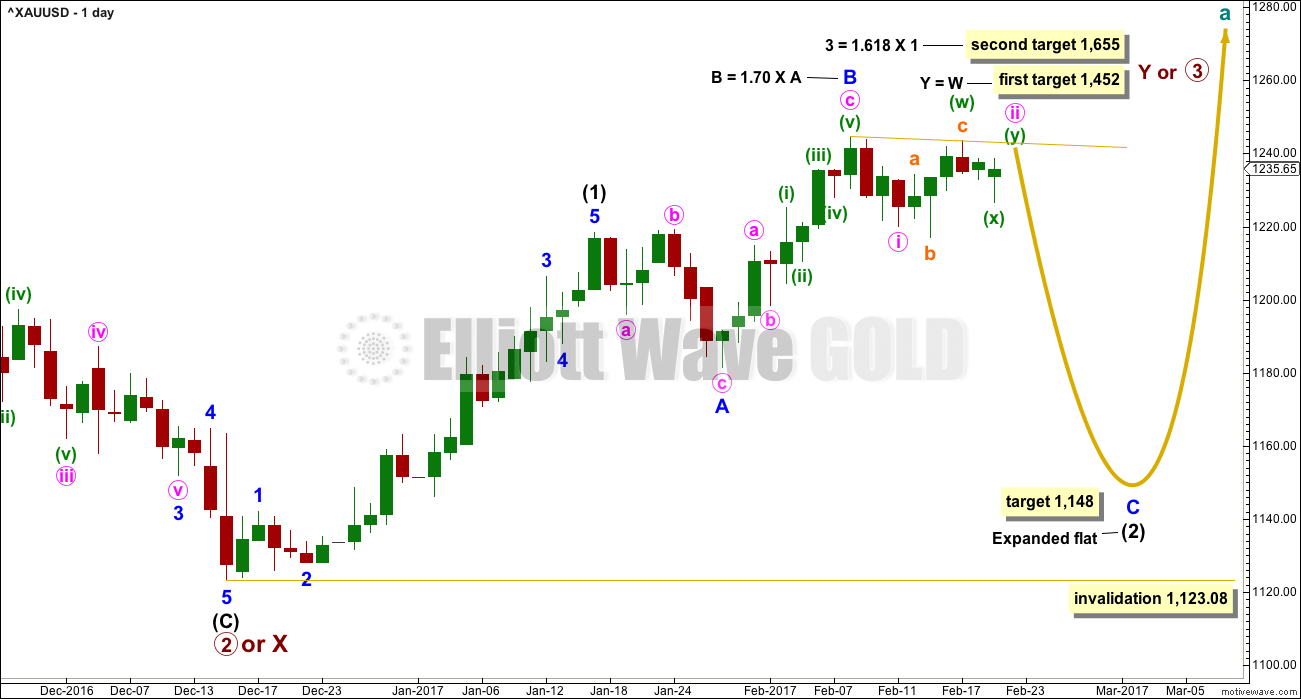
This main wave count expects Gold has had a primary degree trend change in December 2016. The new upwards wave is either a primary degree third wave, or a primary degree zigzag to complete a double zigzag.
Intermediate wave (1) is an impulse that lasted 23 days, two longer than a Fibonacci 21. Intermediate wave (2) may be unfolding as a very common expanded flat correction.
Within intermediate wave (2), minor wave A fits best as a regular flat and minor wave B is a zigzag. Minor wave B is longer than the common length of 1 to 1.38 times A, but within the allowable convention of up to two times the length of A.
The appropriate target for minor wave C is 2.618 the length of minor wave A.
So far intermediate wave (2) has lasted 25 sessions. Minor waves A and B have lasted a Fibonacci eight sessions each. If intermediate wave (2) exhibits a Fibonacci duration, it may be a total 34 sessions.
Alternatively, intermediate wave (2) may not exhibit a Fibonacci duration.
The alternate daily and hourly charts below will look at the possibility that intermediate wave (2) is not continuing, that it may have been over already.
The longer term targets for primary waves 3 or Y may be met in a total Fibonacci 34 weeks from their start. So far this upwards trend has lasted nine weeks.
It is my judgement today that this main wave count is about 65% likely.
HOURLY CHART
Click chart to enlarge.
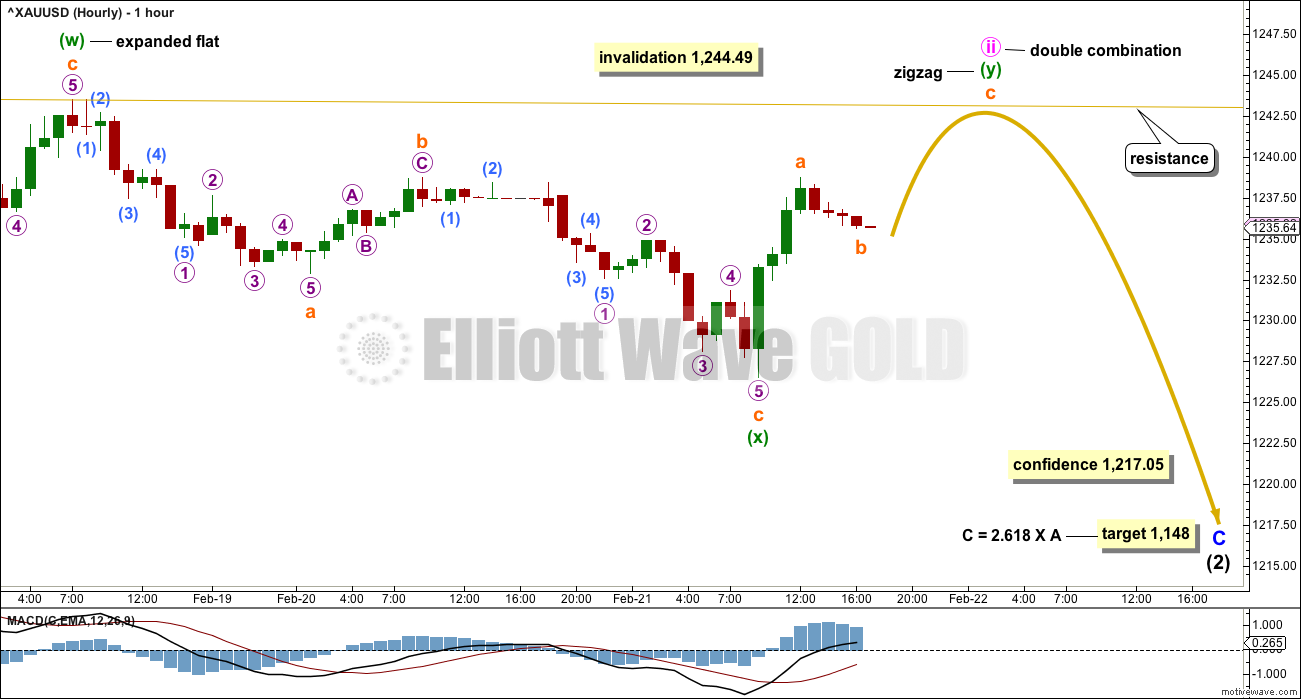
The last downwards wave now fits well and looks like a three, not a five. If minute wave ii was already over as an expanded flat as labelled in prior analysis, then this makes no sense.
However, it does make sense if minute wave ii is continuing sideways as a double combination: expanded flat – X – zigzag.
The zigzag of minuette wave (y) would most likely end close to the same level as minuette wave (w) at 1,243.49. The purpose of combinations is to take up time and move price sideways and to achieve this purpose the second structure normally ends close to the same point as the first.
This wave count expects that the last six sessions are part of a correction. This does have a slightly better fit with classic analysis below. If price is in a correction, then ADX and ATR agree.
When minute wave ii is complete, then this main wave count expects that a third wave down should begin. That has not happened yet. Minute wave iii must move beyond the end of minute wave i below 1,219.88.
A new low now below 1,217.05 would invalidate the alternate below at the hourly chart level and provide some confidence in this main wave count.
If this main wave count is invalidated with a new high above 1,244.49, then the alternate wave count below should be used.
The prior upwards wave labelled minor wave B can be seen as a zigzag for this main wave count. The subdivision has a much better fit for this idea increasing the probability of this main wave count over the alternate below. To see the subdivision within minor wave B see analysis from the 9th of February.
ALTERNATE ELLIOTT WAVE COUNT
DAILY CHART
Click chart to enlarge.
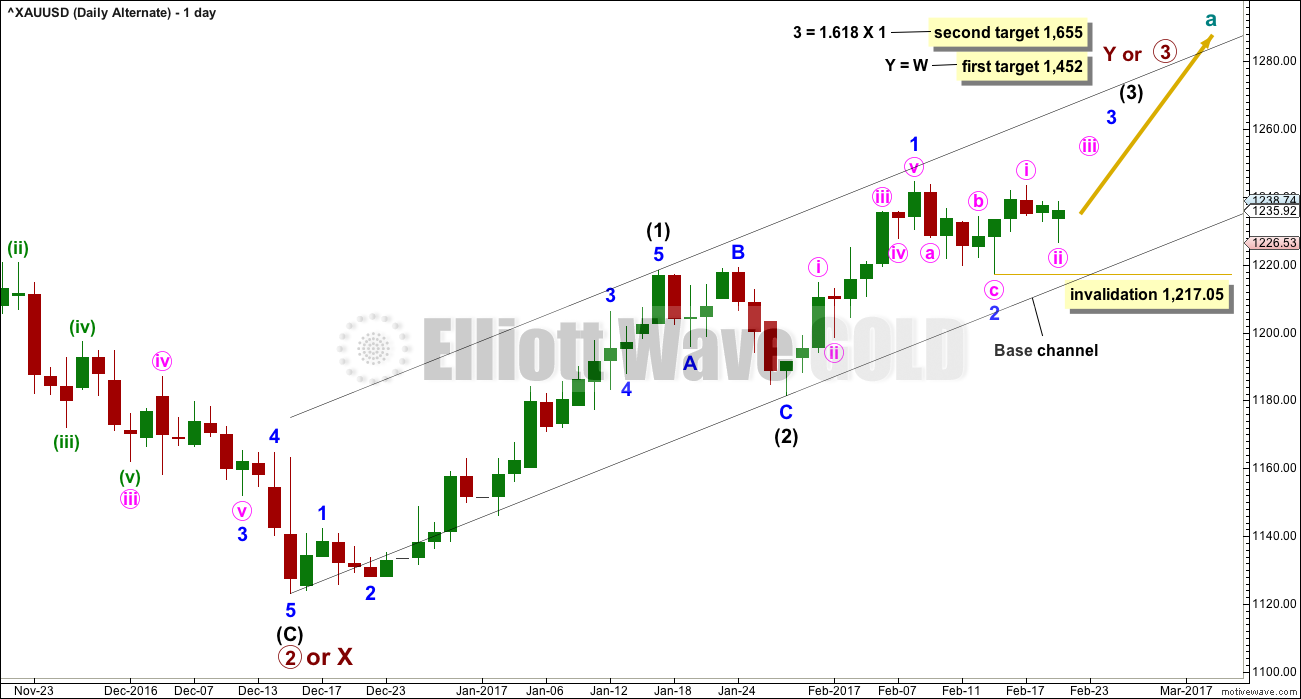
This alternate wave count is an alternate idea to the main wave count. What if intermediate wave (2) was over as a brief shallow regular flat correction? It would have lasted just 8 days compared to intermediate wave (1) at 23 days. It would have been only 0.388 the depth of intermediate wave (1) and this is more shallow than normal for an intermediate degree second wave.
The black channel is a base channel about intermediate waves (1) and (2). Along the way up, lower degree second wave corrections should find support at the lower edge of the base channel. For this reason minor wave 2 looks most likely to be over now.
Within minor wave 3, no second wave correction may move beyond the start of its first wave below 1,217.05.
Minor wave 2 would have lasted a Fibonacci five sessions compared to minor wave 1 at a Fibonacci eight sessions. This proportion looks right.
This alternate wave count now expects that the last four sessions have been the start of a third wave up at two degrees. Now a third wave up should begin here at three degrees. Price behaviour at this stage does not support this wave count. It could be redeemed if a classic upwards breakout occurs such as a strong upwards day to close above resistance at 1,245 on high volume.
The long lower wicks on four of the recent sessions does look bullish. There is some support for this wave count.
It is my judgement today that this wave count has about a 35% probability.
HOURLY CHART
Click chart to enlarge.
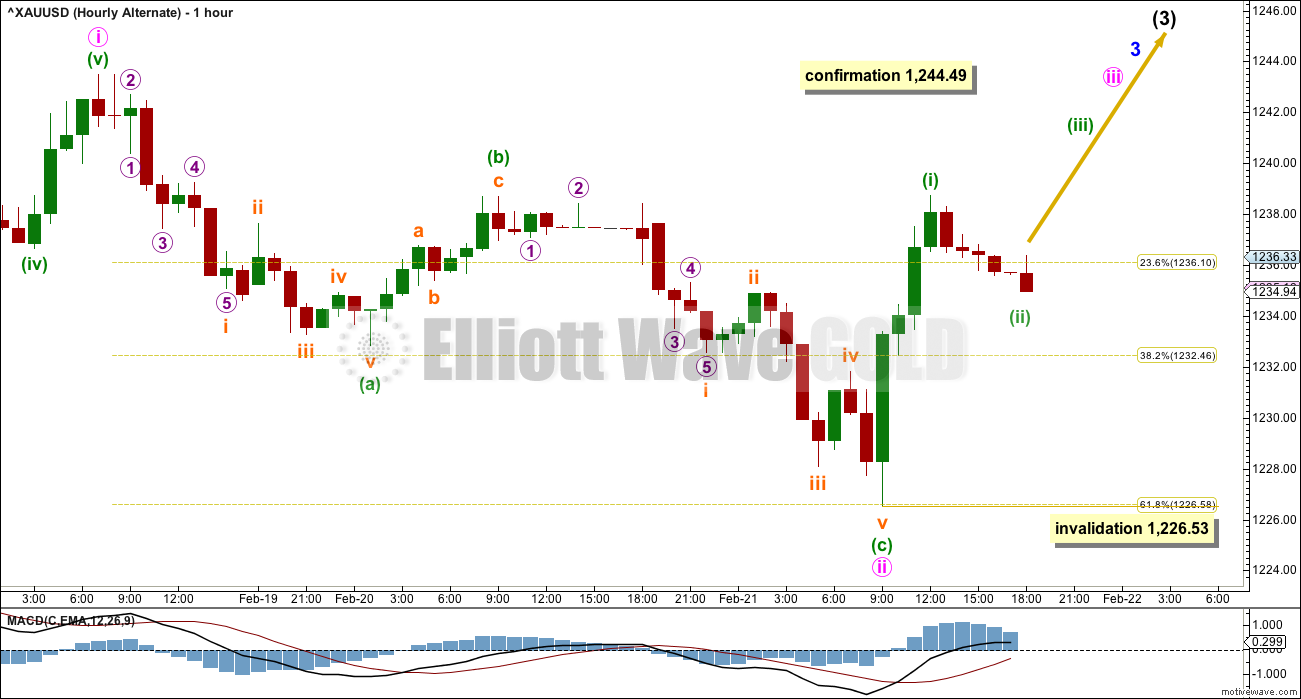
Minute wave ii now fits perfectly as a zigzag, ending almost right on the 0.618 Fibonacci ratio of minute wave i. This structure favours the alternate wave count today and is the reason for my judgement that it has today improved in probability.
A third wave up now at four degrees should begin. If this wave count is correct, then the next session should see a strong upwards breakout.
If this wave count is confirmed with a new high above 1,244.89, then it would be the only wave count. At that stage, expect price to keep rising and corrections to become more brief and shallow, and Gold to trend strongly.
If this wave count is confirmed, then members would be advised to be flexible, to switch quickly from bear to bull and trade accordingly.
Please always remember my two Golden Rules for traders:
1. Always use a stop.
2. Never invest more than 1-5% of equity on any one trade.
Within minor wave 1 upwards (now seen only on the daily chart), the structure must be seen as as five wave impulse. This can fit but requires a very rare running flat with a substantially truncated C wave. To see the subdivisions as an impulse for minor wave 1 see hourly charts in analysis for the 9th of February.
TECHNICAL ANALYSIS
WEEKLY CHART
Click chart to enlarge. Chart courtesy of StockCharts.com.
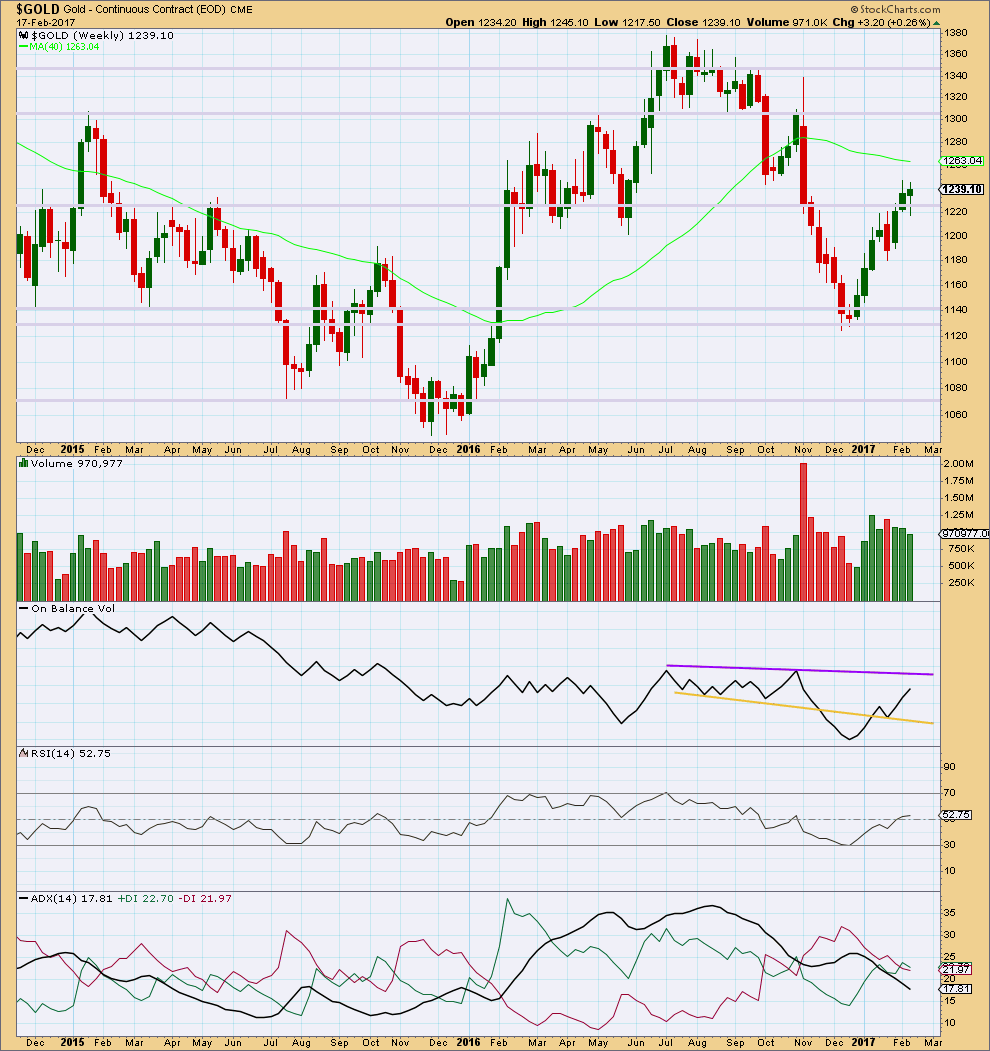
Price for last week made a lower high and lower low, the definition of downwards movement. However, the candlestick closed green and the balance of volume during the week was upwards. A decline in volume for upwards movement during the week is bearish. The long lower wick and green colour of the candlestick is bullish.
Resistance for On Balance Volume is some distance away as is support. The last break above resistance at the yellow line and backtest of support is bullish.
RSI is close to neutral. There is plenty of room for price to rise or fall here.
ADX is still declining after reaching extreme during the last upwards trend. The +DX and -DX lines have now crossed. If ADX turns up here, then an upwards trend would be indicated.
DAILY CHART
Click chart to enlarge. Chart courtesy of StockCharts.com.
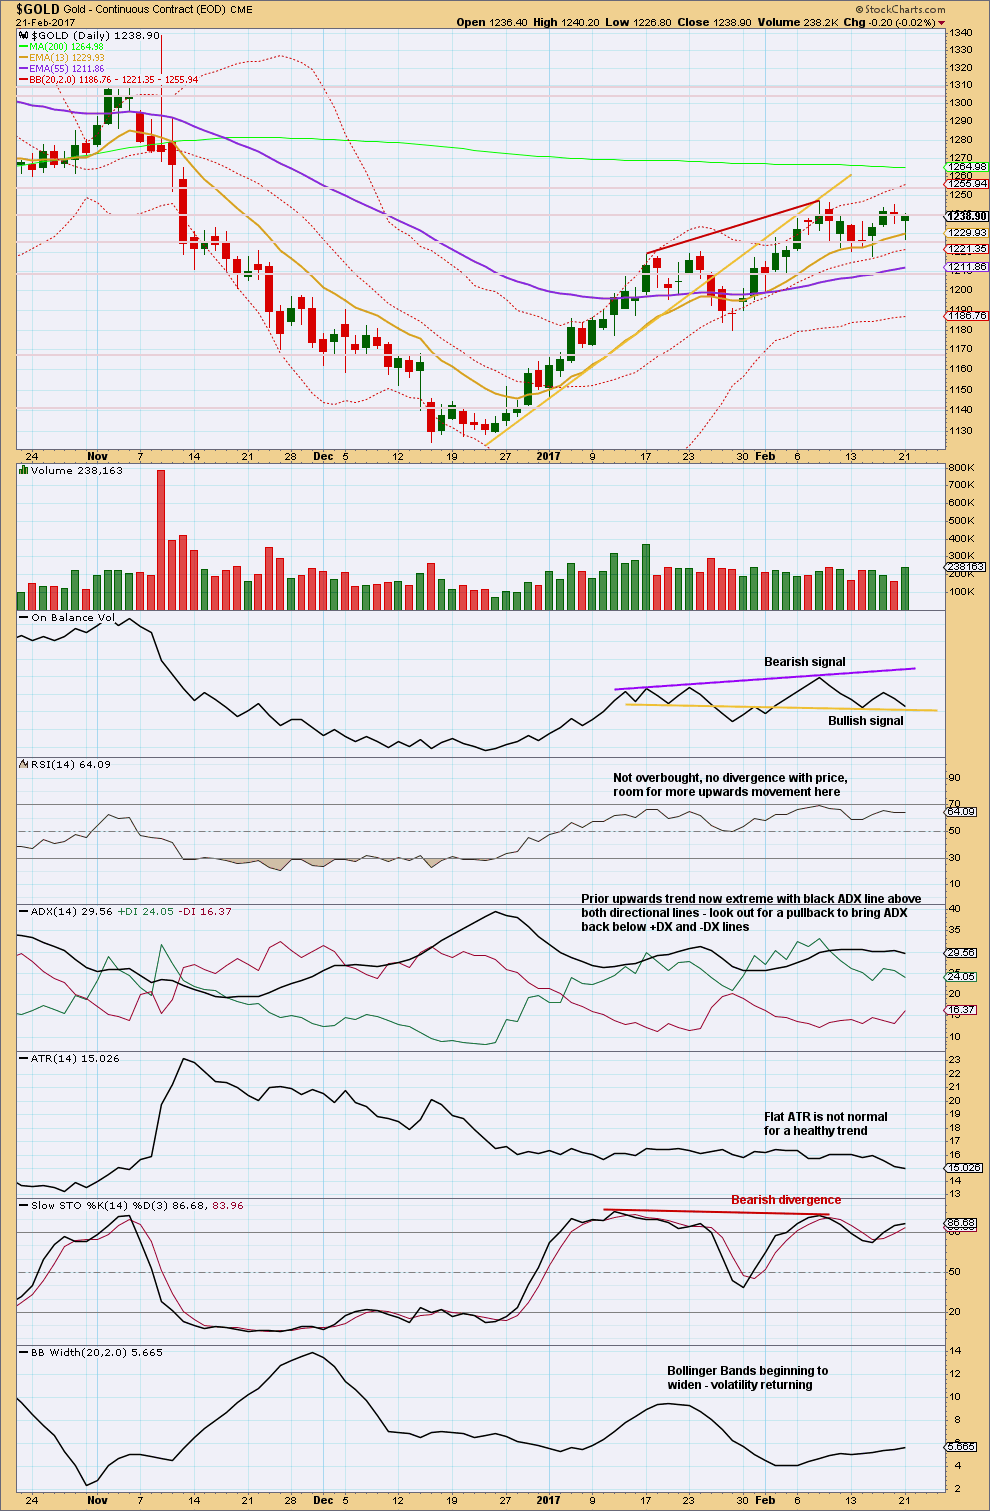
This last session made a lower low and lower high, the definition of downwards movement, but it closed green. The balance of volume was downwards and it shows an increase. This is bearish.
The long lower wicks on five of the last several candlesticks within this consolidation are bullish.
On Balance Volume is right at support. If tomorrow moves it lower, then it would break below support and offer a bearish signal.
ADX today is declining, indicating the market is not trending. It is range bound now with resistance about 1,245 and support about 1,220. During this consolidation, it is now two downwards days that have strongest volume suggesting a downwards breakout is more likely than upwards.
This analysis is more bearish than bullish, but not overly so. There is enough support for the alternate Elliott wave count for traders to remain cautious. Be prepared to be flexible and switch from bear to bull if price breaks out upwards.
GDX
DAILY CHART
Click chart to enlarge. Chart courtesy of StockCharts.com.
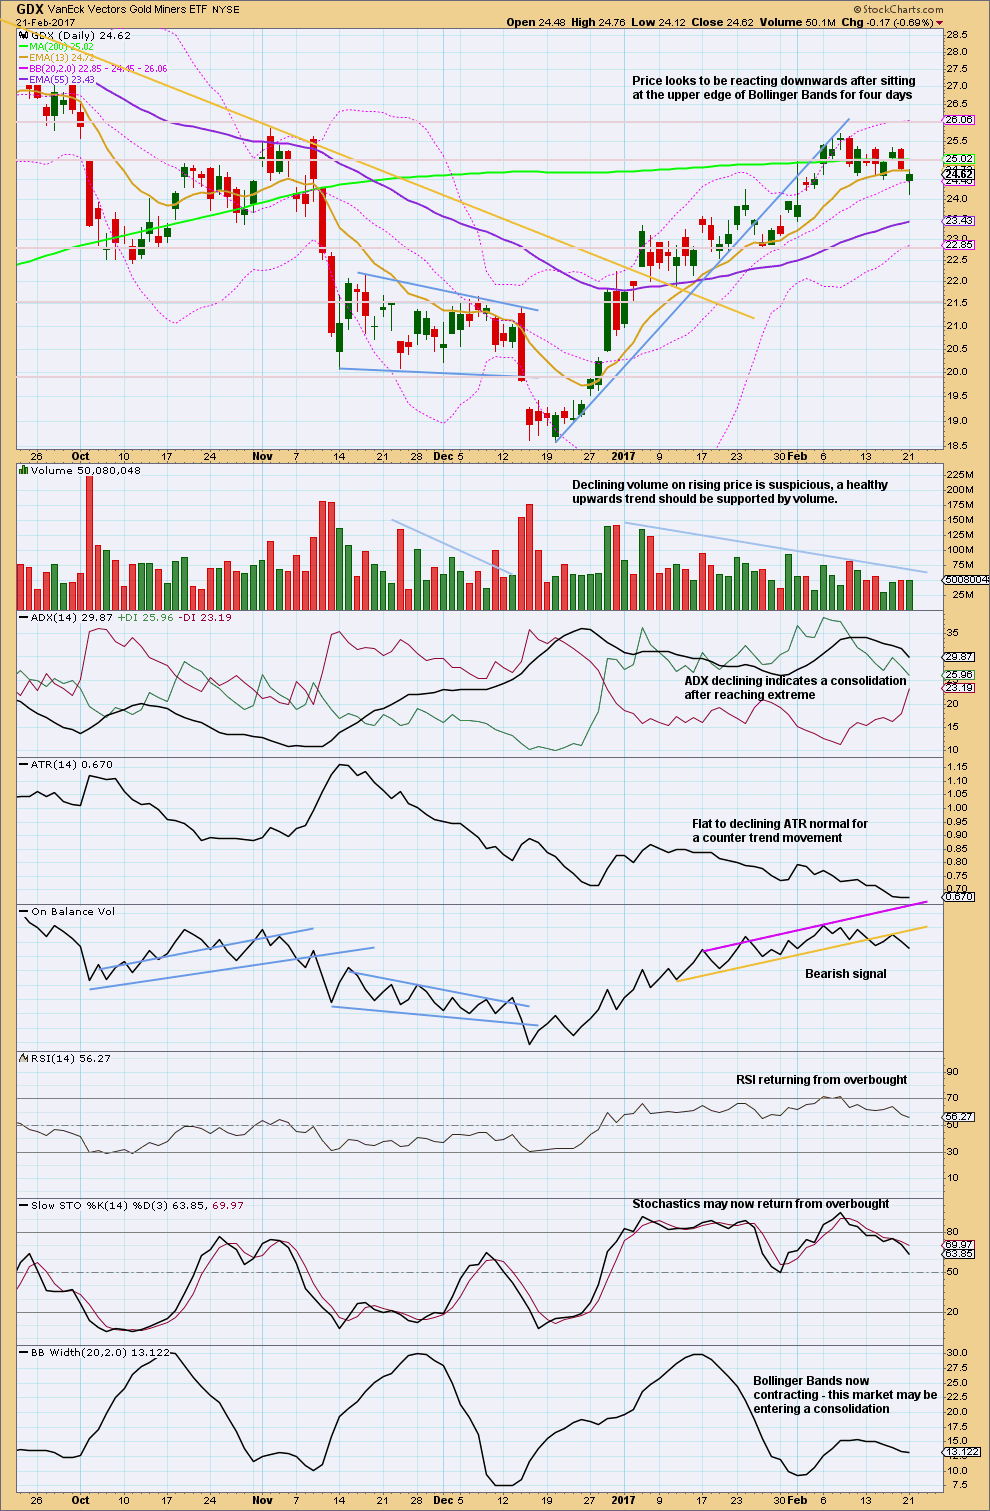
It looks increasingly like GDX has entered a consolidation. Resistance is about 25.70 and support is about 24.50. During the consolidation, so far it is the downwards day of the 9th of February that has strongest volume suggesting a downwards breakout may be more likely than upwards.
On Balance Volume offers another bearish signal for Friday. This supports a downwards breakout. Give this signal reasonable weight; it is often (not always) reliable.
This analysis is published @ 06:30 p.m. EST.
So you think the FED/Yellon helps or hurts a market?
IMO (and this is a pure EW approach) the Fed / Yellen may have a short to mid term effect on the market, but it cannot alter the primary trend.
So, neither.
But I am aware this is an unpopular view.
Fare enough, I agree.
It’s so irritating to see such dramatic action immediately upon the release of the FED minutes.
Looks like so far all counter trend movements. Deep corrections. I’m using it as an opportunity.
https://goldtadise.com/wp-content/uploads/2017/02/hui111-3.png
$hui chart may help some gain perspective on current direction.
So, here’s a comment directed at newer members.
Every time Gold enters a consolidation we have an increased churn in members. People come in, the market offers poor trading opportunities because it’s consolidating and I have alternate wave counts. They have a go, probably have some losses and quit.
And that right there folks is another reason why I want to shift to the Trading Room idea.
Gold is currently in a consolidation. It’s taking longer than originally expected. But that’s what markets do; they trend, then they consolidate.
When a market is not trending it’s harder to make money in it. Don’t do that. Find a market that is trending, join the trend and make money.
I’ve been publishing Trading Room updates for a couple of weeks now. I’ve offered accurate directions for NZDUSD, EURUSD, USDJPY, NGas, so far mostly for EURGBP… I’ve pointed out Copper is being squeezed and to watch for a breakout, and that US Oil is range bound, avoid it at this time.
So I’ve offered some darn good advice on finding a few trends to make some money. There is quite simply no excuse for anyone here not making money this week and last week. I must admit, I do get frustrated when I show people exactly how and where to make money and they still quit.
So for goodness sake, apart from holding hands I just don’t know how I could do this better. New members: take notice of those Trading Room updates. They’re there to make you money! It doesn’t matter what instrument we trade, we’re here to make money.
This week I now have good entries and profitable positions on EURUSD, USDJPY and NZDUSD. There’s no reason why a good number of EWG members shouldn’t have some profits this week too.
I’m holding an underwater position on Gold. I’ve lightened my position up there a bit to reduce risk as the situation becomes less clear. I’m prepared to take a small loss.
My profits so far exceed losses, so the general idea is working.
Rant over. Thank you for your patience 🙂
Your efforts are greatly appreciated Lara. The trading room was an excellent idea and long may it continue.
Thank you Ben. I’m going to take a few weeks to refine the approach. If it all goes well then that is the direction I want to go in. Because we’re here to make money, so lets make money 🙂
Hi Lara,
Here is where I am ‘stuck’!. As of this morn, I was following the Main count, BUT then noticed that Minuette Y is truncated compared to Minuette W of Minute iic. You have published it, so obviously it IS acceptable. But WHY? Is a truncation of W-X-Y simply acceptable at times?
I can see Alan’s interpretation. As you suggest, nothing is quite clear for now.
Thank you…
The concept of a truncation refers to C waves and fifth waves. Definitely not to Y and Z waves.
A combination should move price sideways. The second (and third) in the series should end about the same point as the first (and second) to achieve the purpose of a sideways look / trend.
Think of this possibility: if the second structure is a triangle then the end of it will be well off the end of the first structure. And that would definitely not be considered a truncation, and the whole structure would be fitting the purpose of a sideways movement.
Here minuette (y) ends very close to minuette (w). The purpose is achieved, it’s a big sideways movement and it took up time. It also confused and frustrated us, and IMO that’s another purpose of combinations.
Thank you for your reply…Lara. Very helpful and instructive!
By the way…are there other books, publications, etc. you might suggest that go into more detail than ‘The Elliot Wave Principle’ by Frost and Prechter. Many times, the extent of which you are able to define guidelines/rules and why waves form as they do is not always expounded on in above book.
Yeah, I’m writing one. I’ve almost finished the text, then I’ll give it to Cesar to put together as a self published book. But first, I may approach Wiley and see if I can get it professionally done.
But until that’s out, no. I don’t know of another option that’s better than Frost and Prechter.
Some of the rules and guidelines they have could be clearer really, and that’s why I wanted to have a go at writing an EW book.
At this time I would recommend using ONLY Frost and Prechter. Don’t use anything else, there’s too much out there online that ignores some EW rules. The 10th edition has a convenient list of all the rules and guidelines, read that over and over until you have memorised it.
Good for you!… I would purchase it.
One gander is that they haven’t made but very few changes in this book partly because EWI possibly likes to use it as an ‘entree’ to their courses, etc.
Hello all-
Very quiet today! Are you all awaiting the FED’s minutes too?
I’ve been on holiday(still am on holiday) and trying to get caught up on some needed rest. But after seeing Papudi’s “epic” chart last night :), I had to see what was going on!
Any analysis of today’s action: Lara, Verne, Dreamer, Papudi, Alan, etc?
I’ve literally been almost entirely off the grid for almost two weeks, so any current charts with comments would be greatly appreciated.
Cheers!
Wow!!…that was fast…you all must have been typing while I was. Thanks!!
LOL
I’m always here about this time. Now I’m off to grab a quick surf before StockCharts data is finalised and I can begin end of day analysis.
Thanks Lara,
I’ve only ever surfed Hawaii but it’s been a few years. Always enjoyed it and miss those days! Be safe.
With my work schedule and now holiday, I literally missed the Trading Room rollout. Great idea!
As for losses, I have surely missed opportunities for great trades, but have had much fewer bad trades than good. My work schedule often conflicts with day trading, so I seem always to be chasing those good opportunities. Hopefully I can effectively use this new concept.
Thanks again
Thomas
Bottom line:
This market is not currently trending. It’s range bound. That concept still fits the main wave count better than the alternate.
A double combination is a time consuming correction. This fits the view of a consolidating market.
Where the alternate is seeing a third wave up beginning at two large degrees. Now on the hourly chart with four degrees. That really should be moving up strongly. It’s not.
I’m pretty sure that if I swapped the wave counts over there would be a fair few members who would be pointing out that a third wave at multiple degrees should be moving fast, and it looks wrong.
Main hourly updated:
The key difference within todays movement is the structure of subminuette c of minuette (y) of minute ii. This main count sees it as a five, the alternate sees it as a three.
Unfortunately it will fit either way.
Alternate hourly chart updated:
another deep second wave, as Alan notes, an expanded flat.
They really are very common structures.
Price movement so far today seem to fit the Alternate Count better. Minuette 2 is an expanded flat. Currently, we are in subminuette c down. My target is 1231.19, the 0.618 Fib retrace. Invalidation 1226.53, the start of Minuette 2.
If using GDX as potential indicator, it favors the main count. Relatively large break down as Dreamer has nicely charted below.
GDX hourly update supports Lara’s technical GDX analysis expecting more downward movement.
https://www.tradingview.com/x/cIAxdEIk/
Hello Dreamer,
Thank you so much for your invaluable GDX hourly chart!
I appreciate your effort!
Pete
Nice work Dreamer.
What if instead of a leading diagonal, it was an ending diagonal to complete minor 5 of intermediate (1)?
What if you move minute iii, within minor 3, within intermediate (1) up to the next high (which you have labelled minor 3) then everything moves up further. I think that would fit.
Then you would have a more bearish wave count. If it looks better it could be a main, if not it could be an alternate.
Thanks Lara. Given how time consuming the current correction is and now the channel breach, I think it does make sense that the high @25.71 is likely the end of Intermediate wave 1. I’ll update my next posting. That could bring the correction target down to 21.30, the .618 retrace of the entire move up.
Alt one hour wave count has four wave 3’s unfolding once wave ii) completes in few candles around 1232.
A mini HnS is forming just below the bigger 2hr inv HnS neckline. This is a pointed indication that the break out to upside is going to happen once price moves above wave (b) green and wave (ii) green line (NL).