
More upwards movement continued to start the new week as the main Elliott wave count expected.
Summary: Use the channel on the second hourly chart and the channel on the alternate hourly chart. Assume the upwards trend remains the same while price remains within the channel. The target is at 1,296.
If price breaks below the channel with downwards movement (not sideways), then the alternate wave count would be more likely. The target then would be 1,217 at absolute minimum and likely about 1,197 – 1,192.
The main wave count has little support today from classic technical analysis. If the middle of a third wave has just passed, it has no support from volume and shows weakness due to declining ATR, contracting Bollinger Bands, and Stochastics divergence. Lighten long positions to take some profit (or exit entirely and wait for clarification) and be prepared to switch back from bull to bear if the channel is breached.
GDX is today very bearish. Will Gold follow?
New updates to this analysis are in bold.
Last monthly and weekly charts are here. Last historic analysis video is here.
Grand SuperCycle analysis is here.
MAIN ELLIOTT WAVE COUNT
DAILY CHART
Click chart to enlarge.
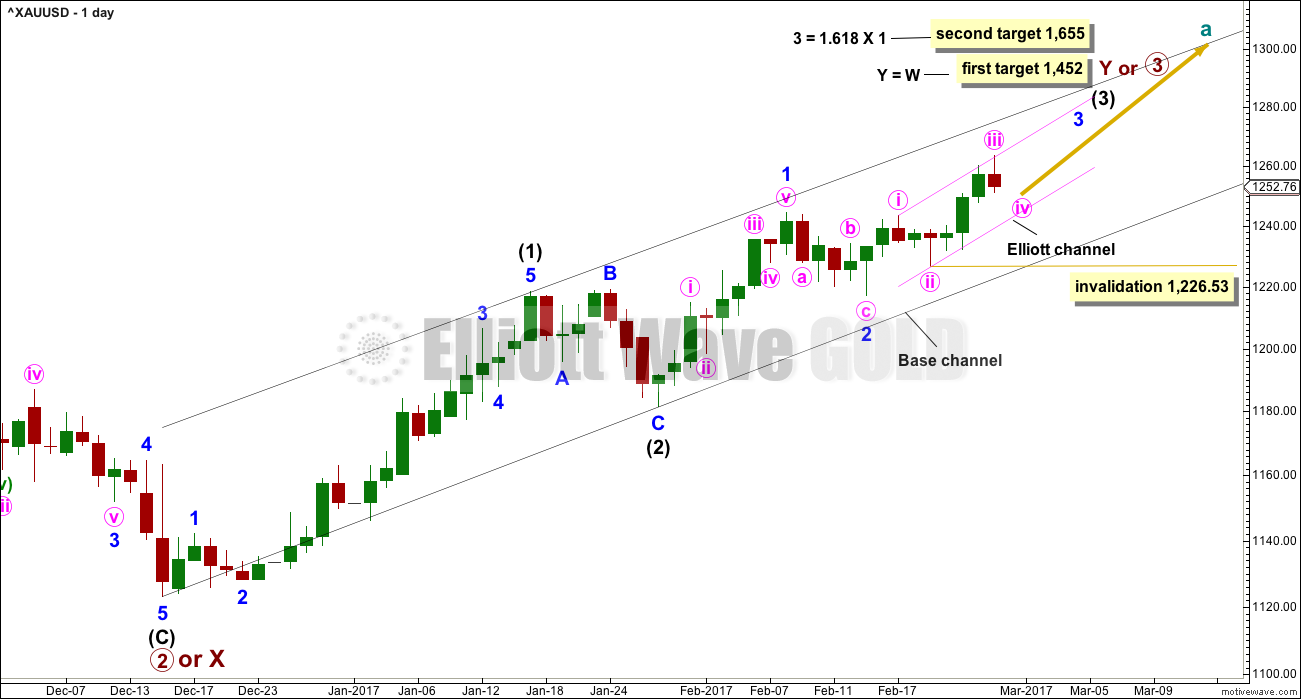
A third wave up now at three degrees at the daily chart level may have begun.
Because minute wave ii is a little deeper than the 0.618 Fibonacci ratio of minute wave i, and because this is the middle of a larger third wave, the appropriate Fibonacci ratio for a target for minute wave iii is 2.618.
Within minute wave iii, no second wave correction may move beyond the start of its first wave below 1,226.53.
Corrections should now begin to be more brief and shallow along the way up for this wave count. Upwards movement should have support from volume and show an increase in momentum. It is concerning that Friday’s upwards day does not have support from volume. It is now very concerning that Monday has another upwards day with even lighter volume. This does not look like a third wave.
Two hourly charts are presented today to fit with this main daily chart. The first hourly chart follows the labelling on the daily chart which sees minute wave iii complete. If minute wave iii is over now, it would have no Fibonacci ratio to minute wave i and it would be a little shorter than 1.618 the length of minute wave i.
It is my judgement today that this wave count is close to 50% likely. There is good support for the alternate over the main, but the fact is so far that price has made new highs and price supports this main wave count.
FIRST HOURLY CHART
Click chart to enlarge.
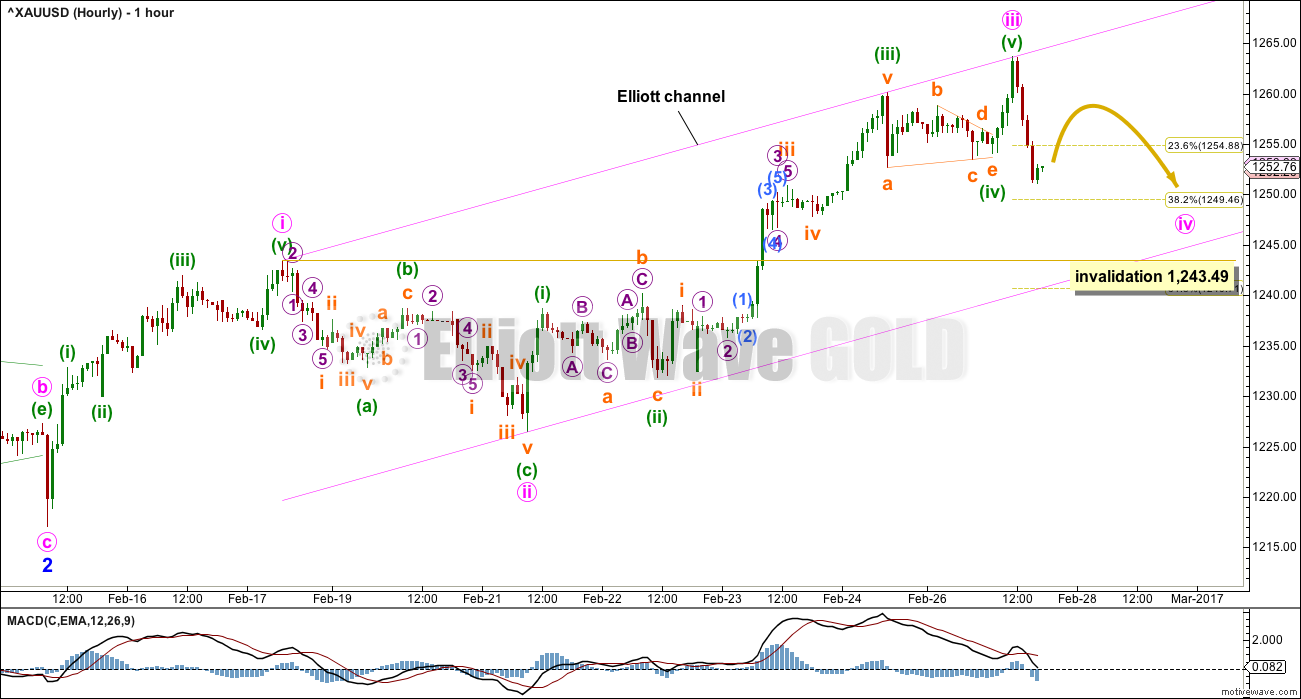
The channel is redrawn using Elliott’s first technique. If minute wave iii is over, then it shows an increase in upwards momentum compared to minute wave i. The fact that it has declining volume is very concerning though.
Minute wave ii was a deep 0.64 zigzag. Minute wave iv may be expected to be a shallow flat, triangle or combination. The most likely target for it to end would be about the 0.382 Fibonacci ratio at 1,249.
If minute wave iv is an expanded flat, running triangle or combination, then it may include a new high above 1,263.64 as part of its structure. There is no upper invalidation point for minute wave iv.
This wave count expects that minute wave v will be a very swift strong extension that may end in a blowoff top. This is common for fifth waves of Gold’s third wave impulses.
Minute wave iv may not move into minute wave i price territory below 1,243.49.
SECOND HOURLY CHART
Click chart to enlarge.
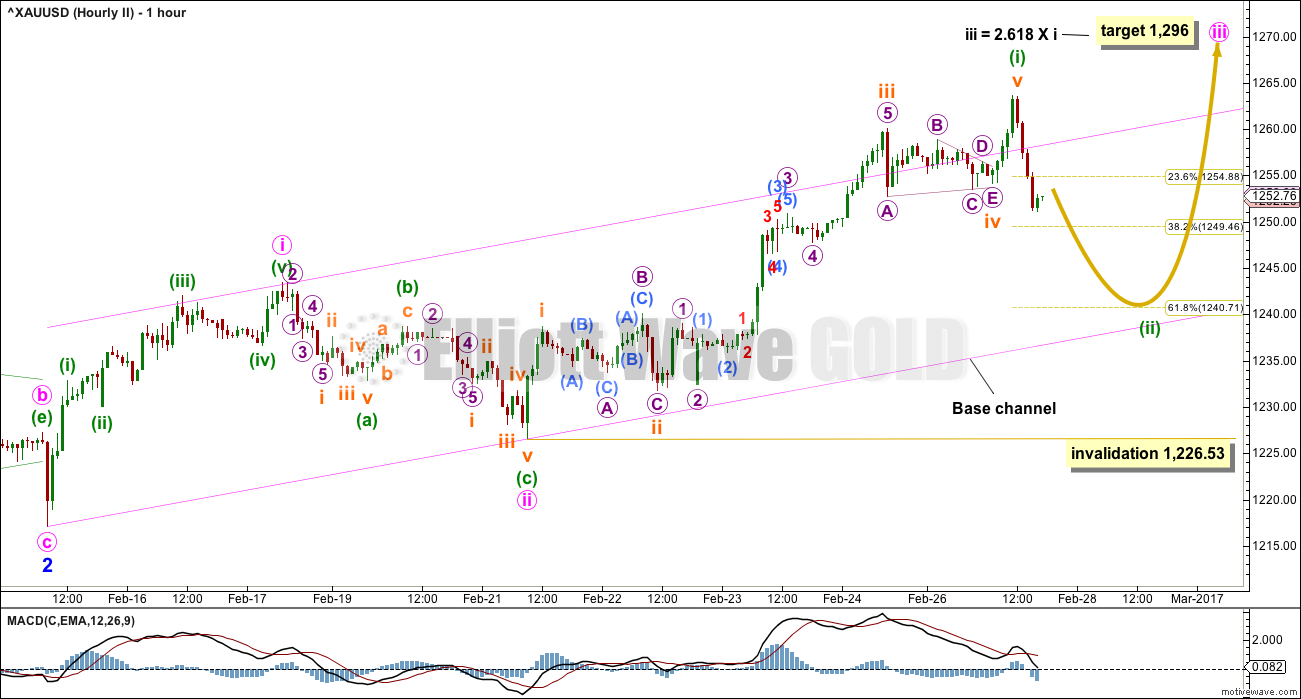
All the subdivisions within this wave count are identical to the first hourly chart. Only here the degree of labelling within the impulse now labelled minuette wave (i) has all been moved down one degree.
The second wave correction of minuette wave (ii) is not complete.
When minuette wave (ii) is complete, then the middle of a third wave up at four degrees should show a strong increase in momentum and should have clear support from volume.
The pink channel is redrawn here to be a base channel about minute waves i and ii. Lower degree second wave corrections should find support at the lower edge of a bull market base channel. If price breaks below the base channel with downwards (not sideways) movement, then the probability of the main wave count would reduce substantially and the probability of the alternate wave count below would increase. They may be swapped over if that happens.
Minuette wave (ii) may end about the 0.382 or 0.618 Fibonacci ratio of minuette wave (i).
Minuette wave (ii) may not move beyond the start of minuette wave (i) below 1,226.53.
ALTERNATE ELLIOTT WAVE COUNT
DAILY CHART
Click chart to enlarge.
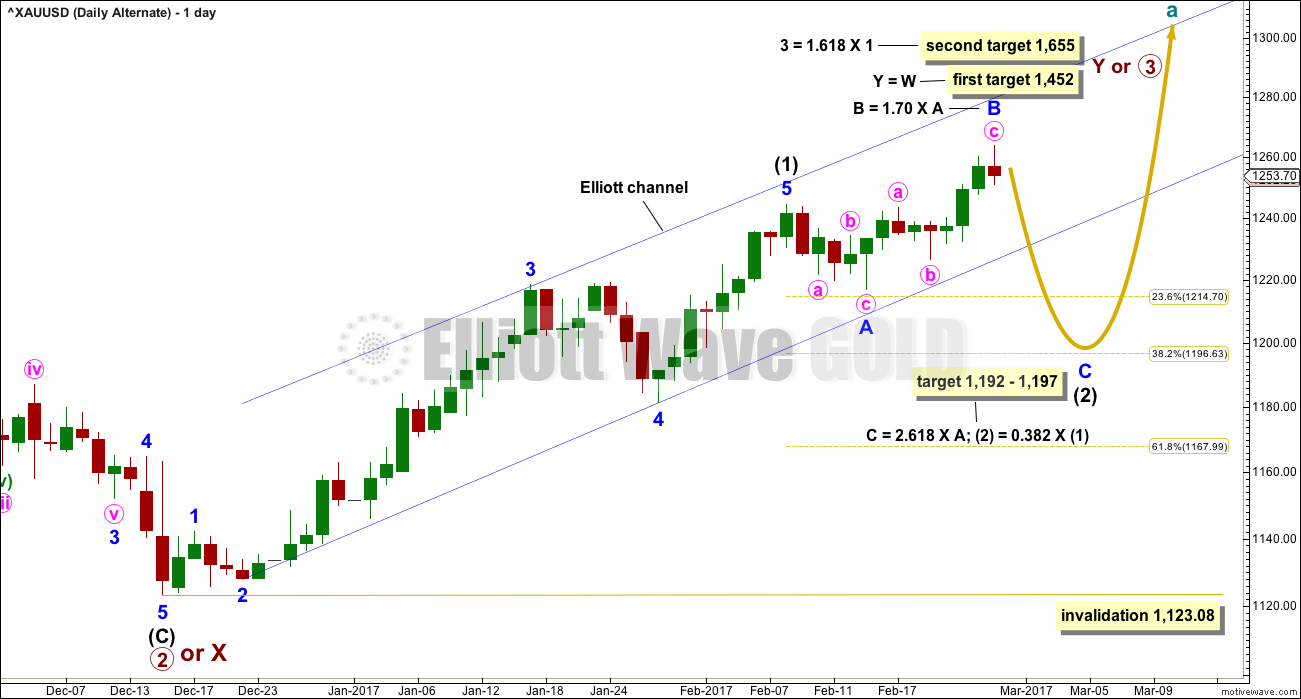
This alternate wave count expects that the breakout may be false. Sometimes this happens, so this wave count would provide a road map for what may happen next.
Intermediate wave (1) may have been over later. The structure within it still looks adequate.
Intermediate wave (2) may be an incomplete expanded flat correction, and so far within it minor wave B would be a 1.70 length of minor wave A, now outside the normal range of 1 to 1.38.
If minor wave B is over here, then the appropriate Fibonacci ratio for minor wave C would be 2.618 the length of minor wave A. If minor wave B continues higher, then this target must also move correspondingly higher.
Intermediate wave (2) may not move beyond the start of intermediate wave (1) below 1,123.08.
It is my judgement today that this alternate wave count has about 50% probability.
HOURLY CHART
Click chart to enlarge.
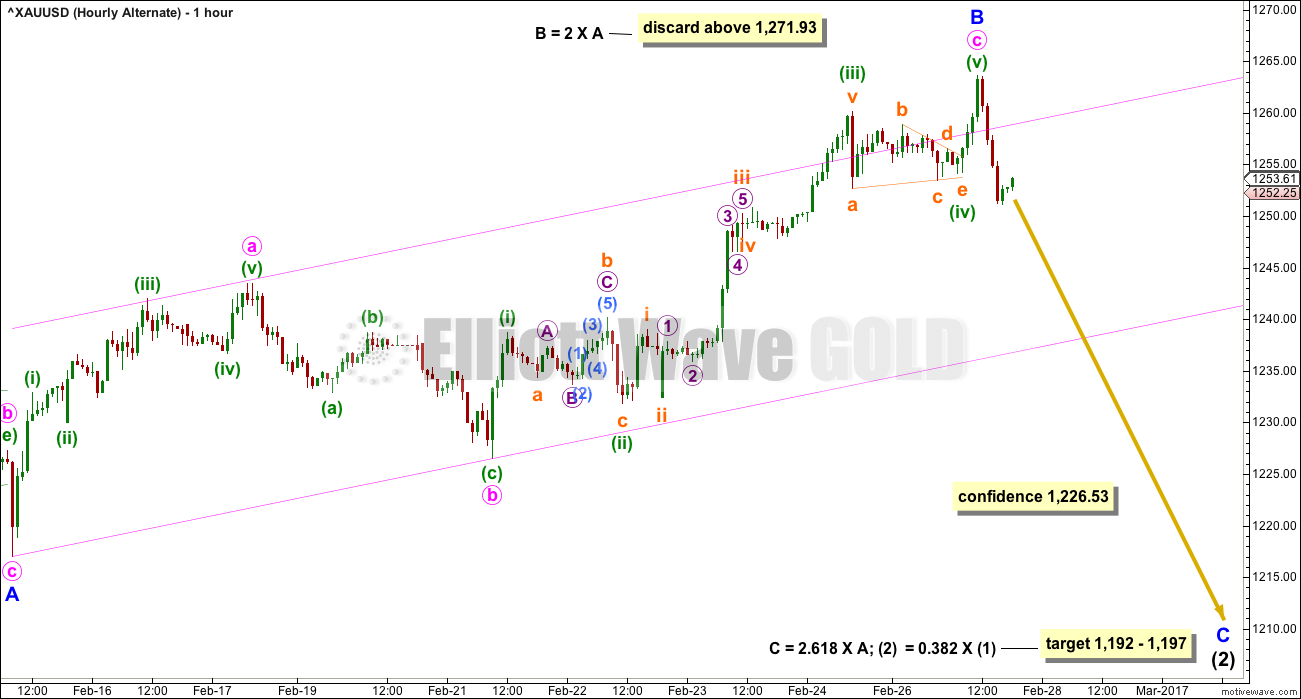
1-2-3 of an impulse and A-B-C of a zigzag have exactly the same subdivisions: 5-3-5. The subdivisions of upwards movement from the low of minor wave A are labelled the same for all three hourly charts.
If price makes a new low below 1,226.53, then this would be the only wave count.
There is unfortunately no rule stating a maximum length for B waves within flat corrections. There is a convention within Elliott wave that states when the B wave reaches twice the length of the A wave the idea of a flat correction continuing should be discarded based upon a very low probability. In this instance that price point would be at 1,271.93.
This wave count now expects a strong five wave movement downwards for minor wave C. Minor wave C would be extremely likely to make at least a slight new low below the end of minor wave A at 1,217.05 to avoid a truncation and a very rare running flat.
One possible approach to trading this alternate wave count would be to exit any long positions if the base channel on the second hourly chart above is breached with downwards movement. The channel is drawn in the same way on this hourly chart. Members may consider entering short there, or reducing risk by waiting for a new low below 1,226.53. The minimum profit target would be at 1,217, with the upper edge of the range at 1,197 a reasonable target. Stops should be set just above the last swing high, and this may mean that this possible trade would have a large risk to small reward ratio. It is up to each member to judge for themselves if this is acceptable to their accounts.
Always use a stop and invest no more than 1-5% of equity on any one trade.
TECHNICAL ANALYSIS
WEEKLY CHART
Click chart to enlarge. Chart courtesy of StockCharts.com.
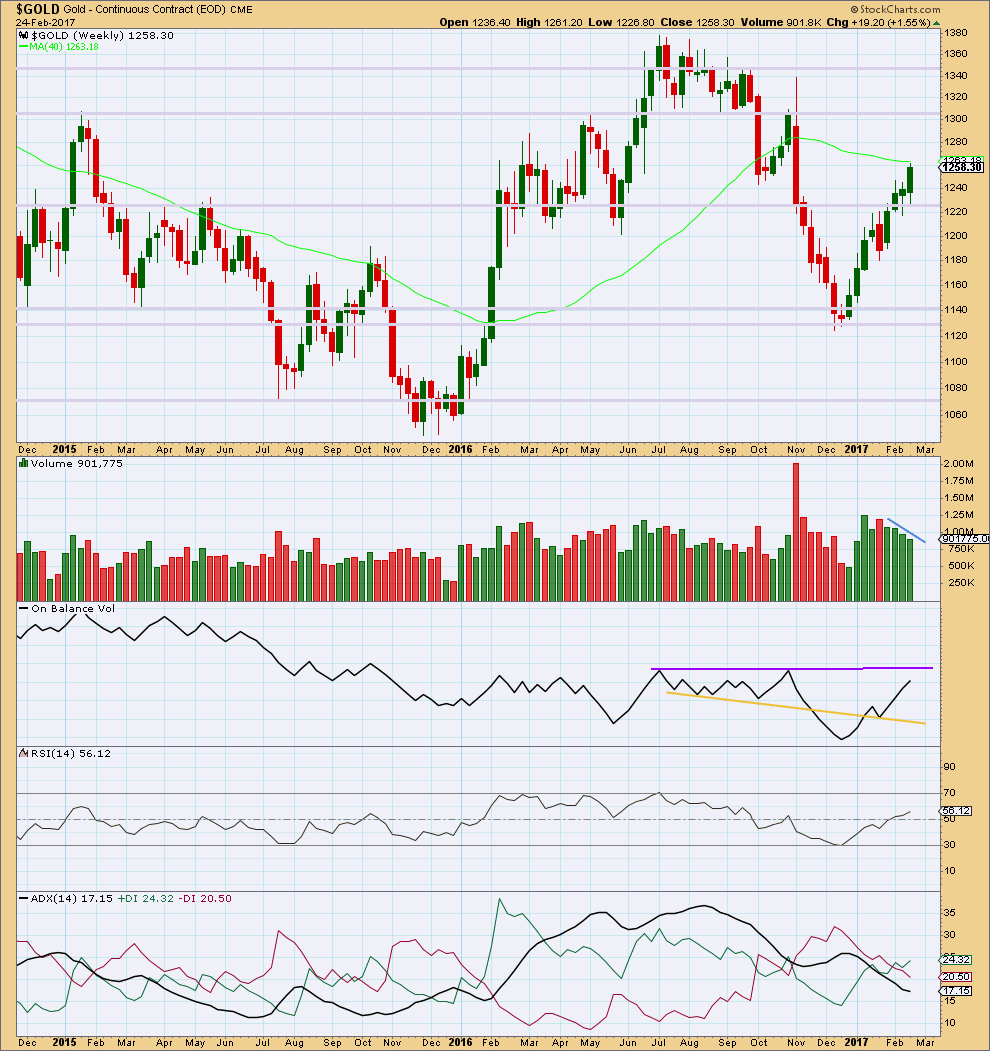
The last four weekly candlesticks are all green and all show a constant decline in volume. At the weekly chart level, this supports the alternate wave count but is very concerning for the main wave count. A third wave up at multiple degrees should have good support from volume.
On Balance Volume is nearing resistance, but it is not there yet.
RSI is not overbought. There is room for price to rise further.
ADX indicates a possible trend change from down to up, but does not yet indicate there is an upwards trend.
DAILY CHART
Click chart to enlarge. Chart courtesy of StockCharts.com.
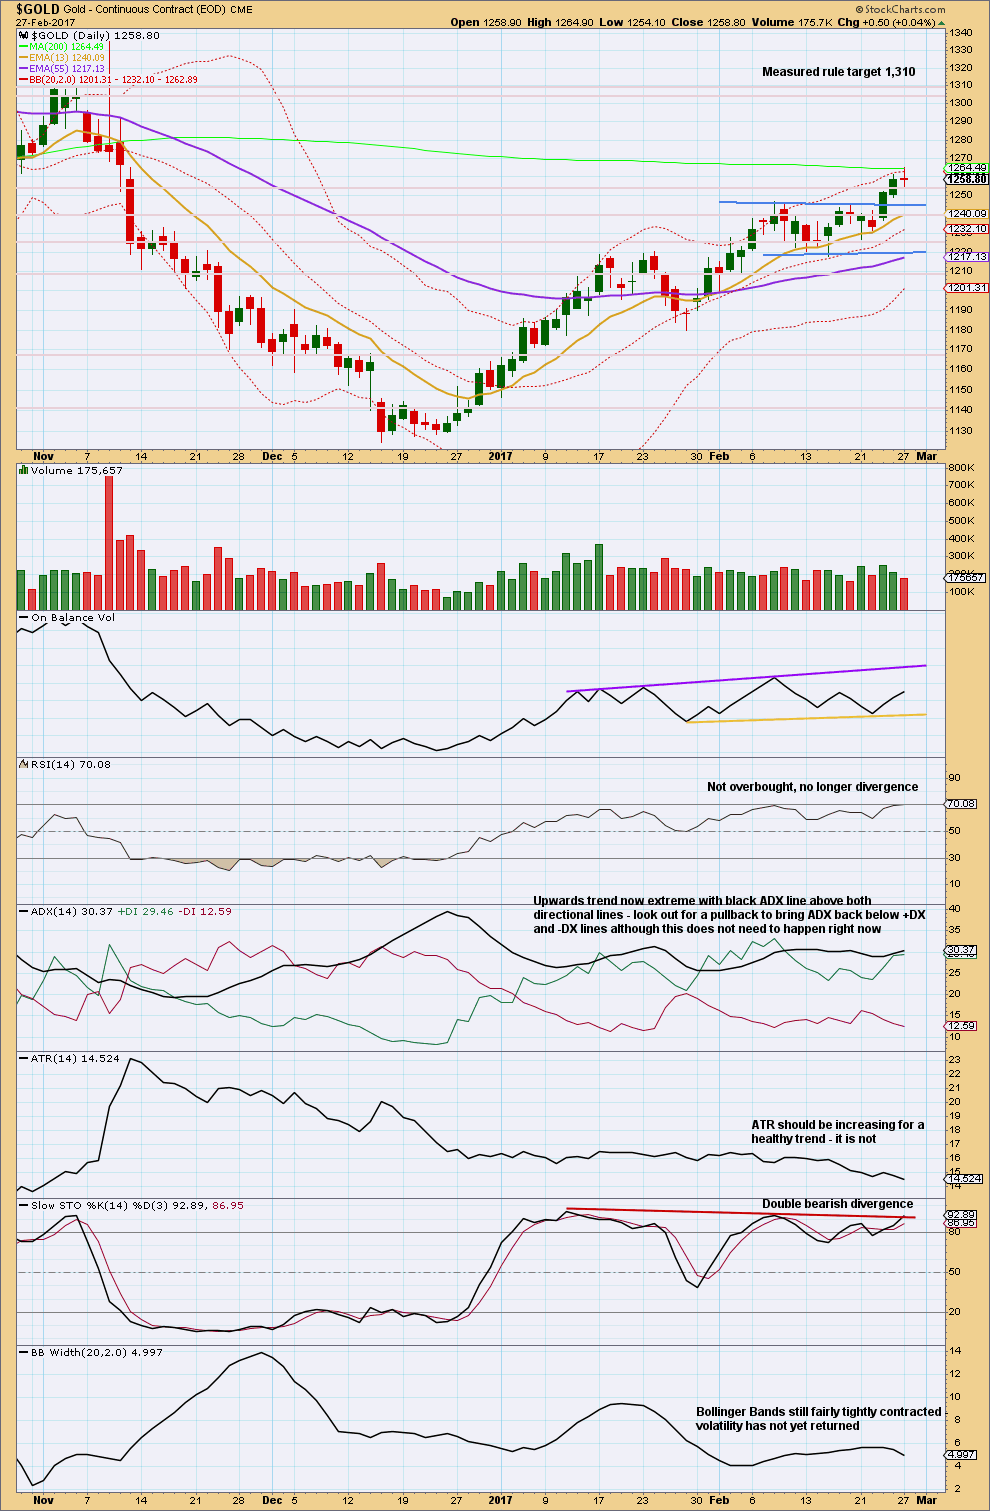
Another upwards day with a higher high and a higher low closes as a red doji. Price has broken above prior resistance and is now finding support about 1,255.
It is very concerning for the main wave count that the last two upwards days have light and declining volume. This strongly supports the alternate wave count above the main wave count.
ATR is also declining. This is absolutely not normal for a third wave. The alternate wave count must be taken very seriously.
What was prior triple bearish divergence between price and Stochastics is now today only double bearish divergence. This still supports the alternate Elliott wave count over the main wave count.
Bollinger Bands have begun to contract in the last two days. If the middle of a third wave up has just passed, this makes no sense. This also supports the alternate wave count over the main wave count.
GDX
DAILY CHART
Click chart to enlarge. Chart courtesy of StockCharts.com.
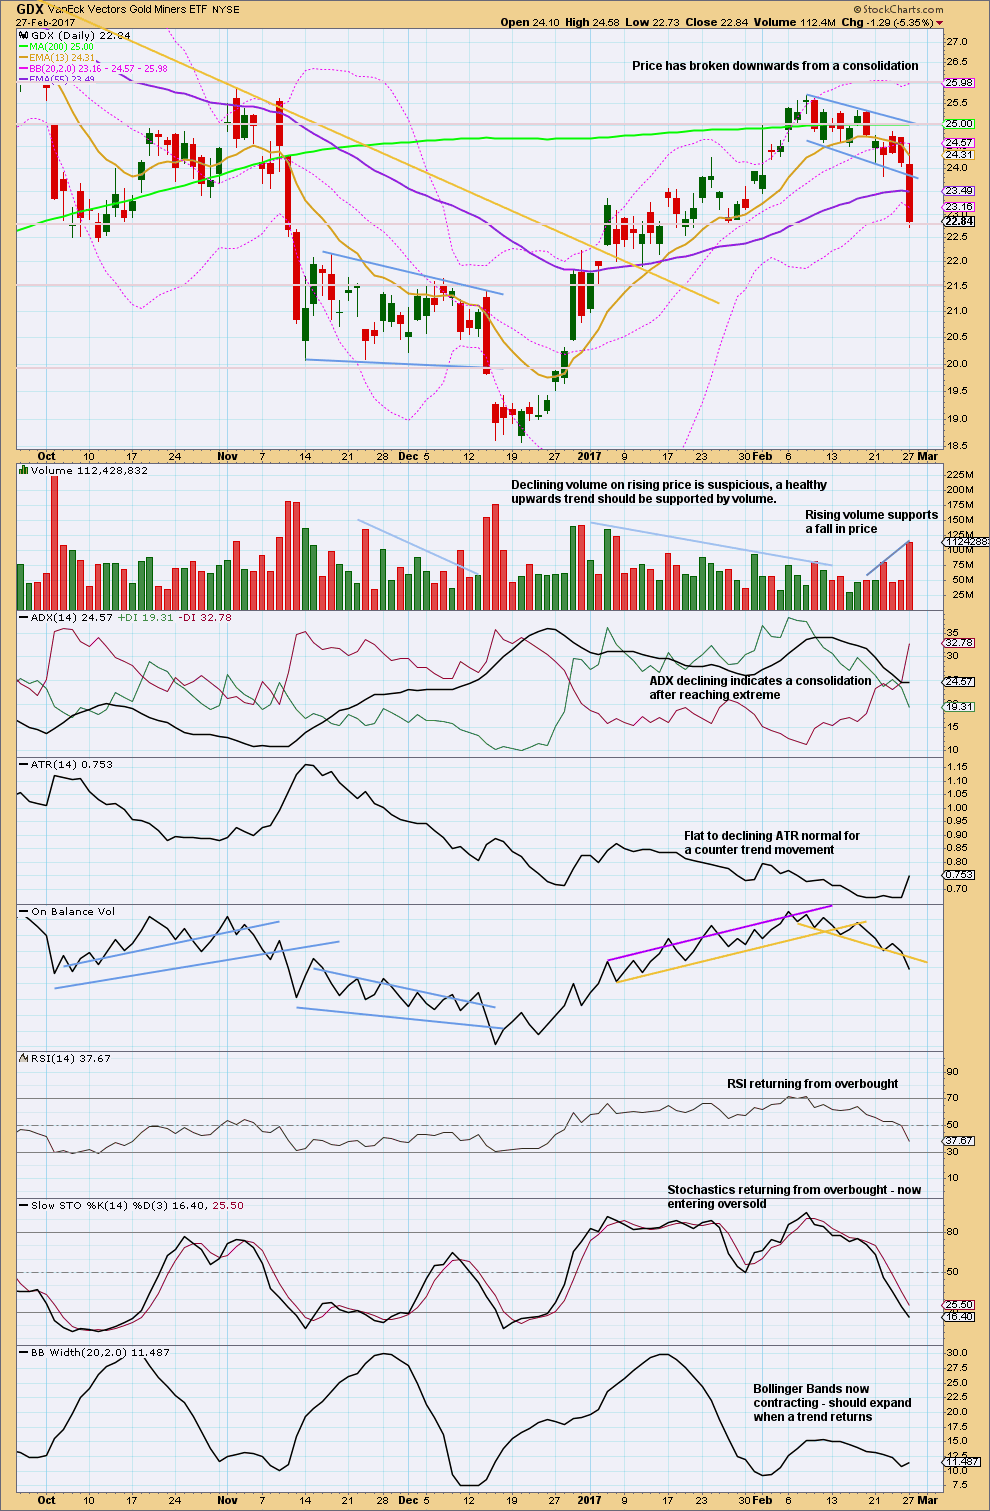
Price has broken out downwards from the consolidation. The breakout is strong and has support from volume. There is support for price about here at 22.75. Thereafter, next support is about 21.50.
On Balance Volume gives another bearish signal today for GDX.
Stochastics is not yet oversold. Price may move lower while Stochastics moves further into oversold.
This analysis is published @ 07:34 p.m. EST.
Penetration of the lower BB by the minner ETFs means this correction should be over in days and not weeks; munching on more tasty June calls. I suspect they will turn before the metals.
If gold follows down and the miners start holding up then the correction may be over.
Thanks to Lara…..and Dreamer for their excellent road maps. Very helpful in managing current short term trades.
You’re welcome. GDX following the plan so far 🙂
Which plan? Sorry
Alternate hourly chart updated:
If this is the start of a multi day pullback then it has begun with two overlapping first and second waves.
First hourly chart updated:
If this is minute iv it must end soon. It’s running out of room to move in.
A break out from HnS NL at 1240 may get back tested. Lara’s hourly ii wave count suggests wave may run upto 1240.
Both hourly wave count are in line with gold moving higher to test Nov 8 2016 high volume price point.
Excellent Elliott wave analysis her. Thanks Lara.
Looks like yesterday’s bearish candlestick on gold was confirmed today with gold making a lower low.
GDX also made a lower low as well.
It appears gold is taking a breather right now as it reached the bottom of the bollinger bands on the 4 hour. What’s interesting is that when gold fell previously last week, it always bounced back with the beginning of an expanding flat. Today, it’s behavior is different.
From a trading perspective, Lara has the odds between the main and alternate being a coin flip. With Trump speaking tonight, it’s very difficult for me to jump in with a trade on anything… broader markets (S&P), gold, etc…
I”m jumping. The speech will accelerate developing set-ups, not change them. Buying vol and miners…
Spread on NUGT June calls far more reasonable. Grabbing a few 10.00 strikes for 2.40 per contract and will exercise JNUG 1.00 strike calls Maybe I can take advantage of those inflated premiums and sell some covered calls.
These market makers are way too funny. Despite the 10% pop in JNUG today, the bid on those 1.00 calls have fallen from 6.25 to 4.90, while the ask has gone up from 6.50 to 9.20.
It sure looks to me like they are not too eager to be on the short side of the leveraged miners… 🙂
This price action in Gold, according to Gann Global is exactly what was predicted by the historical data of similar moves of the last several months. Even if we are in a bear market rally, the next several days should offer some outstanding opportunities to establish long positions imho…
Miners go down and duck. Nobody wants to get sold. They want to get bought! I hope that they control this move down.
The BIG weekly picture shows GDX still above it’s 200MA and the 50MA is above the 200MA. The chart still looks good for the bulls as long as the uptrend line shown in purple holds.
https://www.tradingview.com/x/nJsSsCkm/
GDX Daily look:
https://www.tradingview.com/x/BslZoHiO/
A look at GDXJ
https://www.tradingview.com/x/hrLW0tBH/
GDX and GDXJ had ugly down days today. Based on the daily candles last Thurs and Friday, along with the channel breach that I showed on my hourly 60 min GDX EW chart last week, today’s action shouldn’t have been a huge surprise. A 3rd wave down was expected, although it’s always shocking when miners have such a hard down day as Gold squeaks out an up day.
So is the bull dead? I don’t think so. As Johno stated yesterday, I think we need to see Gold correct here with the miners for the next week or so to alleviate the divergence, then hopefully we get a strong move up by both Gold and GDX.
The attached chart shows were I think we are with the GDX EW count. Good trading to all!
P.S. JNUG, the 3X GDXJ ETF, was down a whopping 28+% today. Not for the faint of heart nor inexperienced!
Forgot to post the link for the chart above. Here it is:
https://www.tradingview.com/x/h4l0RIbg/