
Some downwards movement was expected from all three hourly Elliott wave charts.
Summary: Use the channel on the second hourly chart and the channel on the alternate hourly chart. Assume the upwards trend remains the same while price remains within the channel. The target is at 1,296.
If price breaks below the channel with downwards movement (not sideways), then the alternate wave count would be more likely. The target then would be 1,217 at absolute minimum and likely about 1,197 – 1,192.
The main wave count has little support today from classic technical analysis. If the middle of a third wave has just passed, it has no support from volume and shows weakness due to declining ATR, contracting Bollinger Bands, and Stochastics divergence. Lighten long positions to take some profit (or exit entirely and wait for clarification) and be prepared to switch back from bull to bear if the channel is breached.
GDX is today very bearish. Will Gold follow?
New updates to this analysis are in bold.
Last monthly and weekly charts are here. Last historic analysis video is here.
Grand SuperCycle analysis is here.
MAIN ELLIOTT WAVE COUNT
DAILY CHART
Click chart to enlarge.
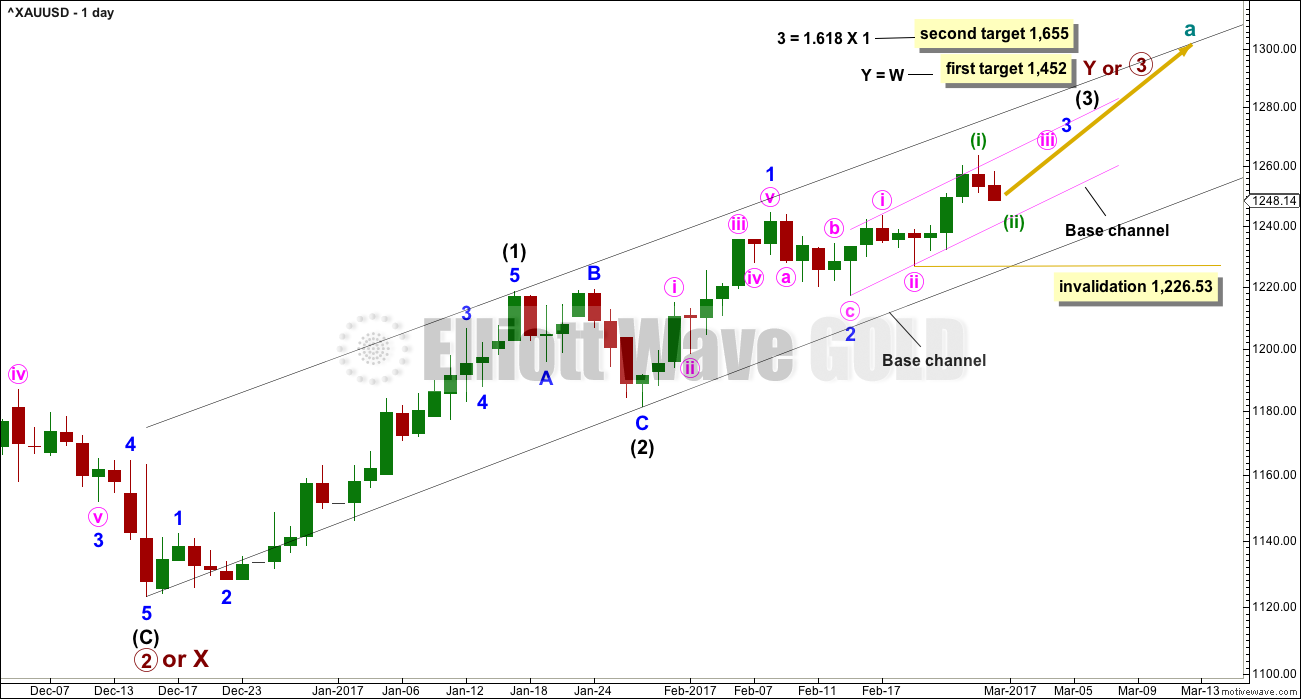
A third wave up now at three degrees at the daily chart level may have begun.
Within minor wave 3, no second wave correction may move beyond the start of its first wave below 1,226.53.
Corrections should now begin to be more brief and shallow along the way up for this wave count. Upwards movement should have support from volume and show an increase in momentum.
Because so far upwards movement has not been supported by volume, it looks unlikely that the middle of a big third wave has passed. It is more likely that there is a series of first and second waves completing and the middle of a third wave is still ahead. For this reason the two hourly wave counts for the main wave count are swapped over today.
It is my judgement today that this wave count is close to 50% likely. There is good support for the alternate over the main, but the fact is so far that price has made new highs and price supports this main wave count.
FIRST HOURLY CHART
Click chart to enlarge.
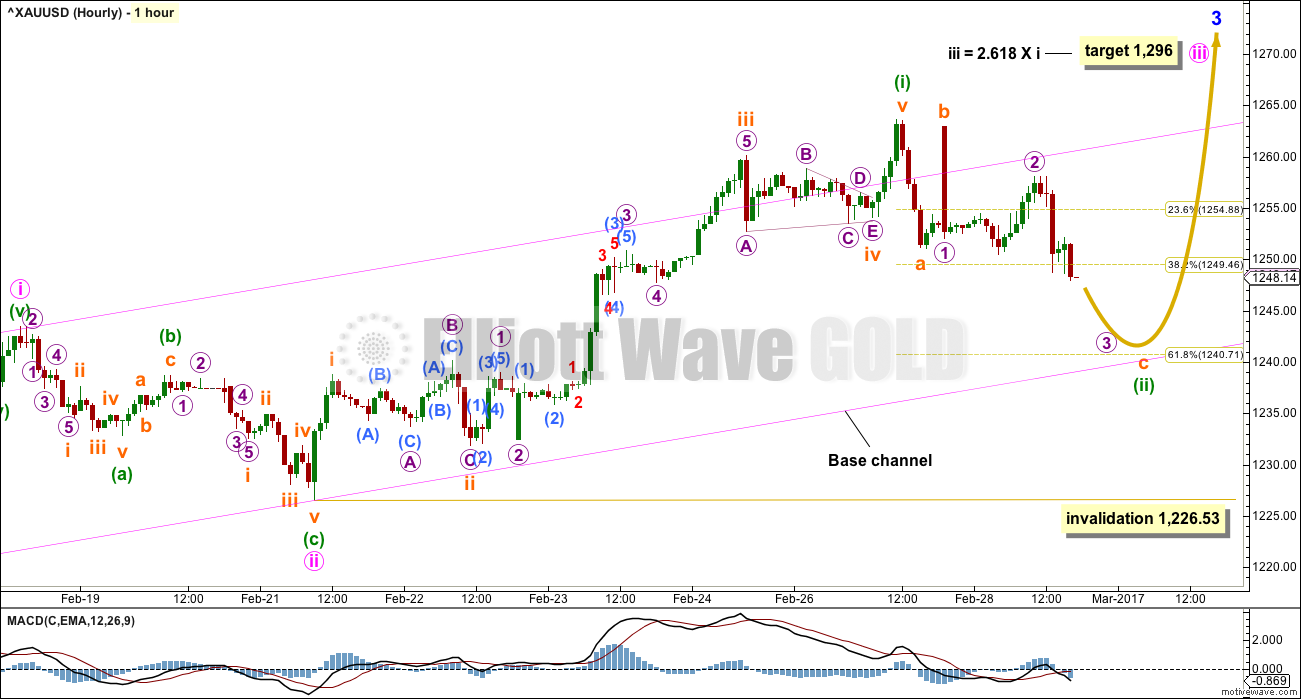
All the subdivisions within this wave count are identical to the second hourly chart. Only here the degree of labelling within the impulse now labelled minuette wave (i) has all been moved down one degree.
The second wave correction of minuette wave (ii) is still not complete.
When minuette wave (ii) is complete, then the middle of a third wave up at four degrees should show a strong increase in momentum and should have clear support from volume.
The pink channel is a base channel about minute waves i and ii. Lower degree second wave corrections should find support at the lower edge of a bull market base channel. If price breaks below the base channel with downwards (not sideways) movement, then the probability of the main wave count would reduce substantially and the probability of the alternate wave count below would increase. They may be swapped over if that happens.
Minuette wave (ii) may end about the 0.618 Fibonacci ratio of minuette wave (i).
Minuette wave (ii) may not move beyond the start of minuette wave (i) below 1,226.53.
At this stage, it looks like minuette wave (ii) is unfolding as either a single or double zigzag.
SECOND HOURLY CHART
Click chart to enlarge.
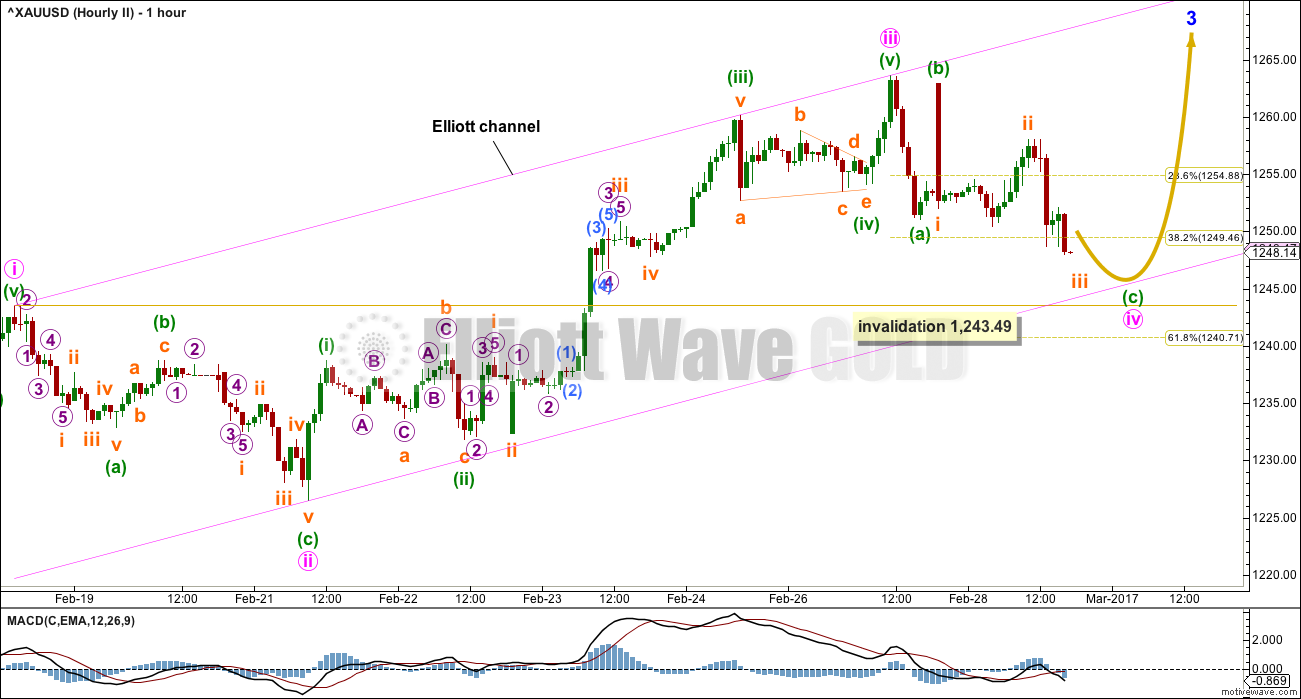
The channel is redrawn using Elliott’s first technique. If minute wave iii is over, then it shows an increase in upwards momentum compared to minute wave i. The fact that it has declining volume is very concerning though.
Minute wave ii was a deep 0.64 zigzag. Minute wave iv may be expected to be a shallow flat, triangle or combination. The most likely target for it to end would be about the 0.382 Fibonacci ratio at 1,249. It may end quite soon now if this wave count is correct.
At this stage, downwards movement for minute wave iv fits best as a zigzag. It may also be a double zigzag. If minuette wave (a) is seen as a three, then minute wave iv may also be a regular flat correction.
This wave count expects that minute wave v will be a very swift strong extension that may end in a blowoff top. This is common for fifth waves of Gold’s third wave impulses.
Minute wave iv may not move into minute wave i price territory below 1,243.49.
ALTERNATE ELLIOTT WAVE COUNT
DAILY CHART
Click chart to enlarge.
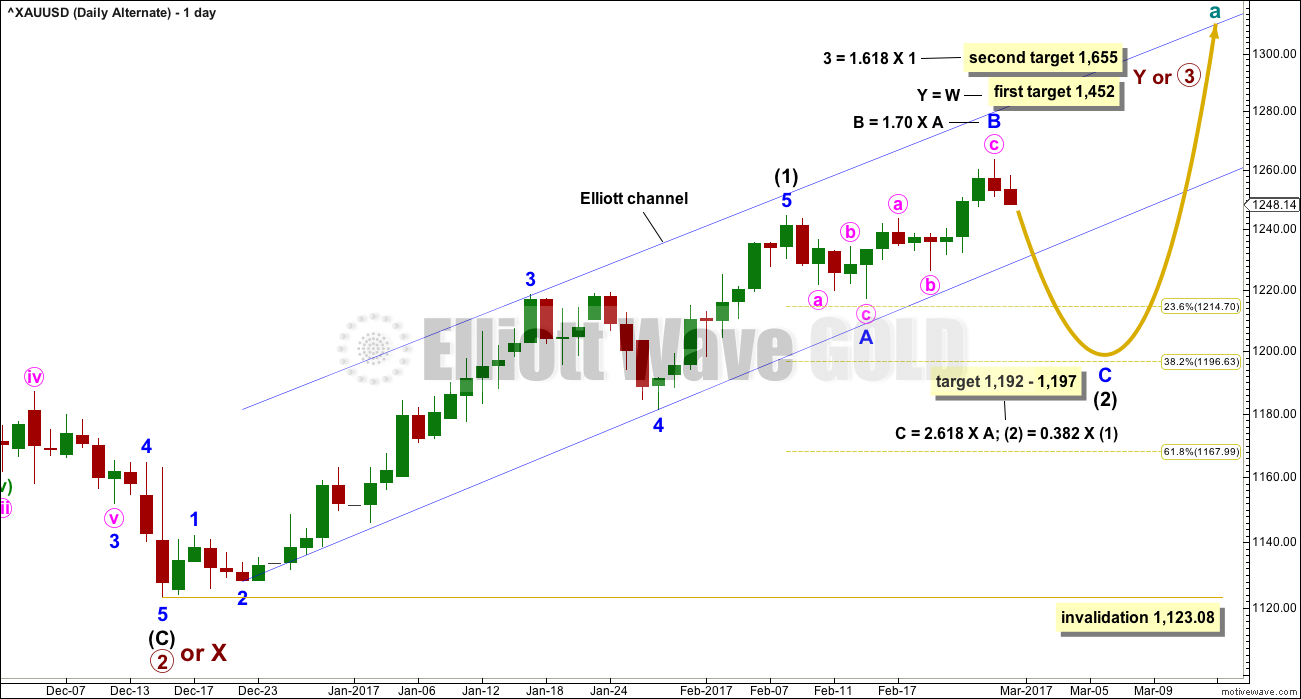
This alternate wave count expects that the breakout may be false. Sometimes this happens, so this wave count would provide a road map for what may happen next.
Intermediate wave (1) may have been over later. The structure within it still looks adequate.
Intermediate wave (2) may be an incomplete expanded flat correction, and so far within it minor wave B would be a 1.70 length of minor wave A, now outside the normal range of 1 to 1.38.
If minor wave B is over here, then the appropriate Fibonacci ratio for minor wave C would be 2.618 the length of minor wave A. If minor wave B continues higher, then this target must also move correspondingly higher.
Intermediate wave (2) may not move beyond the start of intermediate wave (1) below 1,123.08.
It is my judgement today that this alternate wave count still has about 50% probability.
HOURLY CHART
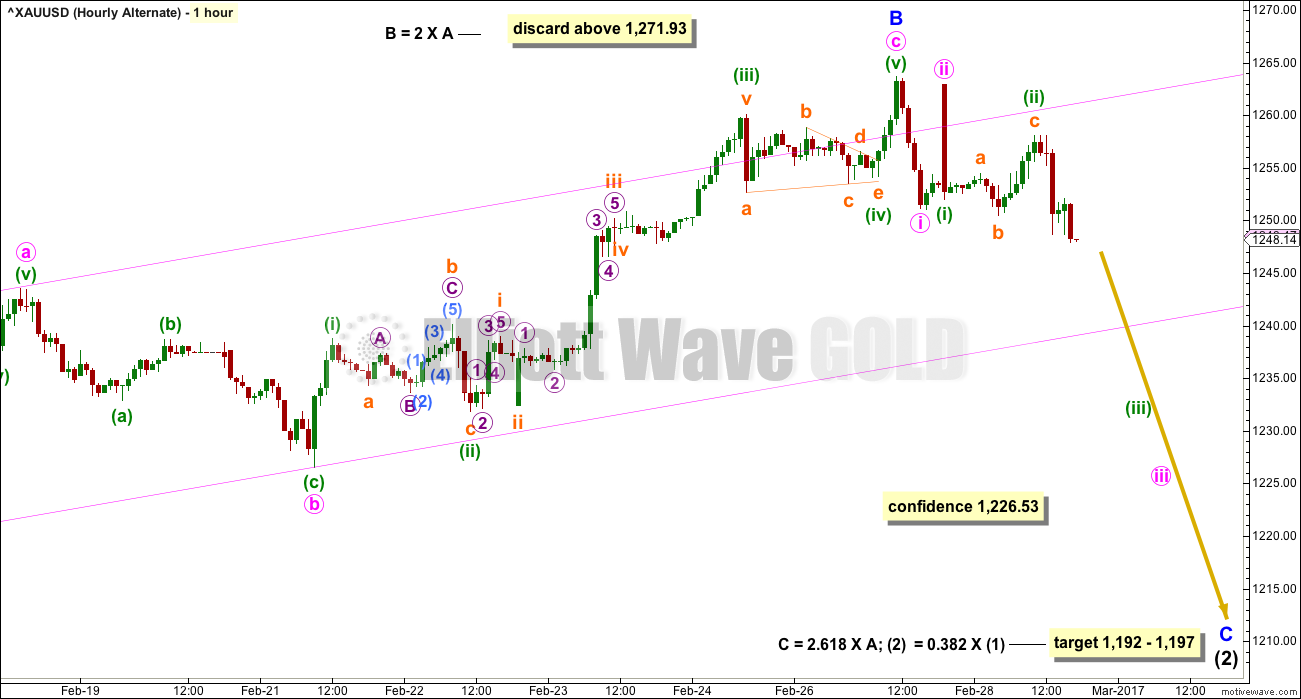
Click chart to enlarge.
1-2-3 of an impulse and A-B-C of a zigzag have exactly the same subdivisions: 5-3-5. The subdivisions of upwards movement from the low of minor wave A are labelled the same for all three hourly charts.
If price makes a new low below 1,226.53, then this would be the only wave count.
There is unfortunately no rule stating a maximum length for B waves within flat corrections. There is a convention within Elliott wave that states when the B wave reaches twice the length of the A wave the idea of a flat correction continuing should be discarded based upon a very low probability. In this instance that price point would be at 1,271.93.
This wave count now expects a strong five wave movement downwards for minor wave C. Minor wave C would be extremely likely to make at least a slight new low below the end of minor wave A at 1,217.05 to avoid a truncation and a very rare running flat.
One possible approach to trading this alternate wave count would be to exit any long positions if the base channel on the second hourly chart above is breached with downwards movement. The channel is drawn in the same way on this hourly chart. Members may consider entering short there, or reducing risk by waiting for a new low below 1,226.53. The minimum profit target would be at 1,217, with the upper edge of the range at 1,197 a reasonable target. Stops should be set just above the last swing high, and this may mean that this possible trade would have a large risk to small reward ratio. It is up to each member to judge for themselves if this is acceptable to their accounts.
Always use a stop and invest no more than 1-5% of equity on any one trade.
TECHNICAL ANALYSIS
WEEKLY CHART
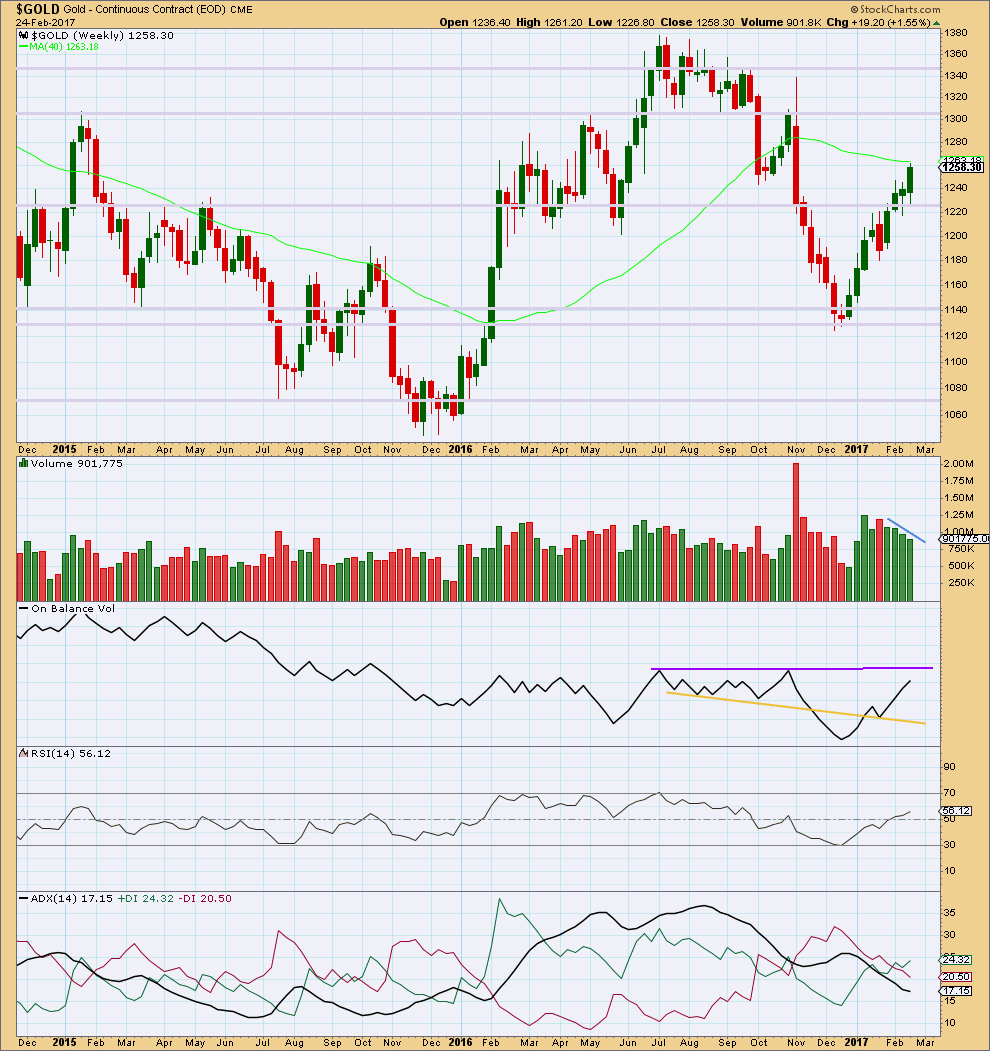
Click chart to enlarge. Chart courtesy of StockCharts.com.
The last four weekly candlesticks are all green and all show a constant decline in volume. At the weekly chart level, this supports the alternate wave count but is very concerning for the main wave count. A third wave up at multiple degrees should have good support from volume.
On Balance Volume is nearing resistance, but it is not there yet.
RSI is not overbought. There is room for price to rise further.
ADX indicates a possible trend change from down to up, but does not yet indicate there is an upwards trend.
DAILY CHART
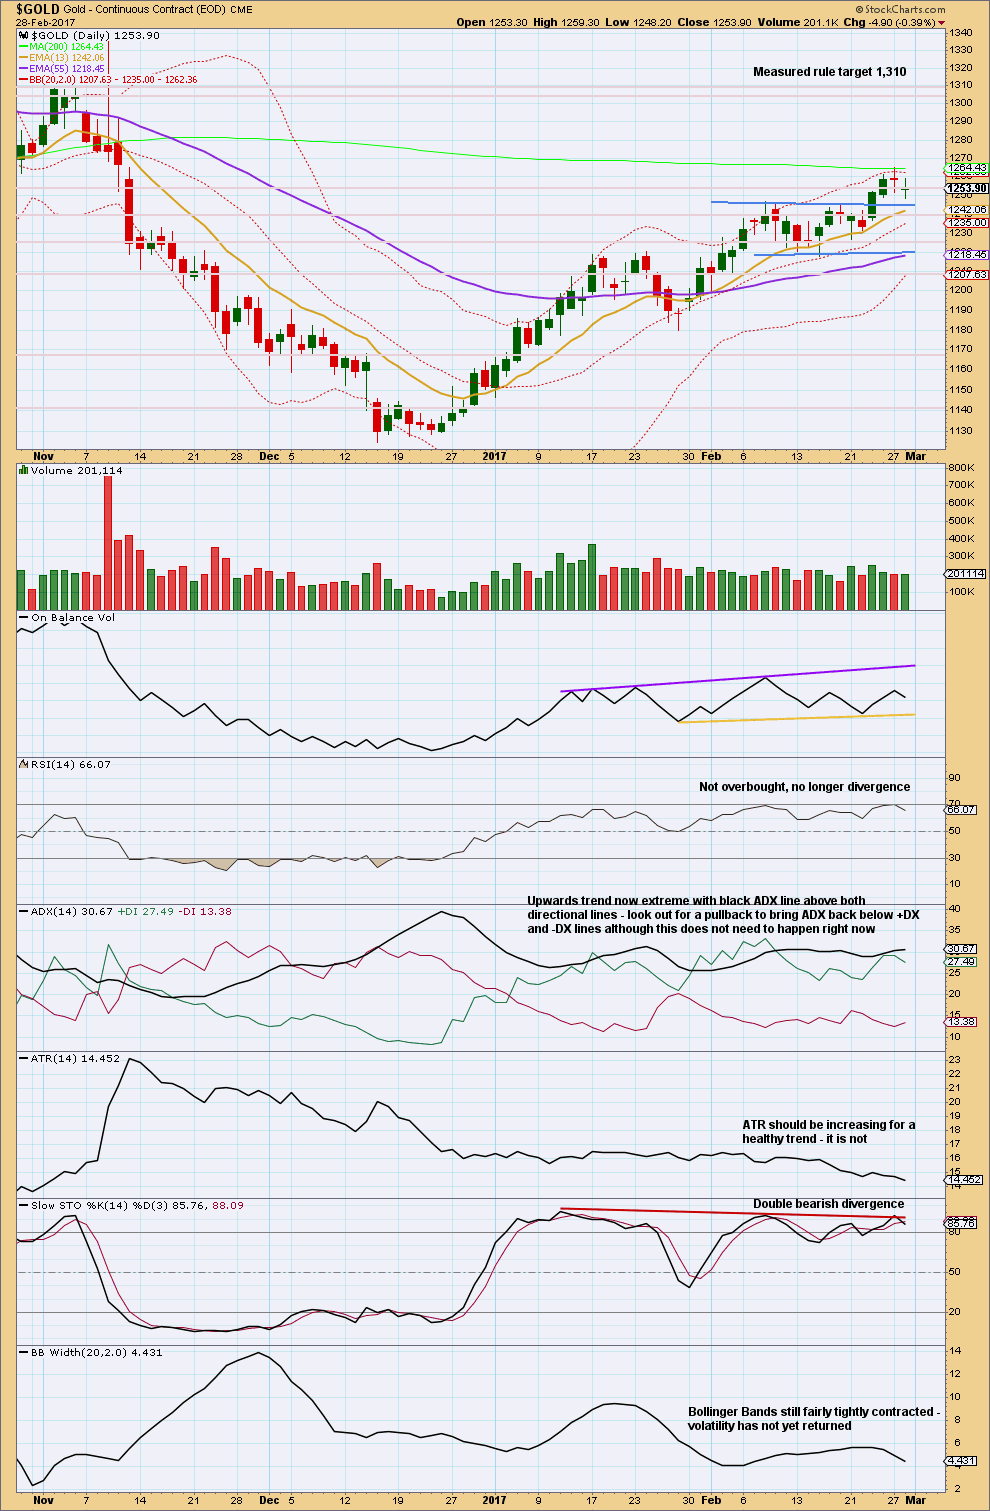
Click chart to enlarge. Chart courtesy of StockCharts.com.
A downwards day completes as a small green doji and the balance of volume was downwards today. Volume shows a very slight decline today; the market fell mostly of its own weight.
The last two doji look like a correction. They change the trend from up to neutral.
It looks like price is following a typical curve down to test support after breaking out from a consolidation, delineated by blue lines. Look for support at the upper blue line. If this holds, then the current movement may only be a small counter trend movement within a larger upwards trend.
However, ADX indicates some caution for this view. If the upwards trend is continuing, it is already extreme. It can continue for a while longer, but when ADX reads extreme we should look out for a deeper pullback or a trend change.
GDX
DAILY CHART
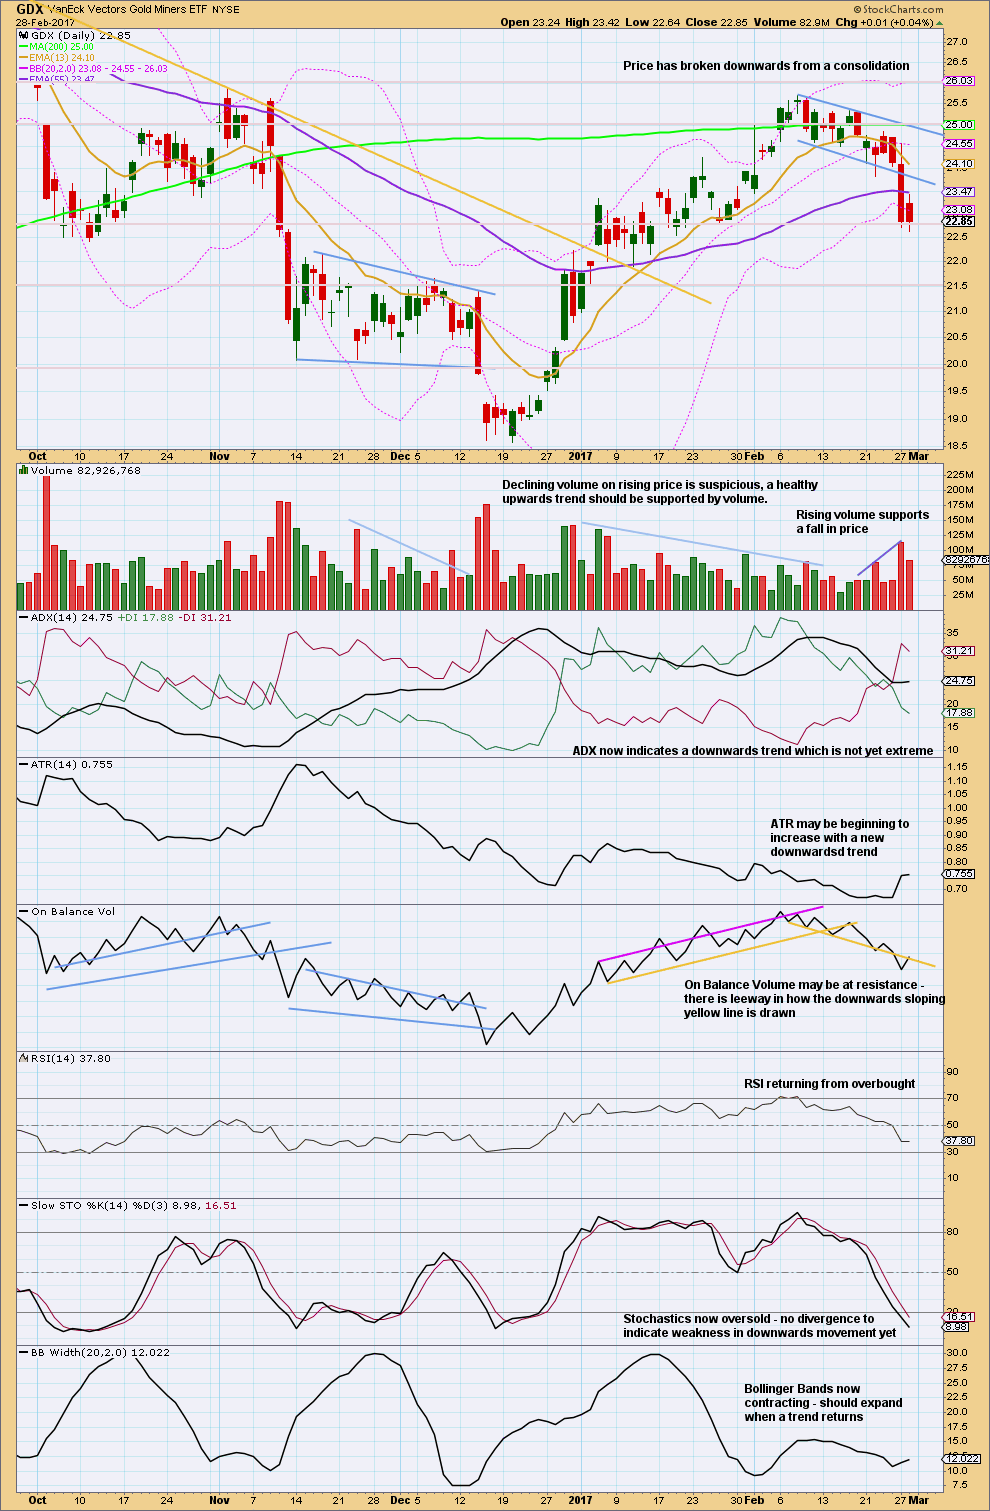
Click chart to enlarge. Chart courtesy of StockCharts.com.
Next support is about 21.50.
Today completes a downwards day but the balance of volume for the session was upwards. A decline in volume does not support upwards movement during the session, so this is read as bearish.
On Balance Volume today will be read as bearish because there is too much leeway in how the downwards sloping yellow line is drawn. For a bullish signal OBV would need to move higher tomorrow and make a potential breach of that line clearer. For now it may provide resistance.
This analysis is published @ 05:57 p.m. EST.
Options prices on JNUG are totally nuts. The ask for 1.00 strike calls for June 16 expiration is the exact same as the ask for the same strikes expiring March 17 three months earlier! 7.40 The bid for the same calls are HIGHER for the March 17 strikes at 5.90 as compared to 4.90 for June 16. Talk about mis-pricing risk!!
Pricing and wide spreads on options on many of the 3X etfs make it very difficult to go long/short w/options on these instruments. Lately, I have been sticking to buying shares and getting out intraday, as the winds can change so quickly while there is no clear trend!
VERNE…I imagine it is VERY difficult because I know you have a very good understanding of options. If they are not priced ‘fairly’, a trader has no chance of making anything based on the fast in/out management we are forced to execute using these instruments (unless of course one has confidence in a trend).
Thank you for taking the time to express some of your trades in comments. I know it helps me to learn. I would think others also gain knowledge from your efforts.
Best of luck to all of us!
Lara: “it has no support from volume”
Yes I agree when looking at the daily volume it is true.
However when one looks at the hourly chart or 2 hr chart every pish up has been with significant high volume. Means within the trading period most upticks come with heavy volume.
Internal trading volume is there.
IMO
Alternate hourly chart updated:
I’m now adding an invalidation point. This will also be a confidence point for the main hourly wave count.
Main hourly chart updated:
If that pullback was a second wave it must be over now. It’s overshot the base channel which is okay, but if it continues lower it would breach the base channel. That would see this wave count discarded.
Dreamer–sending my respect and appreciation for your GDX charts.
Thanks Davey. Lara is a good teacher.
Miner seasonality down until mid March
Same for Gold. This week is important
Gold and miners are likely not going up until they “absorb” and embrace a Fed rate hike in March. With 2 weeks to go before the Fed announcement, odds of a hike are 64.6%. We have seen gold go up when rates go up, so a rate hike can be good for gold.
CME group Fed watch tool here:
http://www.cmegroup.com/trading/interest-rates/countdown-to-fomc.html
GDX correction may last another few days.
Intermediate wave 1 was a Fib 34 days.
So far, Intermediate wave 2 is a Fib 13 days. If it takes another 7 days to complete, that would make it a Fib 21 days, although it will likely finish sooner than that.
https://www.tradingview.com/x/kUelF1HA/
Another 7 days actually looks pretty good to me. It still has minute iv then v to complete.
Nice wave count Dreamer. Looks good.
I just want to check one thing: within minor B, does minute c move above the end of minute a?
Good eye. No, it’s a .03 truncation. I don’t like the truncation, but thought it could be acceptable. Also, Minute C of Minor B clearly looks like a “5”.
I could relabel the structure of Intermediate 2 as a W-X-Y to alleviate the truncation, but so far I think the A-B-C seems to fit better as I expect another lower low for Minor C.
Either way, that whole wave labeled Minor B looks corrective, so I think that is where the next wave down (Minor C) starts.
Thoughts?
I agree with you. The truncation is very small, and minute c does have a nice five wave look to it.
However, I’m really careful not to read too much into what the structures look like for individual equities. They just don’t have sufficient volume for reliably good looking EW structures.
This is why I’m so cautious:
Some years ago I used to analyse AAPL on a regular basis, as in once to twice a week or so. It had a big fall in price from September 2012 to April 2013. I analysed it carefully and concluded it was a good looking five wave impulse. So I did not expect a new high above the start of it. But on 20th of August 2014 it was invalidated.
What had looked so much like a five, was most likely a three 🙁
It was at that point that I learned the hard way that the warning in Frost and Prechter about volume and Elliott wave should be taken seriously.
And it’s one big reason why I don’t update my GDX count so often. I’m not convinced that it is time well spent. I would prefer a classic TA approach for individual equities.
So after the long story, I’d accept truncations for GDX (it does seem to do them a bit), I’d not get too hung up on fives or threes unless it’s REALLY obvious, and I’d be flexible.
The running flat for minor B must necessarily reduce the probability of the count, that part at least. I’m wondering if minor A isn’t yet done? What if instead of the running flat there’s a series of overlapping first and second waves? Now moving through a third wave?
Lara, thanks for the lengthy explanation. I learn all the important little things from your “sidebar” posting topics like this and copy them into a notes file that I keep… and yes, I have been tricked into thinking a 3 is a 5, etc with the hourly GDX count, but I still think it is helpful to do the work for my trading and hopefully others on this site.
Anyway, I looked at it some more and finally found a valid solution with no truncation.
Minor B is a combination zig-zag – x wave – expanded flat. Minuette wave C of the flat exceeds minuette wave A by .01.
I think this works, but will watch out for the nested 1-2 option if gold doesn’t appear to be done with it’s correction and GDX looks done.
https://www.tradingview.com/x/EnoXN3Nh/
Hey I really like that solution much better. It has a nice fit, avoids a truncation, the combination is sideways and the proportions are good.
Nicely done Dreamer. Nicely done.