
Last week again expected upwards movement for Silver, which is again what has happened.
Summary: Look for support for a pullback here at the lower edge of the blue base channel on the daily chart. If price again comes down to touch that line, use it as an opportunity to enter an upwards trend.
Always follow my two Golden Rules:
1. Always use a stop on every trade.
2. Do not invest more than 1-5% of equity on any one trade.
New updates to this analysis are in bold.
Last monthly chart is here.
ELLIOTT WAVE COUNT
WEEKLY CHART
Click chart to enlarge.
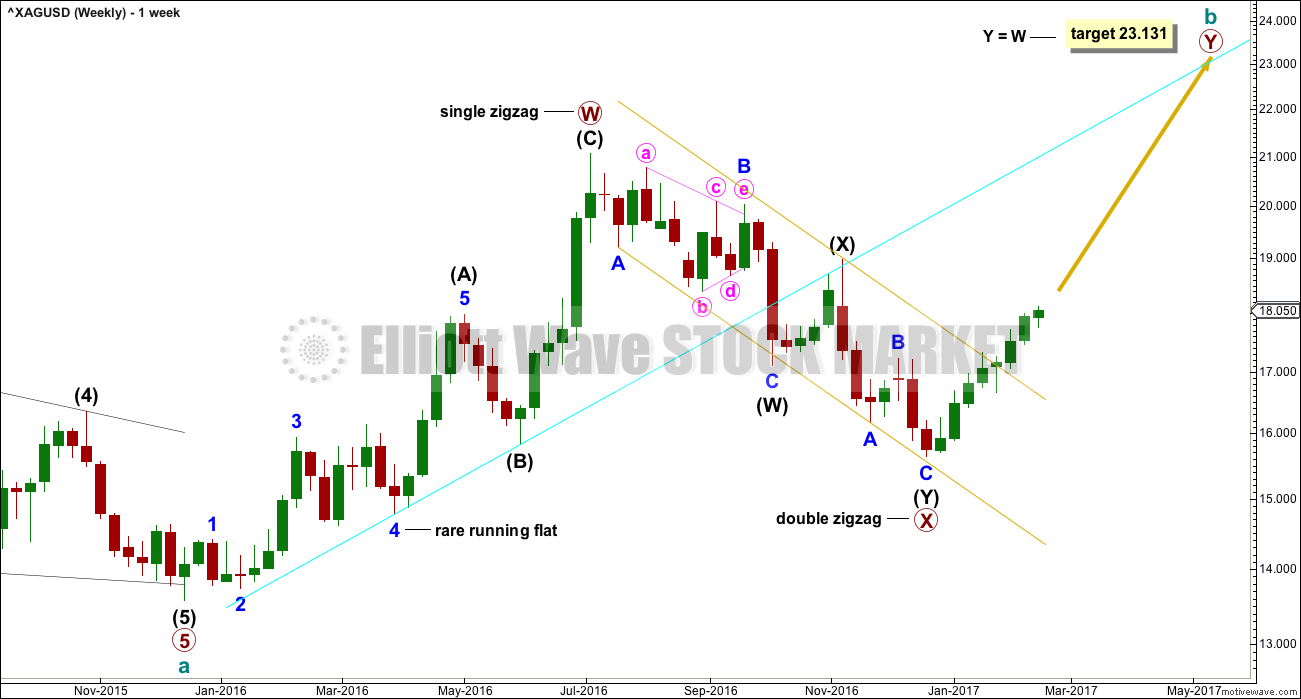
The upwards wave labelled primary wave W is seen here as a complete zigzag. It will also fit as an impulse and this is seen on the alternate weekly chart below.
If primary wave W is a zigzag, then within intermediate wave (A) the correction labelled minor wave 4 is a rare running flat. This reduces the probability of this wave count. For this reason the alternate below is published. It makes no difference to expected direction nor to the target.
The channel about primary wave X has been breached. The upper edge of this channel should now provide support for any deep pullback here.
ALTERNATE WEEKLY CHART
Click chart to enlarge.
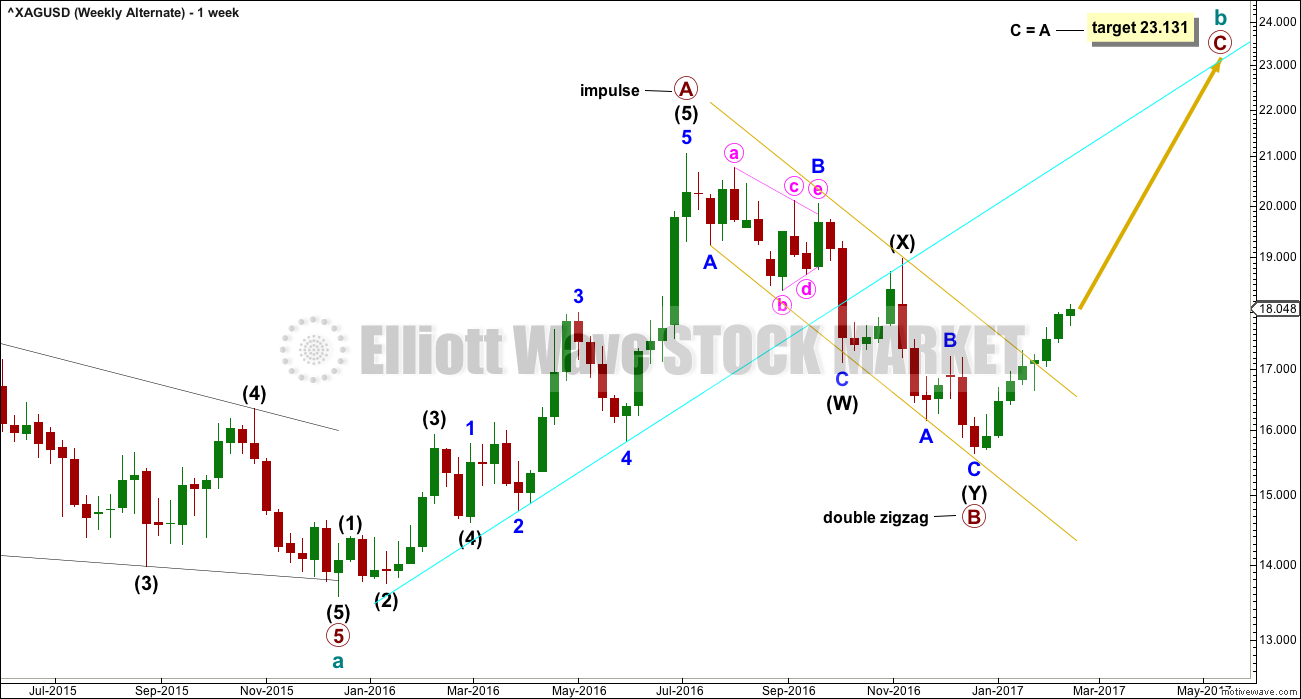
Upwards movement labelled here as primary wave A will fit neatly as a five wave impulse. Within primary wave A, it is intermediate wave (5) that is extended.
The problem of a running flat is resolved. Although this is labelled as an alternate wave count, it may have a higher probability than the main wave count. But it makes no difference at this stage to either expected direction or the target calculation.
Primary wave B is a complete double zigzag.
Primary wave C is most likely to move at least slightly above the end of primary wave A to avoid a truncation. The most likely target for primary wave C would be equality in length with primary wave A.
DAILY CHART
Click chart to enlarge.
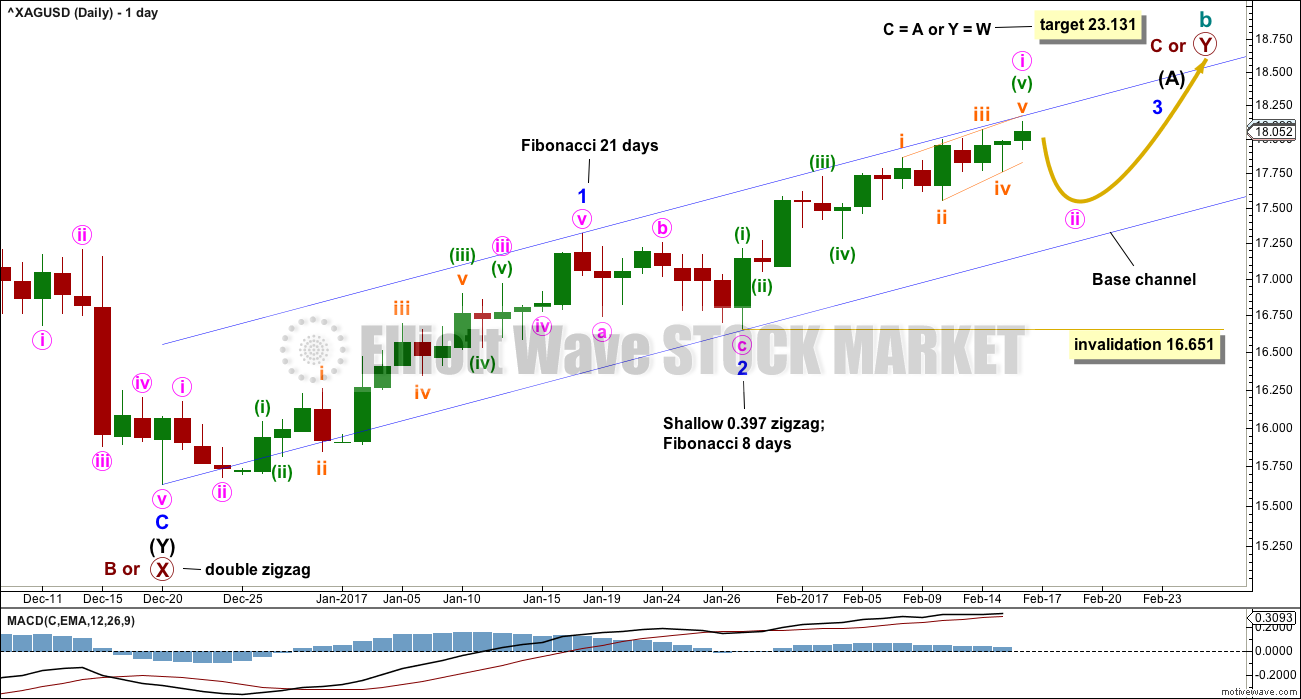
Minor wave 2 may have been a brief and shallow correction. Price has now reached up close to the target given in last week’s analysis for minor wave 3 to reach equality in length with minor wave 1. While it is possible that minor wave 3 could be over here, it looks more likely that it is incomplete. Minor wave 3 should have the power to break above the upper edge of the blue base channel and has not done that yet.
A new target for minor wave 3 would be at 19.368 where it would reach 1.618 the length of minor wave 1.
Within minor wave 3, it may be that minute wave i has ended today or will end tomorrow. Within minute wave i, minuette wave (v) fits best as an ending contracting diagonal. If this is correctly labelled, then the next pullback should be relatively deep.
Minute wave ii should find support at the lower edge of the blue base channel. Lower degree corrections should not breach base channels drawn about first and second waves one or more degrees higher. This is almost always (not always) how price behaves.
Minute wave ii may not move beyond the start of minute wave i below 16.651.
TECHNICAL ANALYSIS
WEEKLY CHART
Click chart to enlarge. Chart courtesy of StockCharts.com.
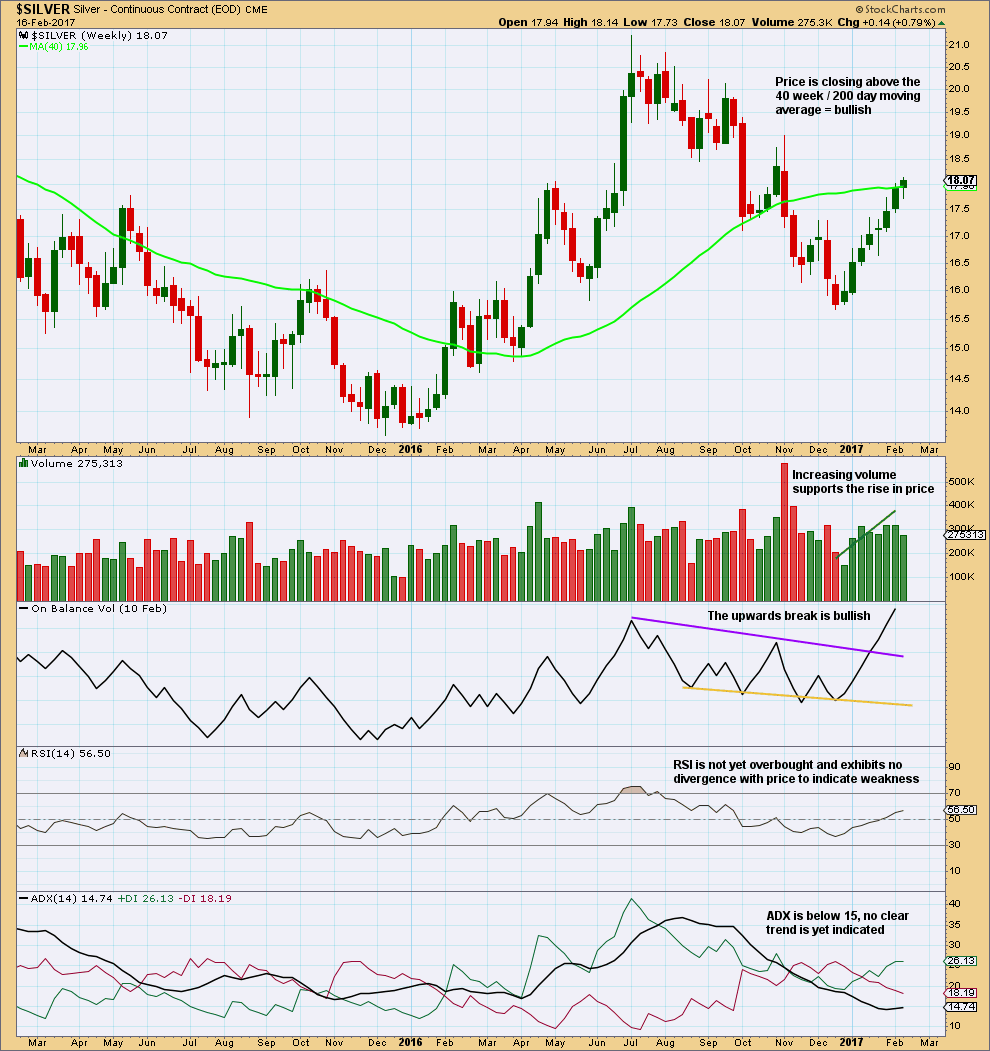
If this current week closes green after the final session for Friday, then that would make eight green weekly candlesticks in a row for Silver. It seems very reasonable to expect a red weekly candlestick next week, or the week after at the most.
Up to and including last week, volume continues to increase as price moves higher.
DAILY CHART
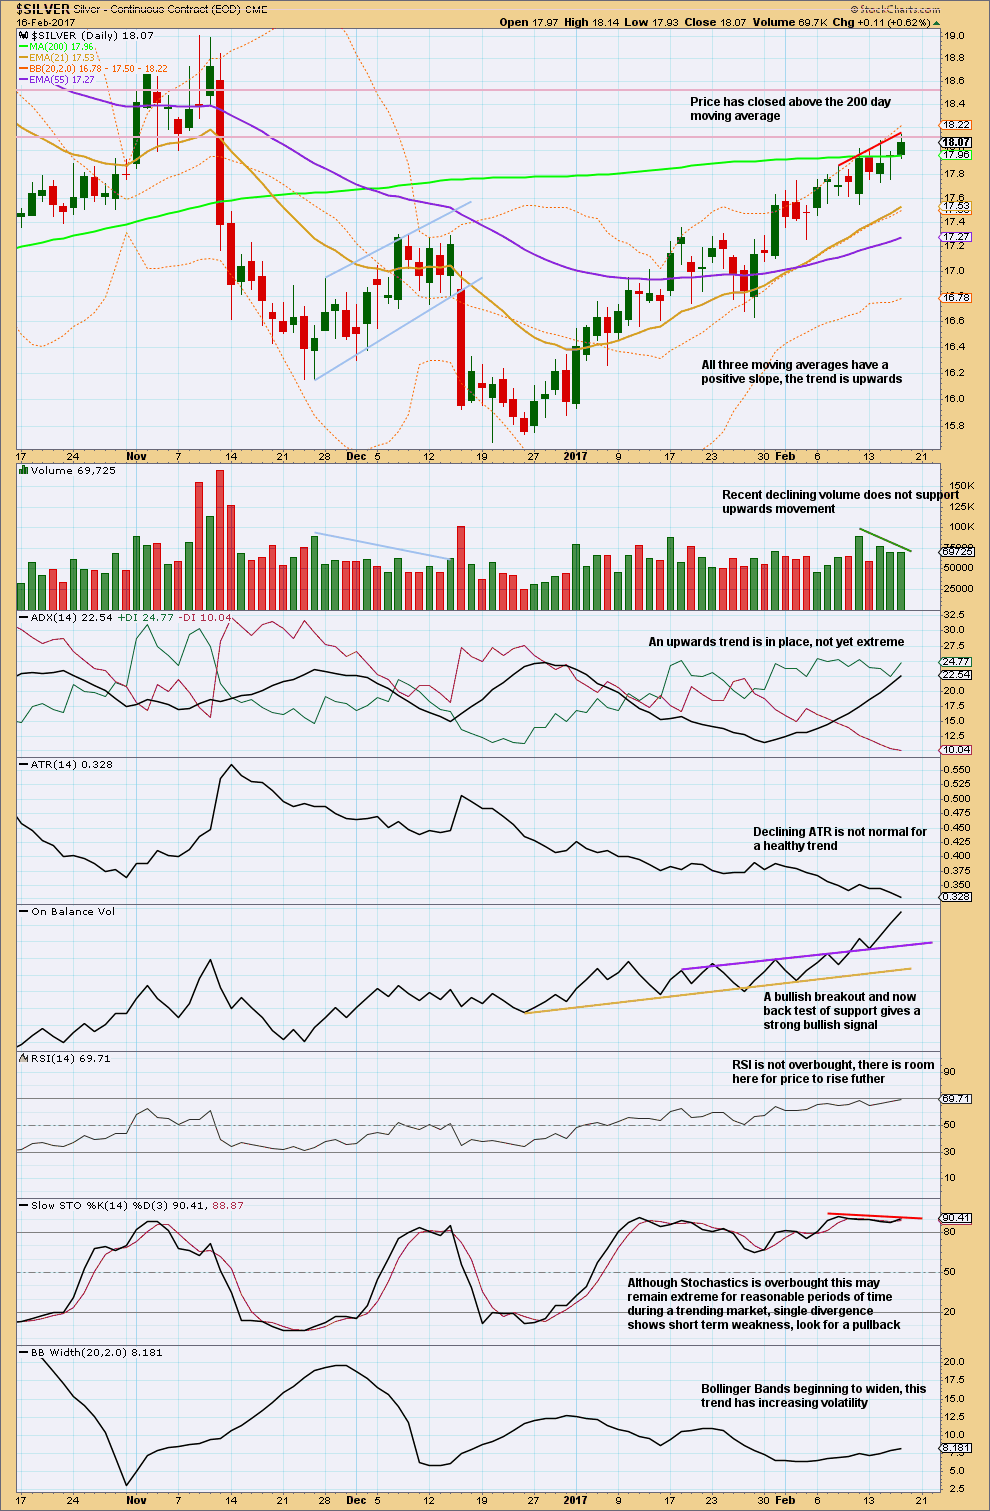
Click chart to enlarge. Chart courtesy of StockCharts.com.
Declining volume, declining ATR, and divergence with Stochastics is bearish.
ADX, On Balance Volume, RSI, and widening Bollinger Bands are bullish.
This analysis is published @ 09:34 p.m. EST.
The new banner pic is taken from my window right beside my work desk. I use binoculars to see when it’s time to go get some surf 🙂
Great picture for us, reality for you. You sure live in beautiful surroundings!
I sure do Dreamer, I live in paradise and I’m thankful for it 🙂
Lara, this count seems to align better with the Gold alternate. Is there a count that better aligns with the main Gold count?
Like maybe the current high is the end of Minor 1, suggesting that a deeper correction is due.
Since you like to have Gold be the leader, wouldn’t it make sense that Silver’s count also calls for a deeper correction?
Just thinking out load. I always like to look deeper when the counts of Gold, Silver and GDX don’t seem to be in alignment.
No, the Gold alternate expects a big strong move up here. Silver expects a pullback.
The depth of the corrections is the difference. And that’s okay. They’ll both be expected to last several days at least.
Bottom line: if the direction expected is the same don’t worry. These markets have different magnitudes in movements.