
Last week expected a pullback for Silver.
Price has so far for the week moved sideways, with a lower high and a lower low.
Summary: A deeper pullback is possible here. If price breaks below the lower edge of the base channel on the alternate daily chart, then expect a pullback to end about 16.545. First watch how price behaves if it gets down to the lower edge of the base channel.
Use this pullback as an opportunity to join an upwards trend.
Always follow my two Golden Rules:
1. Always use a stop on every trade.
2. Do not invest more than 1-5% of equity on any one trade.
New updates to this analysis are in bold.
Last monthly chart is here.
ELLIOTT WAVE COUNT
WEEKLY CHART
Click chart to enlarge.
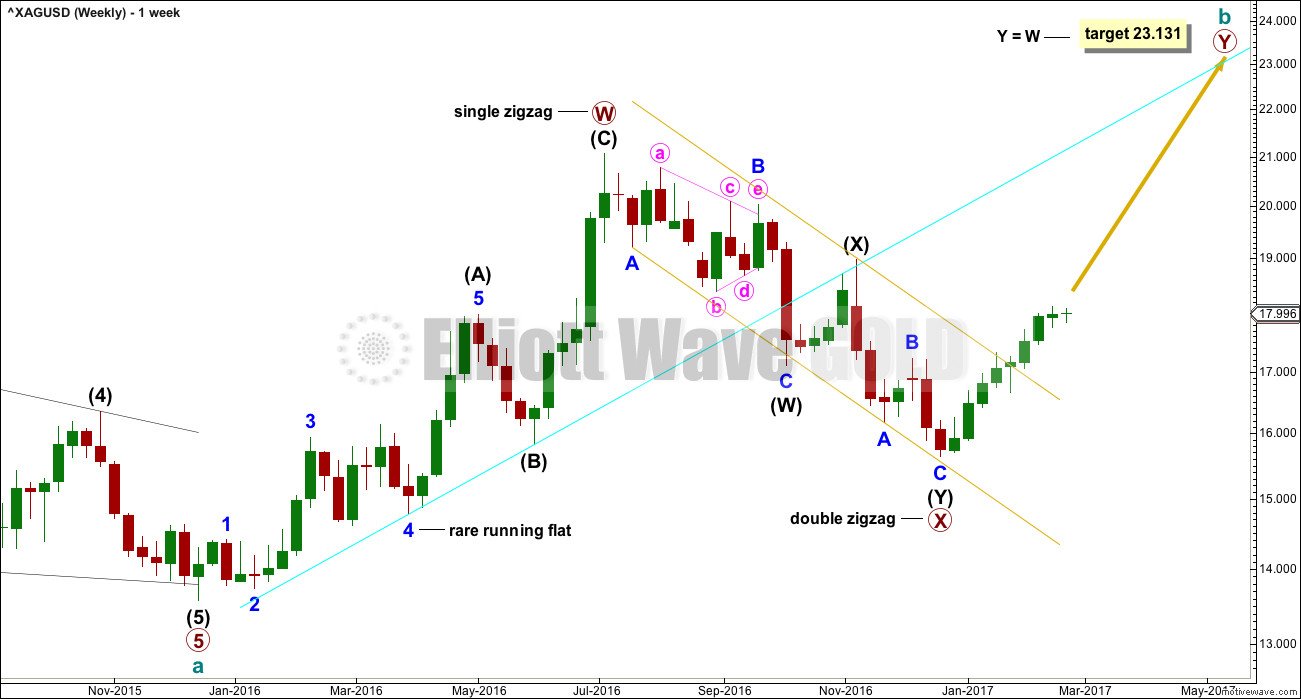
The upwards wave labelled primary wave W is seen here as a complete zigzag. It will also fit as an impulse and this is seen on the alternate weekly chart below.
If primary wave W is a zigzag, then within intermediate wave (A) the correction labelled minor wave 4 is a rare running flat. This reduces the probability of this wave count. For this reason the alternate below is published. It makes no difference to expected direction nor to the target.
The channel about primary wave X has been breached. The upper edge of this channel should now provide support for any deep pullback here.
ALTERNATE WEEKLY CHART
Click chart to enlarge.
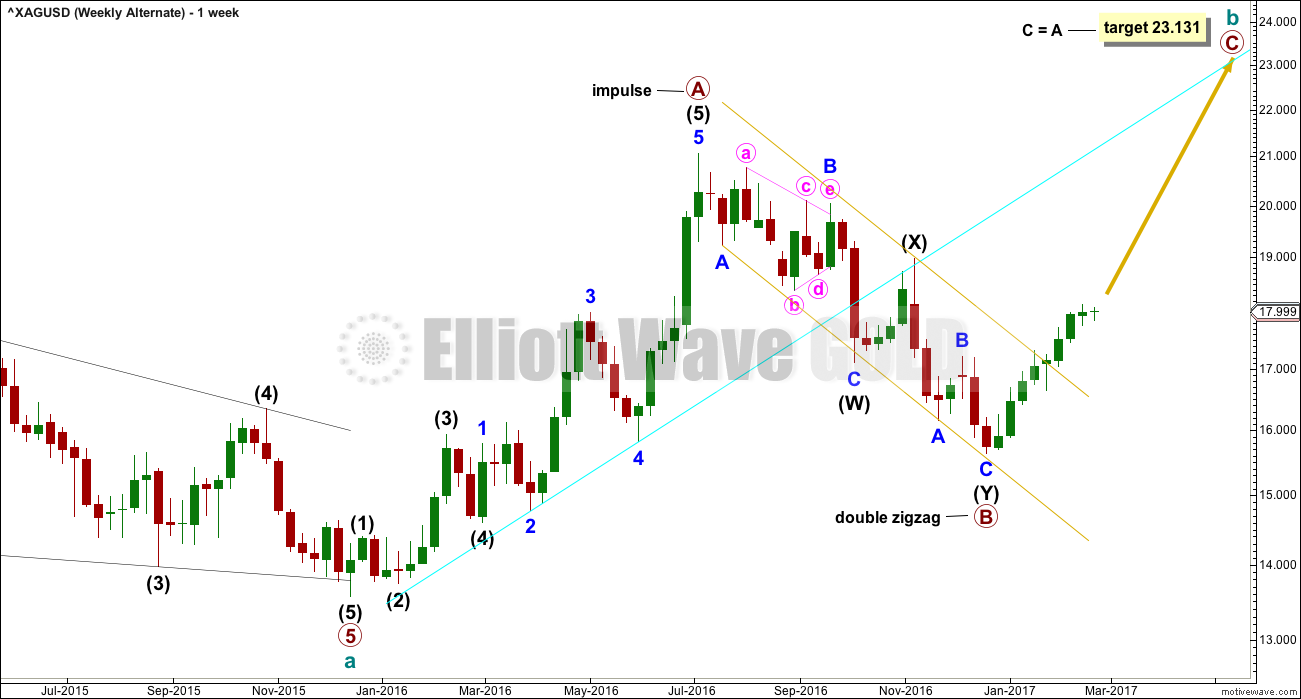
Upwards movement labelled here as primary wave A will fit neatly as a five wave impulse. Within primary wave A, it is intermediate wave (5) that is extended.
The problem of a running flat is resolved. Although this is labelled as an alternate wave count, it may have a higher probability than the main wave count. But it makes no difference at this stage to either expected direction or the target calculation.
Primary wave B is a complete double zigzag.
Primary wave C is most likely to move at least slightly above the end of primary wave A to avoid a truncation. The most likely target for primary wave C would be equality in length with primary wave A.
The two daily charts below fit for both the main and alternate weekly charts.
MAIN DAILY CHART
Click chart to enlarge.
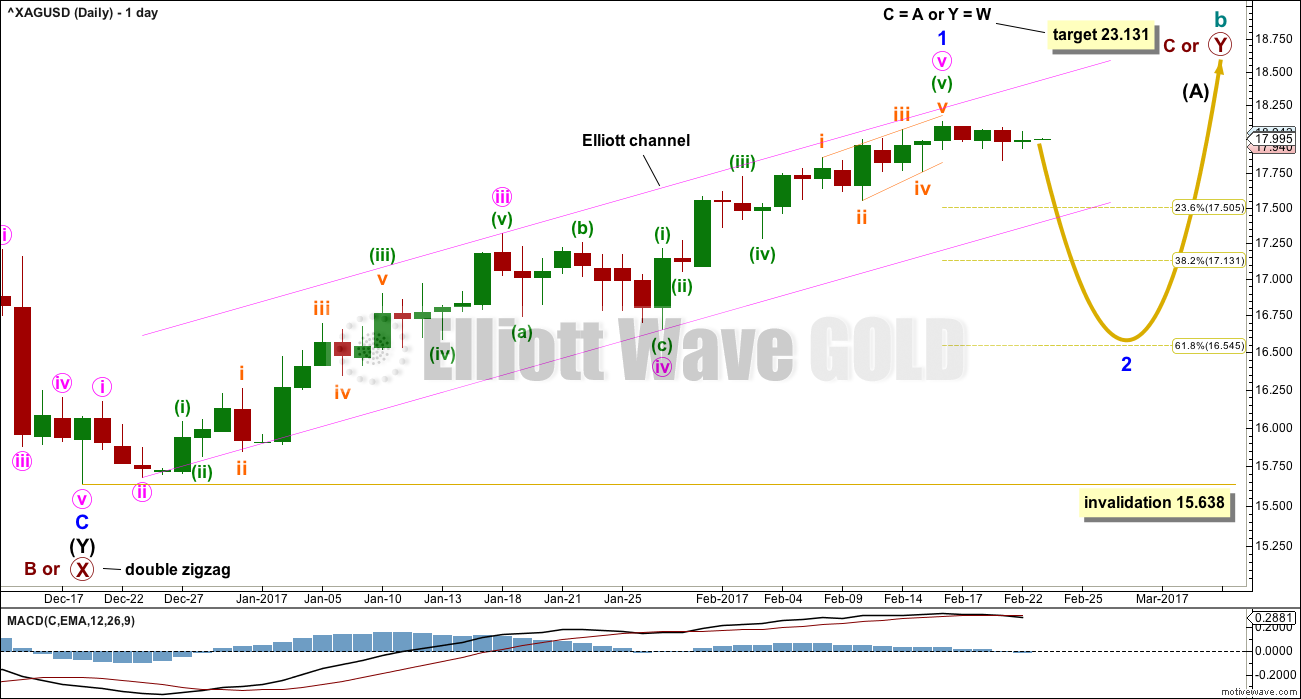
Minor wave 1 may have been over at the last high. Minor wave 2 may have begun there.
The most likely point for minor wave 2 to end would be the 0.618 Fibonacci ratio of minor wave 1.
Minor wave 2 may not move beyond the start of minor wave 1 below 15.638.
Minor wave 1 lasted 43 days. Minor wave 2 may be about even in duration for the wave count to have the right look, or it may exhibit a Fibonacci duration if it lasts 34 or 55 days.
ALTERNATE DAILY CHART
Click chart to enlarge.
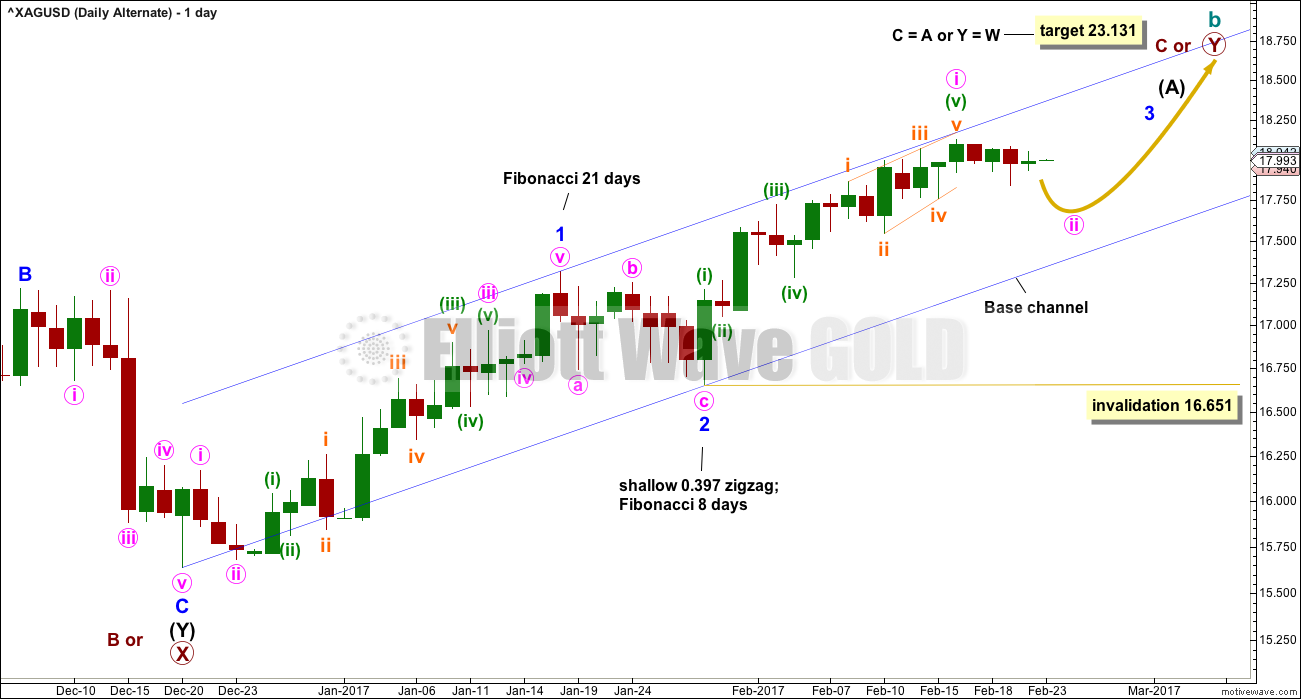
Minor wave 2 may have been a brief and shallow correction. While it is possible that minor wave 3 could be over here, it looks more likely that it is incomplete. Minor wave 3 should have the power to break above the upper edge of the blue base channel and has not done that yet.
A new target for minor wave 3 would be at 19.368 where it would reach 1.618 the length of minor wave 1.
Within minor wave 3, it may be that minute wave i has ended. Within minute wave i, minuette wave (v) fits best as an ending contracting diagonal. If this is correctly labelled, then the next pullback should be relatively deep.
Minute wave ii should find support at the lower edge of the blue base channel. Lower degree corrections should not breach base channels drawn about first and second waves one or more degrees higher. This is almost always (not always) how price behaves.
Minute wave ii may not move beyond the start of minute wave i below 16.651.
If price breached the lower edge of the base channel, then this wave count would be discarded in favour of the main wave count.
TECHNICAL ANALYSIS
WEEKLY CHART
Click chart to enlarge. Chart courtesy of StockCharts.com.
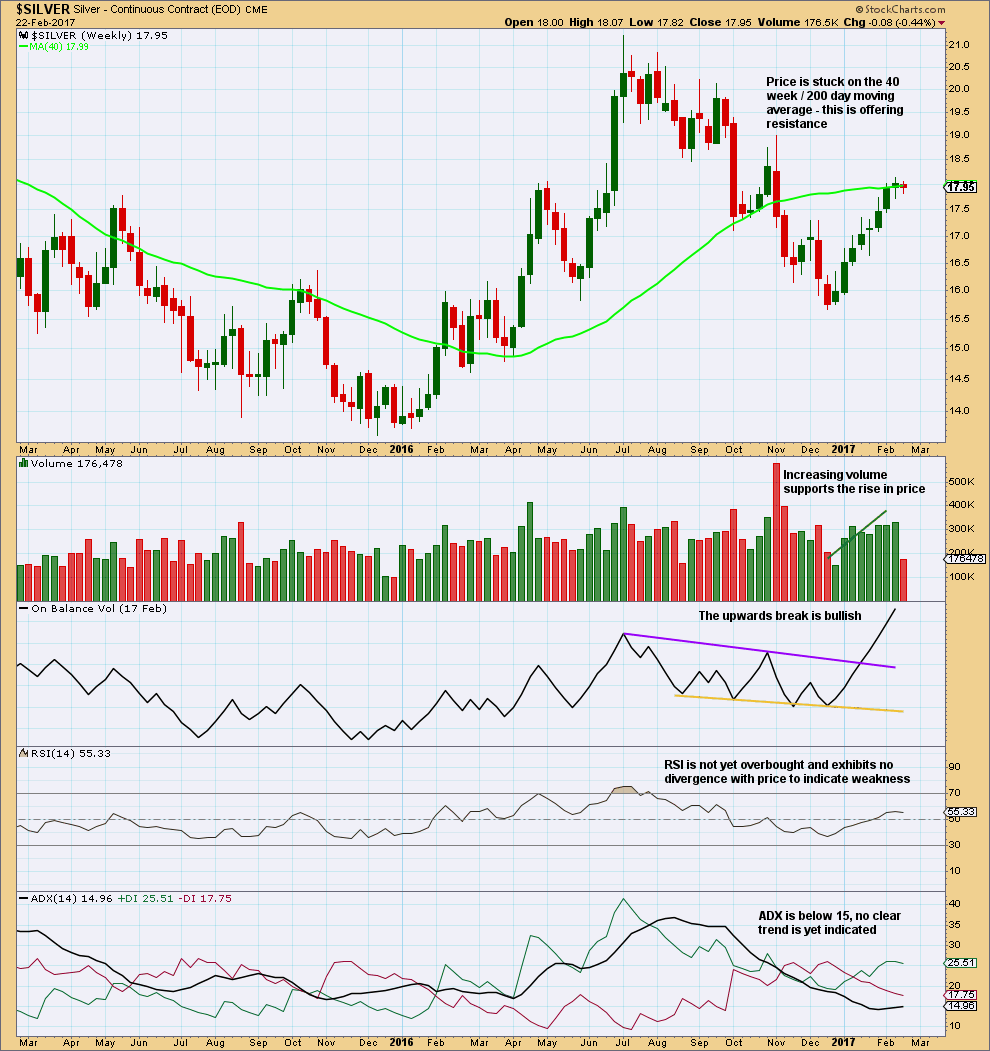
Eight green weekly candlesticks in a row is bullish, but expect some pullback after this.
For the mid to long term this chart remains very bullish.
DAILY CHART
Click chart to enlarge. Chart courtesy of StockCharts.com.
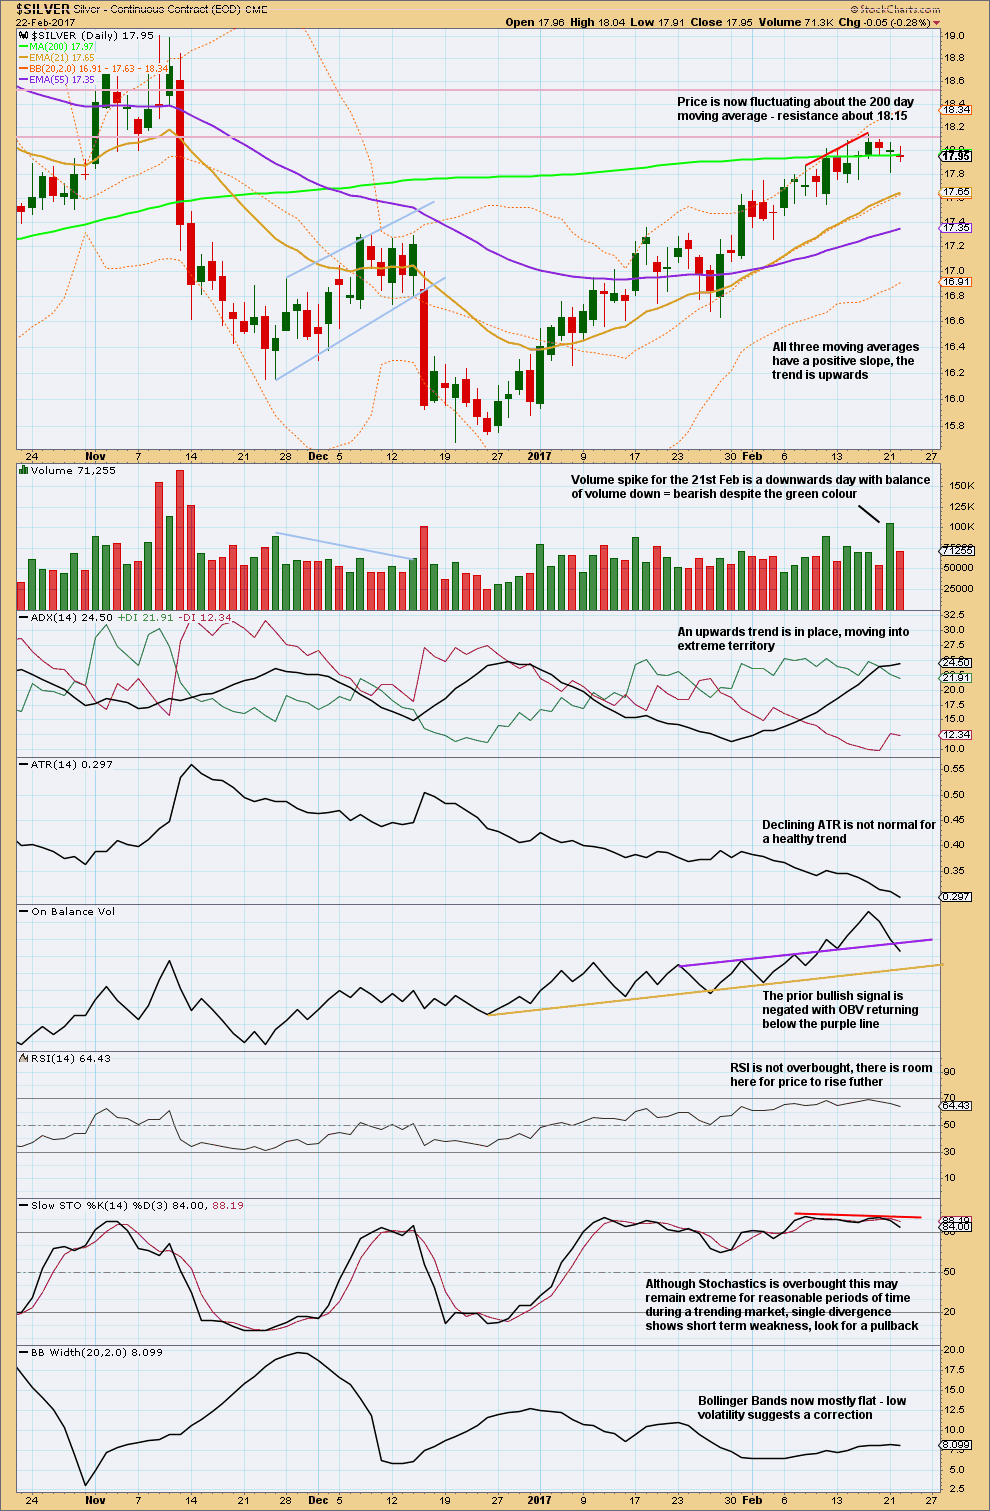
In the short term, the picture looks bearish. A deeper pullback may unfold here.
This analysis is published @ 01:03 a.m. EST on 23rd February, 2017.