
Last week expected that upwards movement would continue for Silver. This is exactly what has happened.
Summary: The target for upwards movement is at 18.33.
New updates to this analysis are in bold.
Last monthly chart is here.
ELLIOTT WAVE COUNT
WEEKLY CHART
Click chart to enlarge.
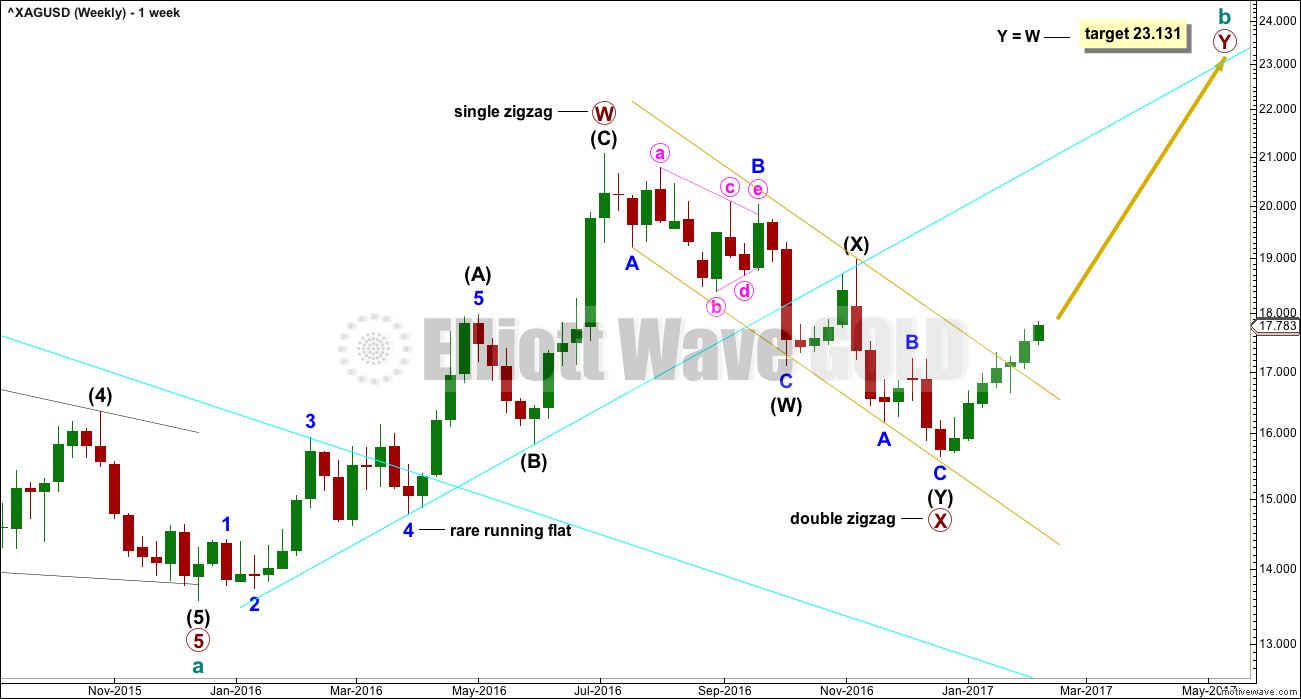
The upwards wave labelled primary wave W is seen here as a complete zigzag. It will also fit as an impulse and this is seen on the alternate weekly chart below.
If primary wave W is a zigzag, then within intermediate wave (A) the correction labelled minor wave 4 is a rare running flat. This reduces the probability of this wave count. For this reason the alternate below is published. It makes no difference to expected direction nor to the target.
The channel about primary wave X has been breached. The upper edge of this channel should now provide support for any deep pullback here.
ALTERNATE WEEKLY CHART
Click chart to enlarge.
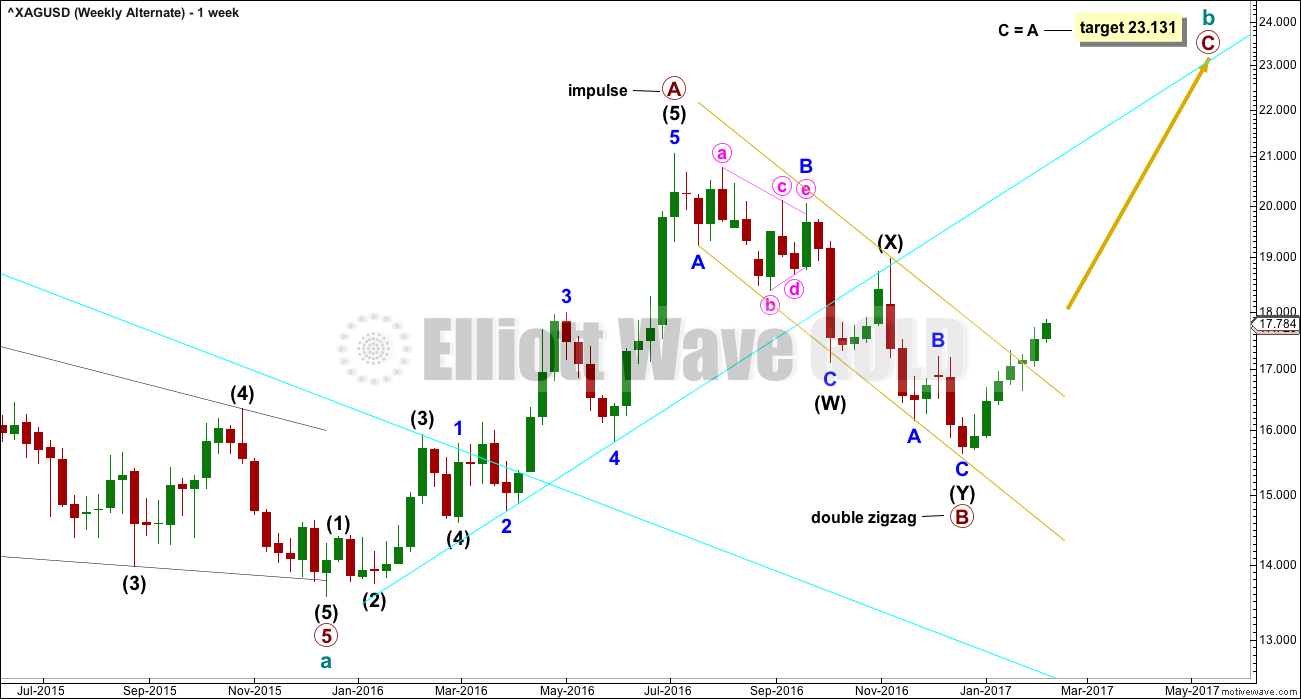
Upwards movement labelled here as primary wave A will fit neatly as a five wave impulse. Within primary wave A, it is intermediate wave (5) that is extended.
The problem of a running flat is resolved. Although this is labelled as an alternate wave count, it may have a higher probability than the main wave count. But it makes no difference at this stage to either expected direction or the target calculation.
Primary wave B is a complete double zigzag.
Primary wave C is most likely to move at least slightly above the end of primary wave A to avoid a truncation. The most likely target for primary wave C would be equality in length with primary wave A.
DAILY CHART
Click chart to enlarge.
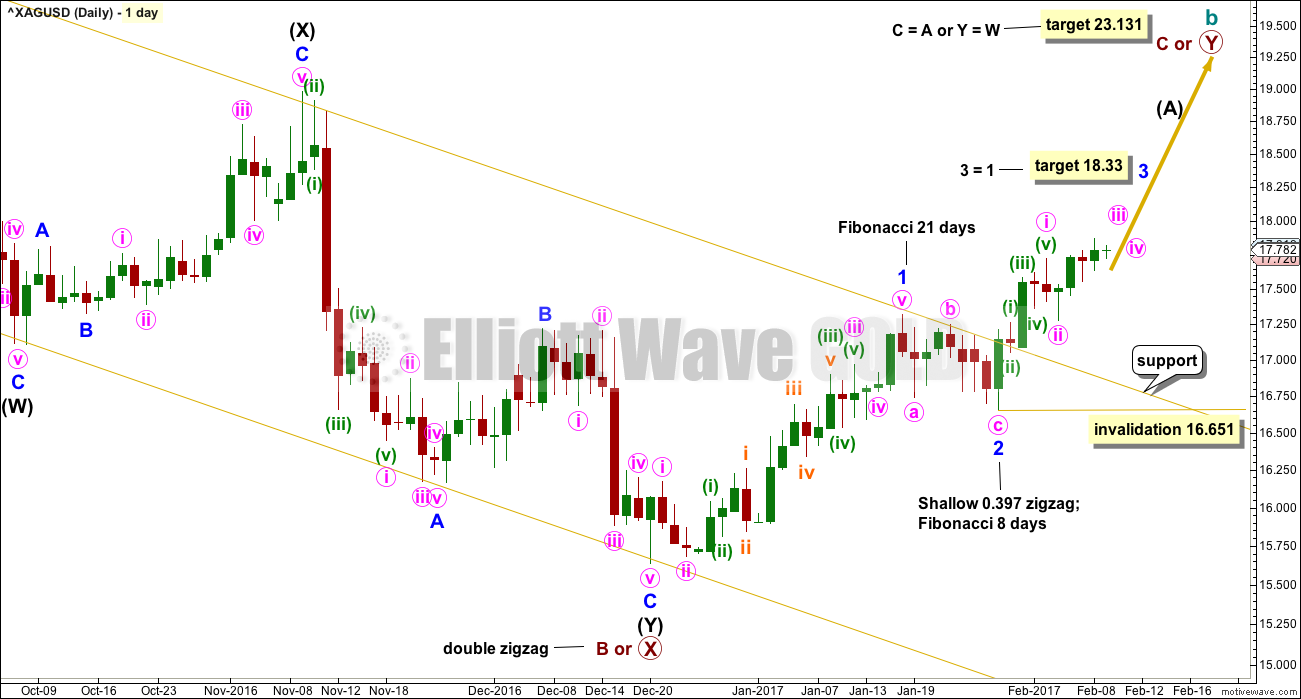
Price has broken through resistance at the upper edge of the yellow channel. This line may now offer support.
This indicates minor wave 2 may have been a brief and shallow correction. Because minor wave 2 is so shallow a target of equality with minor wave 1 is given for minor wave 3.
Within minor wave 3, no second wave correction may move beyond the start of its first wave below 16.651.
If price makes a new low below 16.651, then this main wave count will be invalidated at the daily chart level. If that happens, then the very low probability that minor wave 2 may be continuing would be considered.
TECHNICAL ANALYSIS
WEEKLY CHART
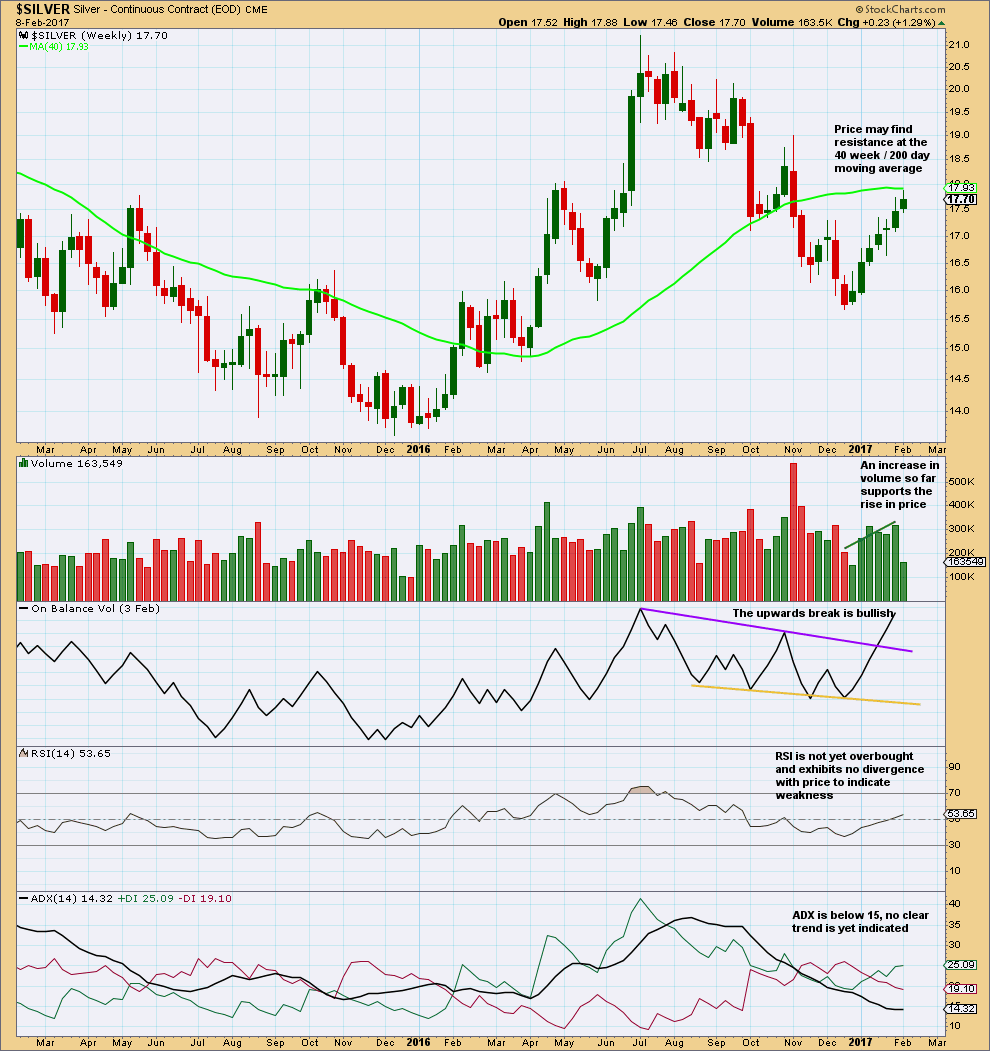
Click chart to enlarge. Chart courtesy of StockCharts.com.
Most commentary is now on the chart.
The last two weeks have longer upper wicks. This is slightly bearish. Any long positions absolutely must be protected by stops.
Overall, the weekly chart picture remains fairly bullish.
DAILY CHART
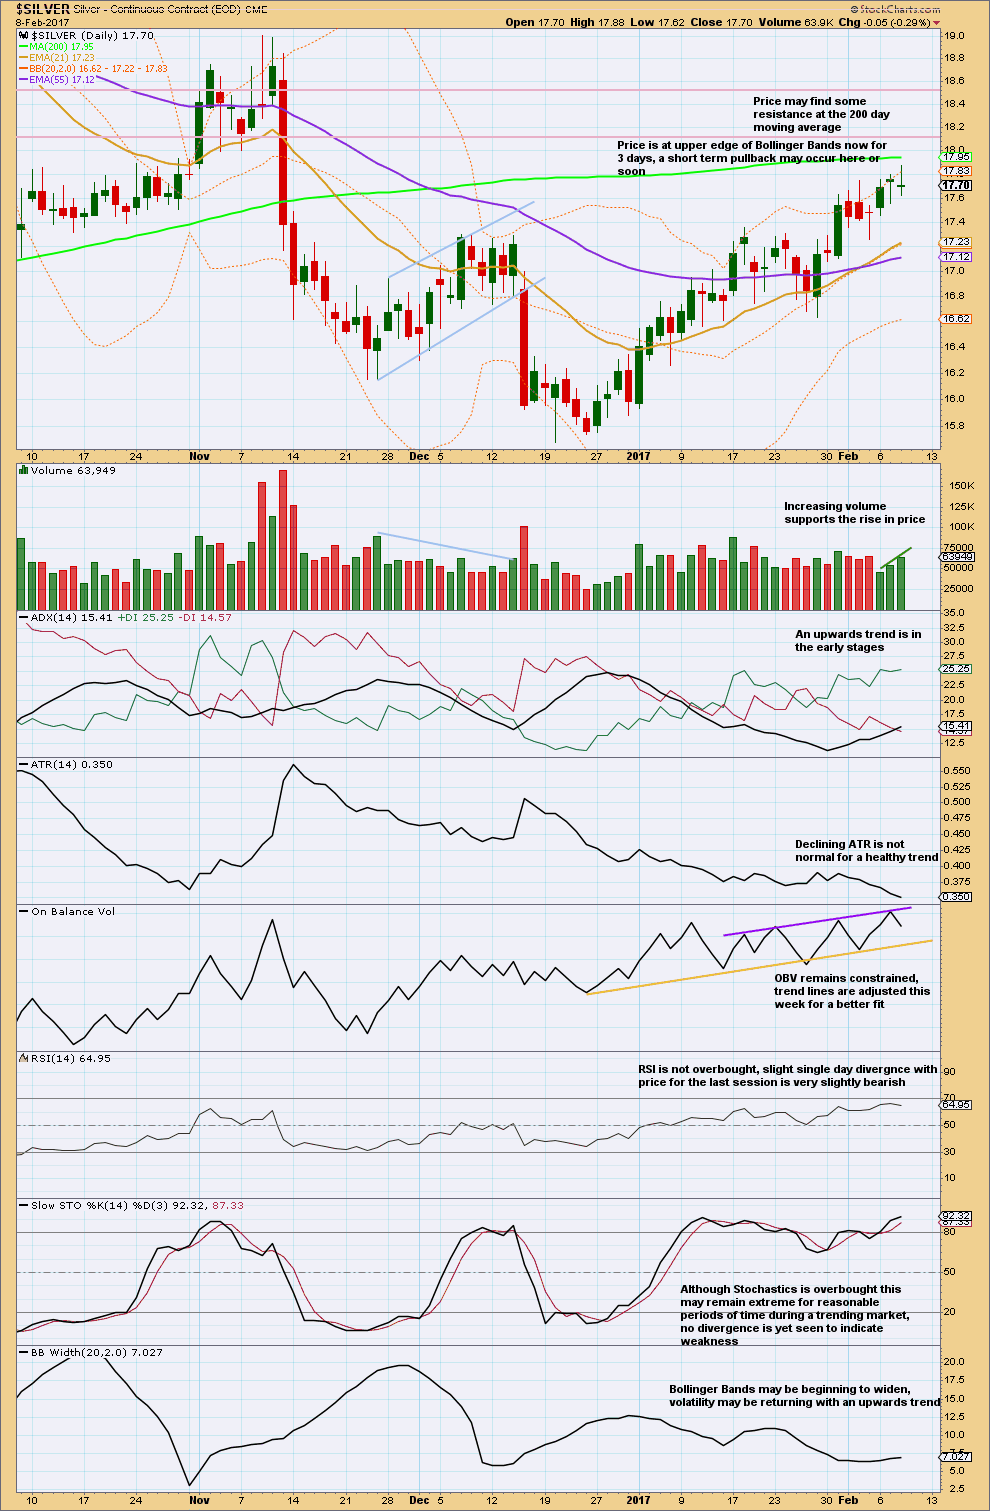
Click chart to enlarge. Chart courtesy of StockCharts.com.
Most commentary is now on the chart.
Overall, this chart is mostly bullish. The only cause for concern is the long upper wick on the last daily candlestick and declining ATR.
Next resistance is about 18.10. Support for a pullback, if one develops, is about 17.00.
This analysis is published @ 01:06 a.m. EST.
It is very interesting to see all those long upper wicks on all the weekly candles. Looks like a lot of capital being expended fighting the trend. Who could that possibly be I wonder? 🙂
LOL
I think I know who you’re talking about there Verne 🙂