
Today’s Trading Room looks at USDJPY, USD Index, NZDUSD, EURUSD and US Oil (by popular demand).
To learn what the Trading Room is about see last Trading Room analysis here.
USDJPY
TECHNICAL ANALYSIS
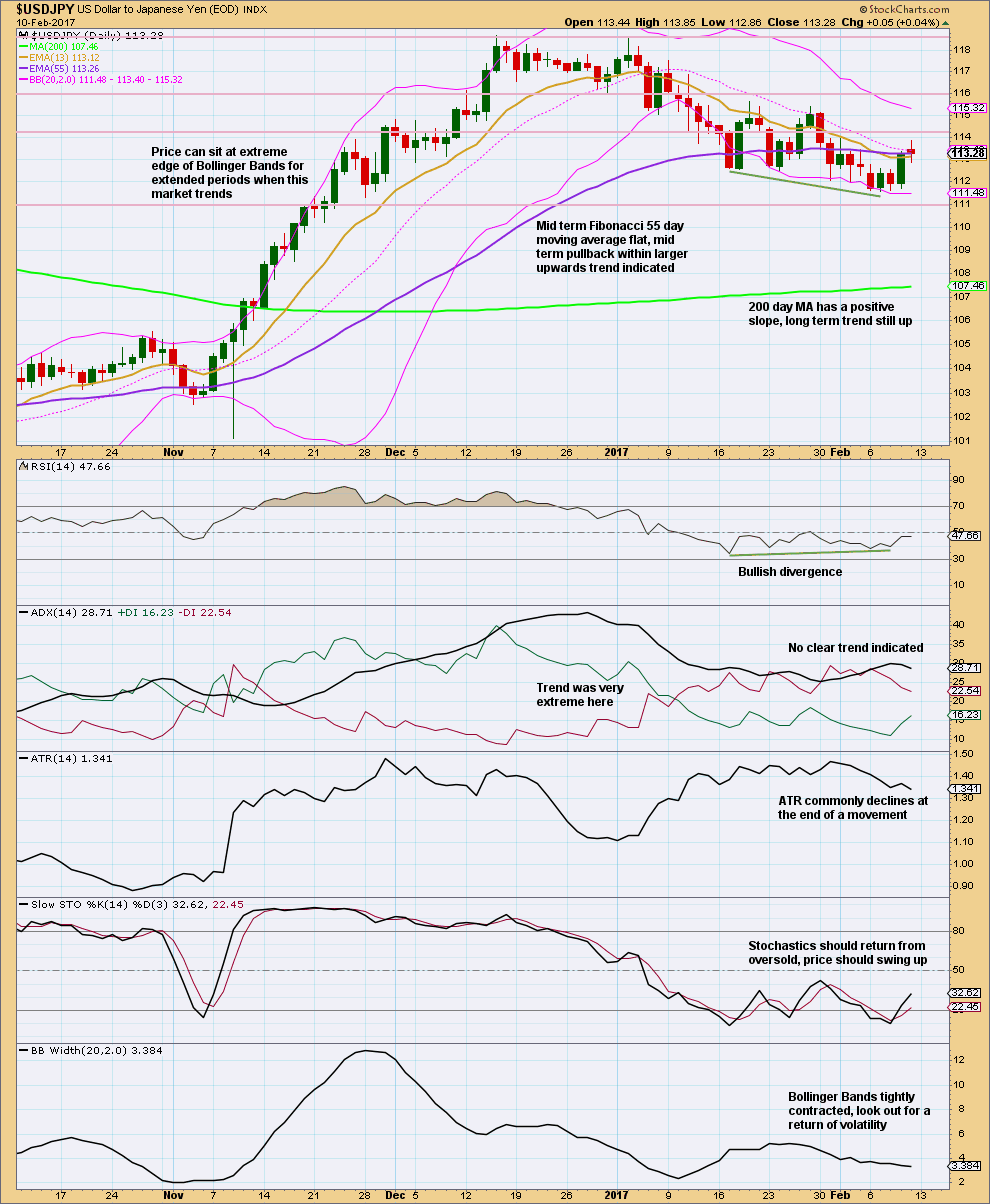
Click chart to enlarge. Chart courtesy of StockCharts.com.
For the long term, assume the trend remains up until proven otherwise. The long term 200 day moving average still has a positive slope, and the short and mid term averages are still above it.
For the mid term, price has seen a relatively deep pullback. The question will be: Is this over and will the upwards trend resume?
Price is at support just above 111 (horizontal support and resistance lines are drawn after looking back 3 years). Resistance is just above 114 and next about 116.
There is some bullish divergence with RSI, but RSI did not reach oversold for this pullback.
The risk here is that the pullback may move lower and RSI may develop double divergence with price before price turns up.
Trading advice for members only: [wlm_private “GOLD Daily YT|GOLD Daily NT|GOLD Daily NTGR|GOLD DAILY 6M NT|GOLD DAILY 6M YT|GOLD DAILY 6M NT GFR|GOLD Plus Daily YT|GOLD Plus Daily NT|OIL SILVER Weekly YT|OIL SILVER Weekly NT|GOLD Plus Daily 6M NT|GOLDPLUSDAY6M|OIL SILVER Weekly 6M NT|GOLDPLUSDAY1M|GOLDPLUSDAY1MYT|GOLDDAY6M|GOLDDAY1M|GOLDDAY1MYT|OILSILVERWEEK6M|OILSILVERWEEK1M|OILSILVERWEEK1MYT”]Accept this risk if entering long here. A breakout above resistance at 116 on an upwards day with increased volume would be an upwards breakout. Entering after a breakout would increase confidence in the trend and reduce risk.
Finding an entry to join the larger upwards trend for this market is proving tricky at this time. Give the market room to move when setting stops and be prepared to have an underwater position for a few days if entering before a classic breakout from consolidation.[/wlm_private]
ELLIOTT WAVE ANALYSIS

Click chart to enlarge.
This wave count has excellent alternation and Fibonacci ratios. There are also some close Fibonacci durations for waves.
If intermediate wave (4) moves lower, it should find strong support at the lower edge of the best fit channel. Double zigzags are reasonably common structures. Triple zigzags (labelled W-X-Y-X-Z) are very rare. If intermediate (4) is correctly labelled as a double zigzag, then the probability that it is over here is very high.
VOLUME ANALYSIS
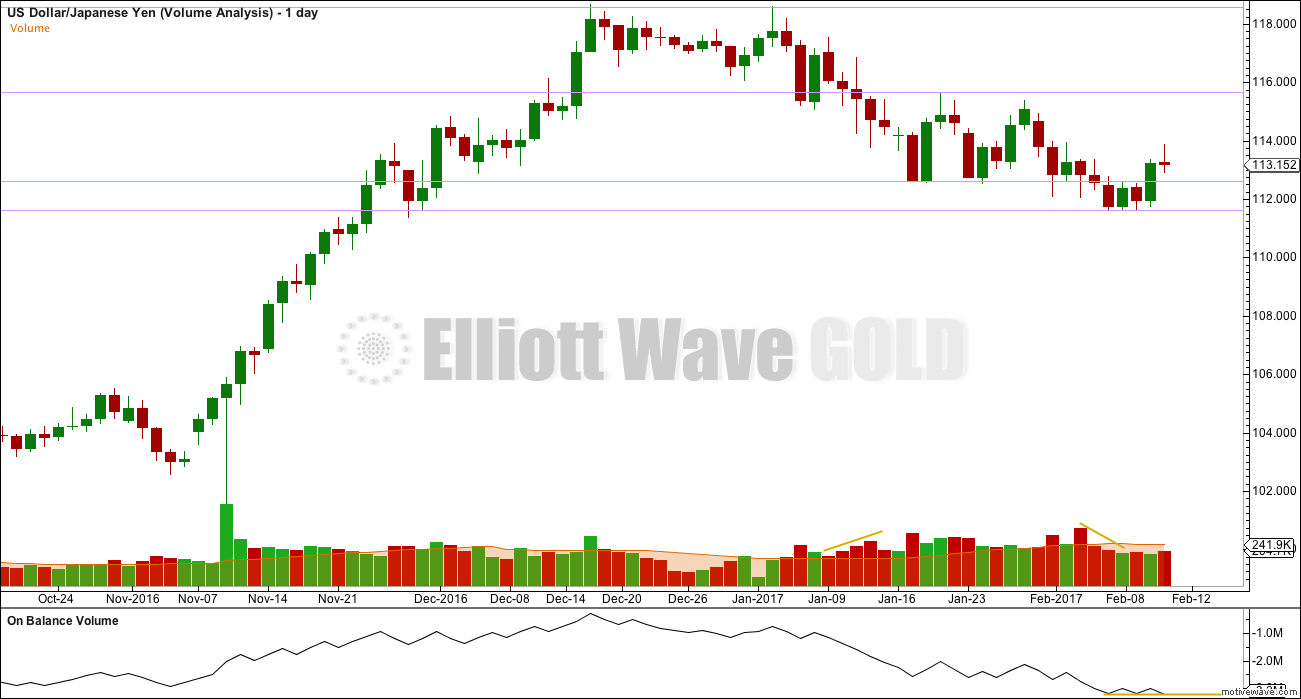
Click chart to enlarge.
Volume increased during the middle portion of the pullback, and now at the last low volume declined as price fell; the market fell of its own weight. This points to a tired trend. Price certainly could move lower here, but the probability of a low in place has slightly increased.
On Balance Volume is at support. If it breaks below the yellow line, that would be a bearish signal.
USD INDEX
TECHNICAL ANALYSIS
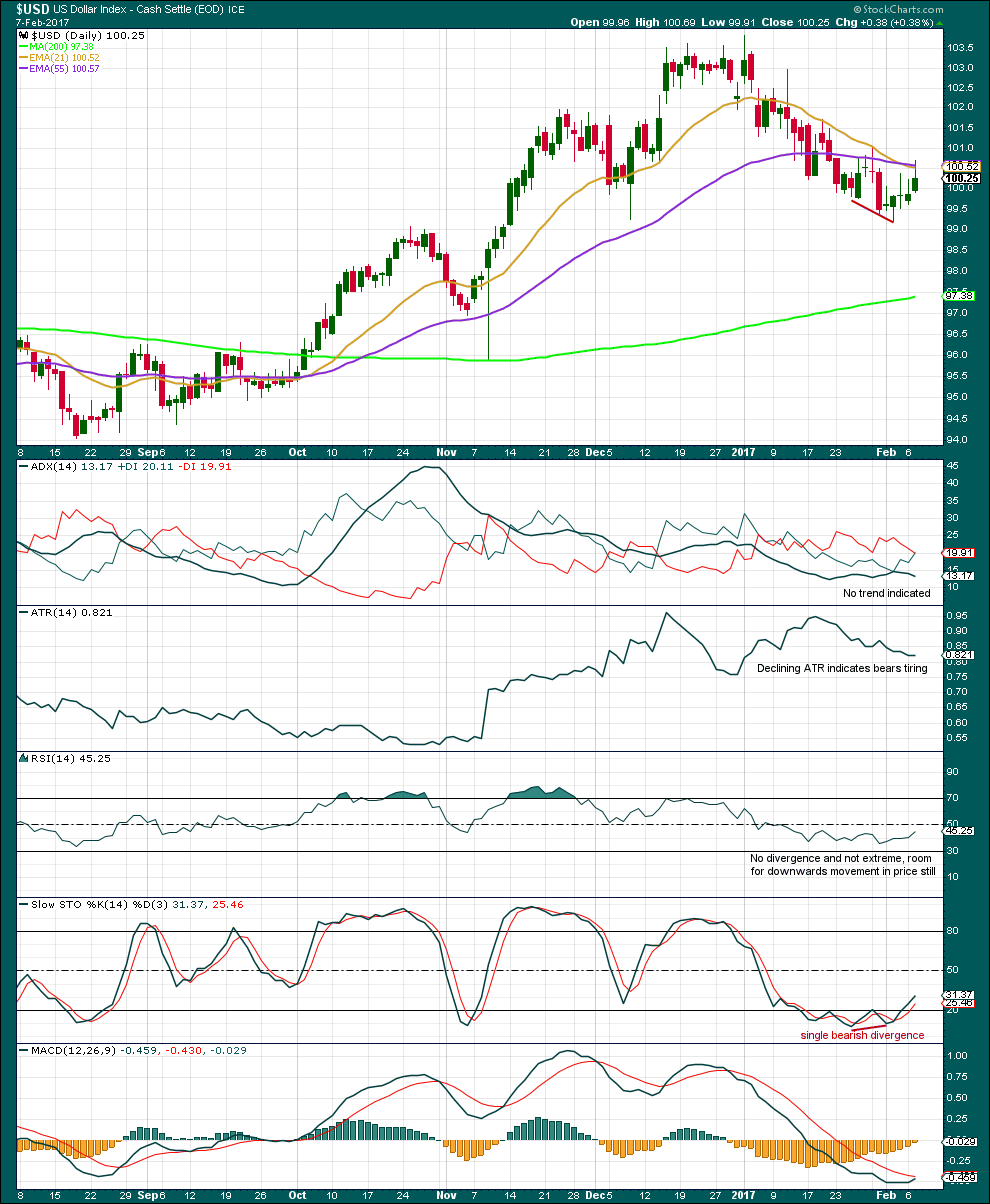
Click chart to enlarge. Chart courtesy of StockCharts.com.
Price has moved upwards since last analysis of this market.
The long term trend should be assumed to remain upwards until proven otherwise. This downwards movement should be assumed to be a pullback within a larger upwards trend.
Looking back at price behaviour in the last upwards wave from the left of this chart: price starts out slowly with choppy movement, generally trending, and it is not until the middle of the movement that Bollinger Bands widen and ATR shows a good increase. Then the trend quickly became extreme, yet price continued upwards while ADX steadily declined from about 45. So trends for this market can remain very extreme for long periods of time.
The current situation looks similar to that back in September 2016: ATR is declining as price moves up, Bollinger Bands are contracting, ADX is low and below both directional lines, and RSI is neutral. In the current day, Stochastics is also returning from oversold and exhibits single bullish divergence at last lows.
It is looking like USD index may be in the very early stages of the next wave upwards.
Unfortunately, neither BarChart nor Stockcharts provide volume data for the USD Index, so no volume analysis can be done.
ELLIOTT WAVE ANALYSIS
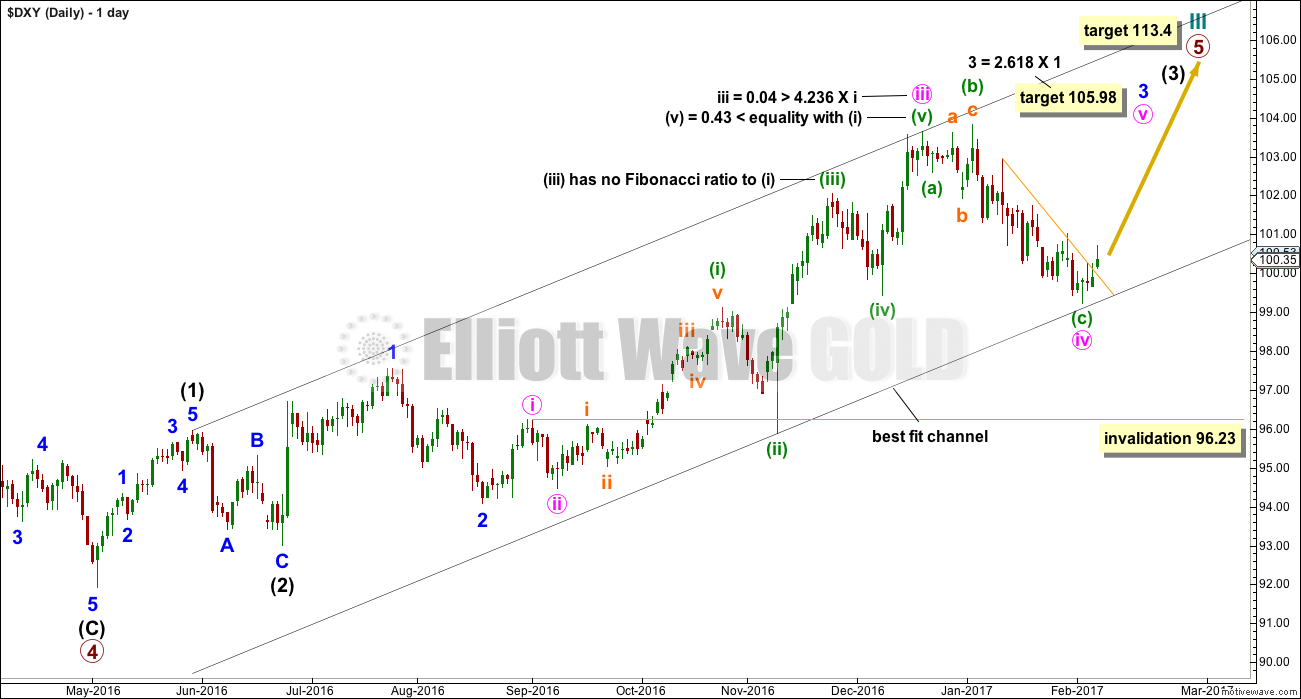
Click chart to enlarge.
The structure of intermediate wave (3) and of primary wave 5 is incomplete. Price has found support and bounced up off the best fit channel. The short term yellow resistance line is breached. It is looking increasingly likely that USD index is beginning the next wave up.
Trading advice for members only: [wlm_private “GOLD Daily YT|GOLD Daily NT|GOLD Daily NTGR|GOLD DAILY 6M NT|GOLD DAILY 6M YT|GOLD DAILY 6M NT GFR|GOLD Plus Daily YT|GOLD Plus Daily NT|OIL SILVER Weekly YT|OIL SILVER Weekly NT|GOLD Plus Daily 6M NT|GOLDPLUSDAY6M|OIL SILVER Weekly 6M NT|GOLDPLUSDAY1M|GOLDPLUSDAY1MYT|GOLDDAY6M|GOLDDAY1M|GOLDDAY1MYT|OILSILVERWEEK6M|OILSILVERWEEK1M|OILSILVERWEEK1MYT”]If entering long here, stops may be set just below the lower edge of the best fit channel, or at the last swing low at 99.23 on the 3rd of February.
Members must accept the risk of a loss. It is entirely possible that this wave count is wrong and price may continue lower. Use a stop to contain losses to no more than 1-5% of equity.[/wlm_private]
NZDUSD
TECHNICAL ANALYSIS
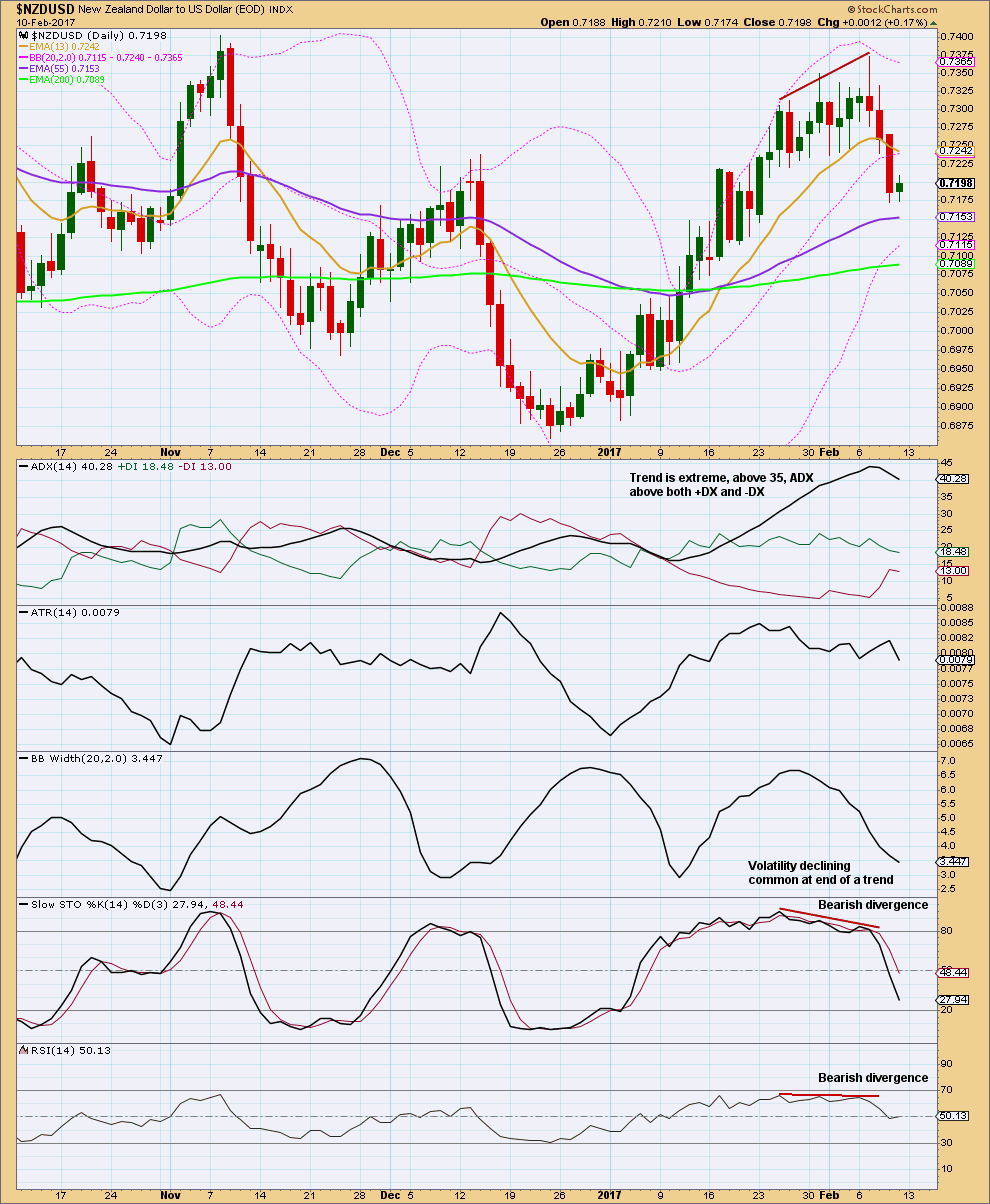
Click chart to enlarge. Chart courtesy of StockCharts.com.
Since last analysis of this pair, which was very bearish, price has fallen and closed below the short term Fibonacci 13 day moving average. The long, red daily candlesticks look bearish, and the longer upper wicks on the first two are bearish.
RSI is now neutral and Stochastics is returning from overbought. There is room for this wave down to continue.
ADX was extreme. It has a long way down to go before it would again indicate a trend.
ELLIOTT WAVE ANALYSIS + VOLUME ANALYSIS
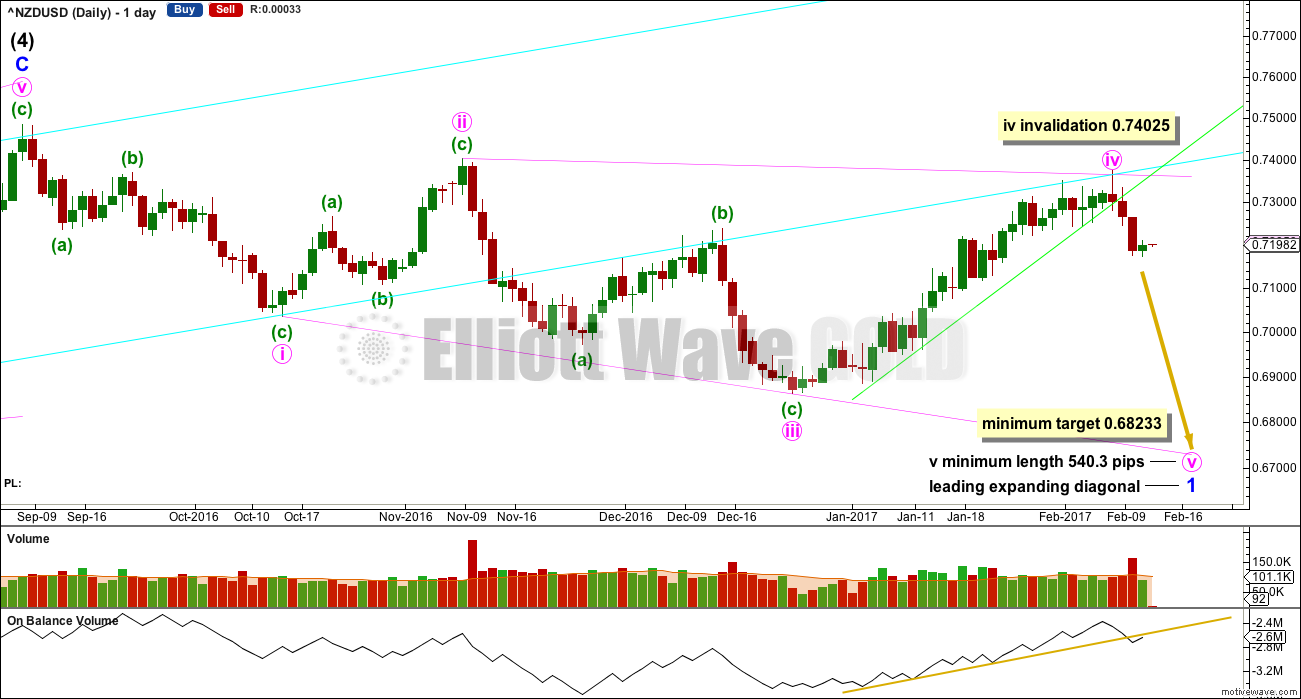
Click chart to enlarge.
The green support line has been fully breached.
The structure here is seen as a leading expanding diagonal. The fifth wave of minute wave v must be longer than minute wave iii to meet the rule regarding wave lengths for expanding diagonals. This gives the minimum target calculation.
A trend line is drawn about On Balance Volume, which has been tested at least three times before and is long held. It is now breached and OBV is coming up for a back test of resistance. If this line holds, it would be strengthened and more confidence would be had that price has turned.
The three red daily candlesticks in last week saw increasing volume. This supports downwards movement and adds confidence in a trend change here.
Trading advice for members only: [wlm_private “GOLD Daily YT|GOLD Daily NT|GOLD Daily NTGR|GOLD DAILY 6M NT|GOLD DAILY 6M YT|GOLD DAILY 6M NT GFR|GOLD Plus Daily YT|GOLD Plus Daily NT|OIL SILVER Weekly YT|OIL SILVER Weekly NT|GOLD Plus Daily 6M NT|GOLDPLUSDAY6M|OIL SILVER Weekly 6M NT|GOLDPLUSDAY1M|GOLDPLUSDAY1MYT|GOLDDAY6M|GOLDDAY1M|GOLDDAY1MYT|OILSILVERWEEK6M|OILSILVERWEEK1M|OILSILVERWEEK1MYT”]A short position was entered three days ago. This will be held until the minimum target is met or until downwards movement shows significant weakness, whichever comes first.
It looks like price today is consolidating upwards. This may be used as an opportunity to join the downwards trend.[/wlm_private]
EURUSD
TECHNICAL ANALYSIS
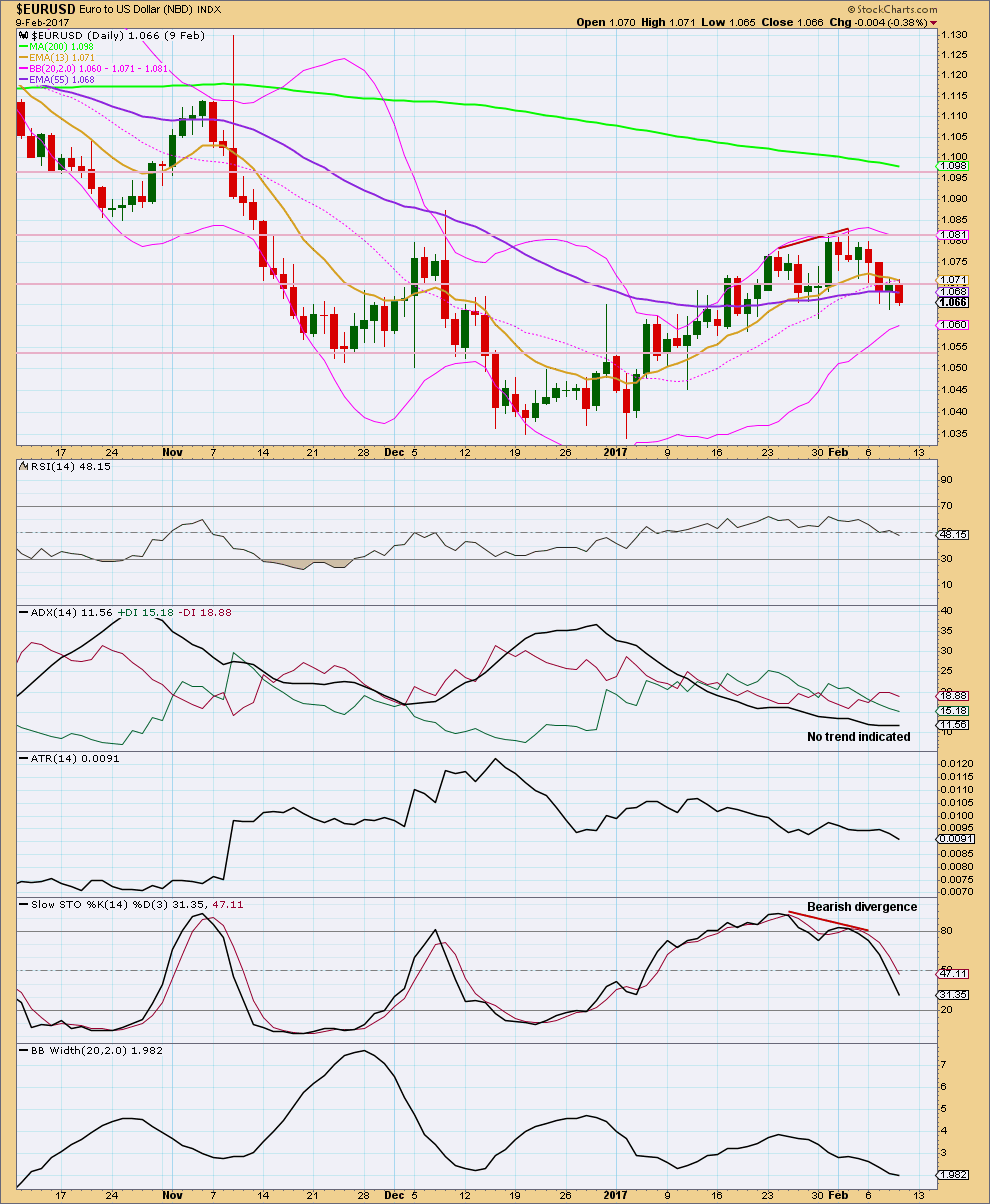
Click chart to enlarge. Chart courtesy of StockCharts.com.
Support and resistance lines are added this week. Look for support next at 1.055.
This pair is not as clearly bearish as NZDUSD, but it does look like they may be turning downwards together. Look out for Bollinger Bands to widen as volatility returns to this market.
Stochastics is returning from overbought after exhibiting divergence there. If it reaches oversold while price reaches support, then this market will be carefully analysed for any weakness in downwards movement.
ELLIOTT WAVE ANALYSIS + VOLUME ANALYSIS
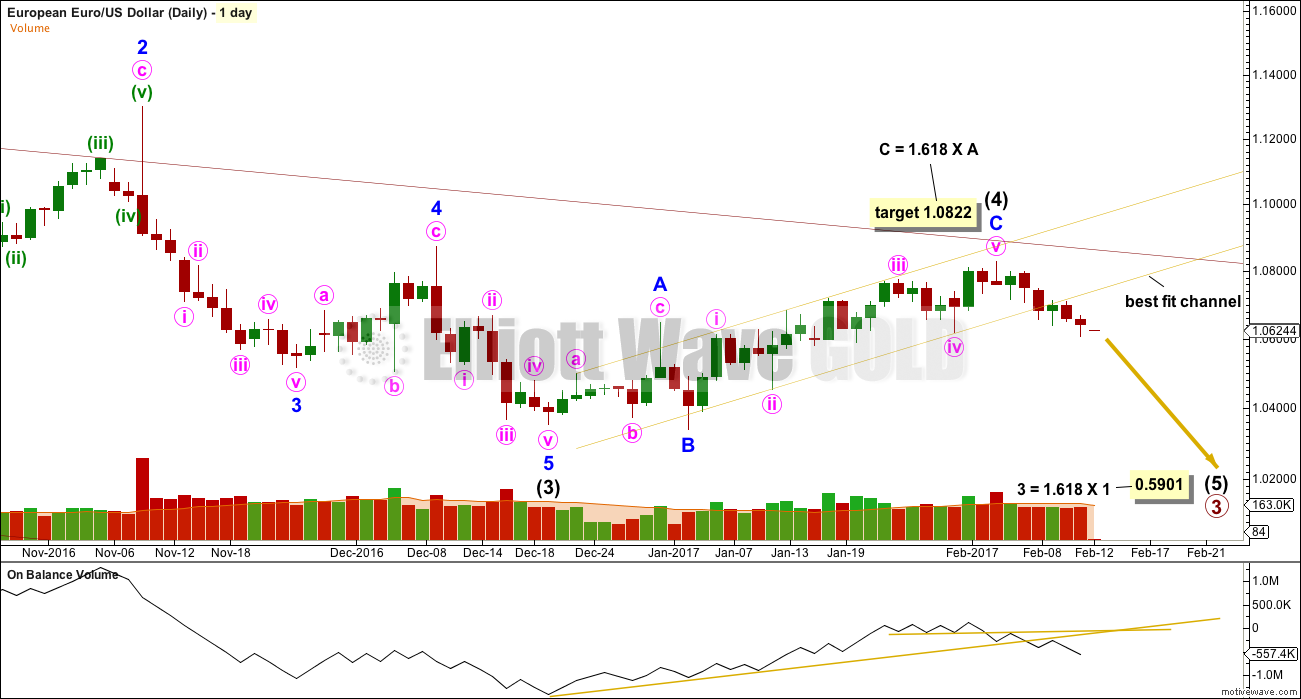
Click chart to enlarge.
On Balance Volume remains bearish. A back test of resistance for both yellow trend lines has happened and OBV has turned down from both giving bearish signals.
The best fit channel has been breached. A one day throw back occurred right after the breach, but price may still curve up and around for a longer back test of resistance. That is the risk here to short positions.
Trading advice for members only: [wlm_private “GOLD Daily YT|GOLD Daily NT|GOLD Daily NTGR|GOLD DAILY 6M NT|GOLD DAILY 6M YT|GOLD DAILY 6M NT GFR|GOLD Plus Daily YT|GOLD Plus Daily NT|OIL SILVER Weekly YT|OIL SILVER Weekly NT|GOLD Plus Daily 6M NT|GOLDPLUSDAY6M|OIL SILVER Weekly 6M NT|GOLDPLUSDAY1M|GOLDPLUSDAY1MYT|GOLDDAY6M|GOLDDAY1M|GOLDDAY1MYT|OILSILVERWEEK6M|OILSILVERWEEK1M|OILSILVERWEEK1MYT”]Use bounces as an opportunity to join a downwards trend. Accept the possibility of a loss and manage it with stops. Stops at this stage should be set just above the last high at 1.08285 (give the market room to move) on the 3rd of February. If price breaks back above the lower edge of the best fit channel, then exit short positions because something else may be happening.[/wlm_private]
US Oil
TECHNICAL ANALYSIS
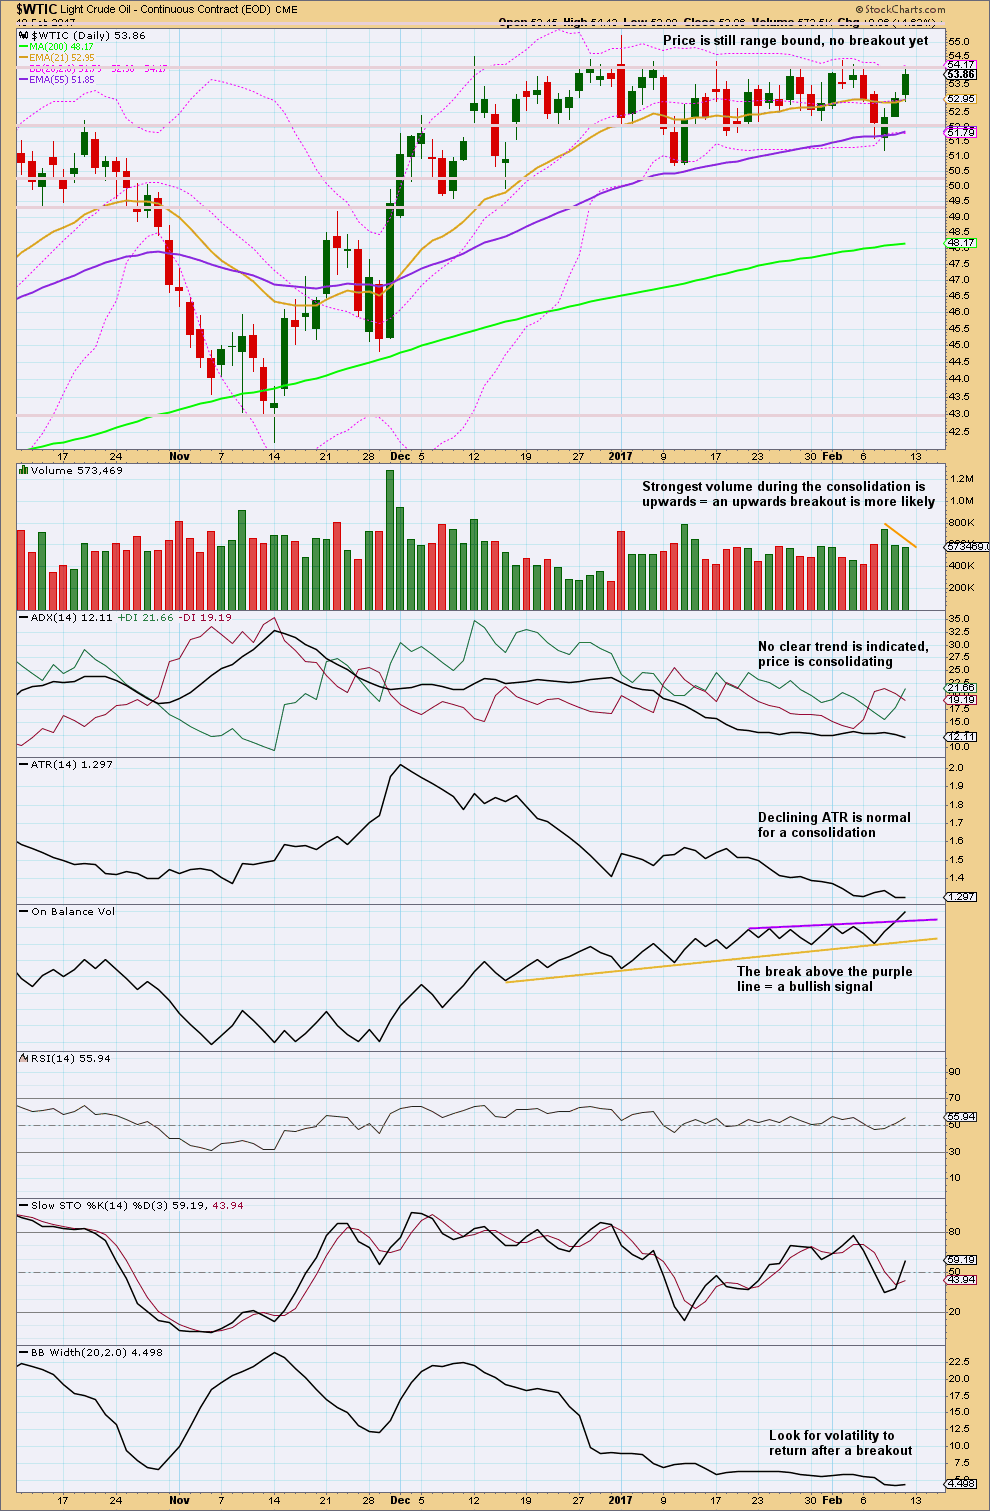
Click chart to enlarge. Chart courtesy of StockCharts.com.
US Oil entered a consolidation back in December 2016. Since then price has been fluctuating with typically choppy movement from resistance to support and back again. Resistance is about 54.15 to 54.35 and support is about 52.15 to as low as 50.70. During this long consolidation, it is now two upwards days that have strongest volume suggesting an upwards breakout is more likely than downwards.
On Balance Volume has last week given a strong bullish signal.
Prepare for an upwards breakout. This may happen this week.
A classic analysis target would expect price to travel at least the distance of the widest part of the consolidation after a breakout. That would expect a movement of about 4.53.
ELLIOTT WAVE ANALYSIS
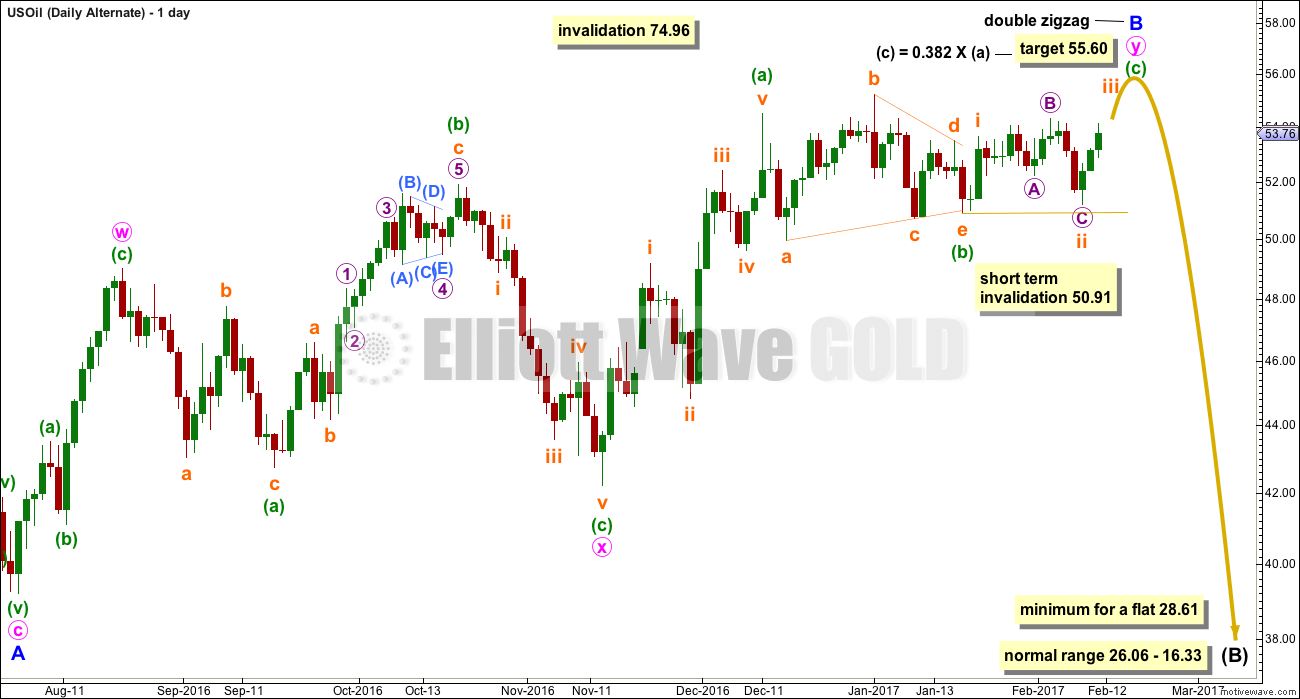
Click chart to enlarge.
The Elliott wave analysis is overall very bearish for US Oil. This is an alternate wave count that is published here because it aligns with the classic technical analysis today.
This wave count expects essentially that any upwards breakout may be false and short lived.
Trading advice for members only: [wlm_private “GOLD Daily YT|GOLD Daily NT|GOLD Daily NTGR|GOLD DAILY 6M NT|GOLD DAILY 6M YT|GOLD DAILY 6M NT GFR|GOLD Plus Daily YT|GOLD Plus Daily NT|OIL SILVER Weekly YT|OIL SILVER Weekly NT|GOLD Plus Daily 6M NT|GOLDPLUSDAY6M|OIL SILVER Weekly 6M NT|GOLDPLUSDAY1M|GOLDPLUSDAY1MYT|GOLDDAY6M|GOLDDAY1M|GOLDDAY1MYT|OILSILVERWEEK6M|OILSILVERWEEK1M|OILSILVERWEEK1MYT”]It is entirely possible that this wave count could be wrong. If entering long before or after a breakout, then move stops up to break even if the position becomes profitable, and then up to above prior resistance as soon as possible. Be prepared to take profits quickly after an upwards breakout.
Alternatively, hold onto long positions with a trailing stop to maximise profits if an upwards trend continues.[/wlm_private]
DISCLAIMER
As always, it is essential that anyone using this analysis for trading advice manages risk carefully. Follow my two Golden Rules:
1. Always use a stop.
2. Never invest more than 1-5% of equity on any one trade.
Trading is about probabilities, not certainties. Failure to follow my two Golden Rules of trading indicates failure to manage risk.
Accept that this analysis may be wrong. It is impossible for any analyst to predict with certainty what a market will do next.
This analysis is published @ 06:27 p.m. EST on 12th February, 2017.
Kimble on Oil
https://www.kimblechartingsolutions.com/2017/02/crude-oil-dangerous-price-point-bulls-says-joe-friday/
Lara, have you ever thought of including Oil Volitility with your oil analysis? I’ve seen that you use Vix as part of your SPX analysis. $OVX on StockCharts.
Thanks so much for the chart Dreamer, yes, I should do that shouldn’t I.
I will add that to the Oil analysis from now on. Thanks for the pointer!
USD/JPY has an excellent inverse correlation to gold. The bullish USD/JPY analysis doesn’t bode well for upward gold progress. Hopefully the USD/JPY will migrate toward the invalidation point of 103.29 first to allow for upward progress of the precious metal.
Except I’m expecting Gold to go down for some time….
This fits neatly with my Gold analysis.