
Today’s Trading Room looks at Natural Gas and USDJPY.
To learn what the Trading Room is about see first Trading Room analysis here.
Trading Room will focus on classic technical analysis. Elliott wave analysis will be for support and for targets / invalidation points.
Natural Gas – NGAS
TECHNICAL ANALYSIS
Click chart to enlarge. Chart courtesy of StockCharts.com.
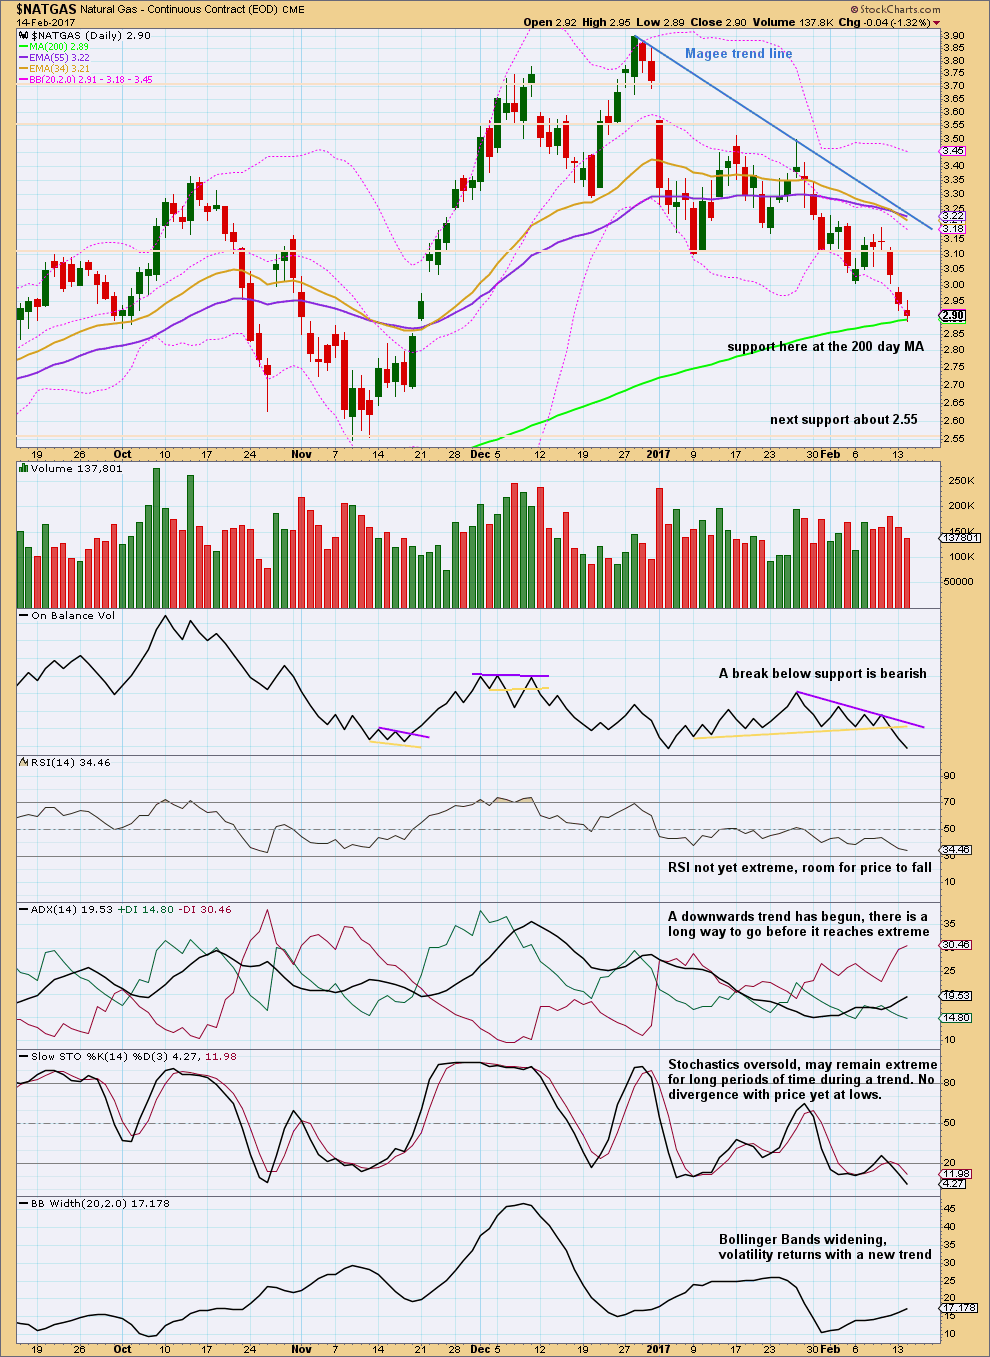
In the mid term, there is a new downwards trend for Gas. Use the Magee trend line for resistance.
In the short term, price may bounce up here from the 200 day moving average. The slight decline in volume for the last two days, along with small range days, looks like bears are temporarily exhausted. Expect a bounce as fairly likely.
This chart looks very bearish.
Trading advice for members only: [wlm_private “GOLD Daily YT|GOLD Daily NT|GOLD Daily NTGR|GOLD DAILY 6M NT|GOLD DAILY 6M YT|GOLD DAILY 6M NT GFR|GOLD Plus Daily YT|GOLD Plus Daily NT|OIL SILVER Weekly YT|OIL SILVER Weekly NT|GOLD Plus Daily 6M NT|GOLDPLUSDAY6M|OIL SILVER Weekly 6M NT|GOLDPLUSDAY1M|GOLDPLUSDAY1MYT|GOLDDAY6M|GOLDDAY1M|GOLDDAY1MYT|OILSILVERWEEK6M|OILSILVERWEEK1M|OILSILVERWEEK1MYT”]If price touches the Magee trend line again, then enter short with a stop just above the line. Give the market room to move to allow for overshoots. If entering short prior to another touch of the line, then set stops just above the line and allow for an underwater position for a few days. Patience in waiting for a better set up here may be well rewarded. This chart will be updated if the set up shows itself.[/wlm_private]
ELLIOTT WAVE ANALYSIS
WEEKLY CHART
Click chart to enlarge.
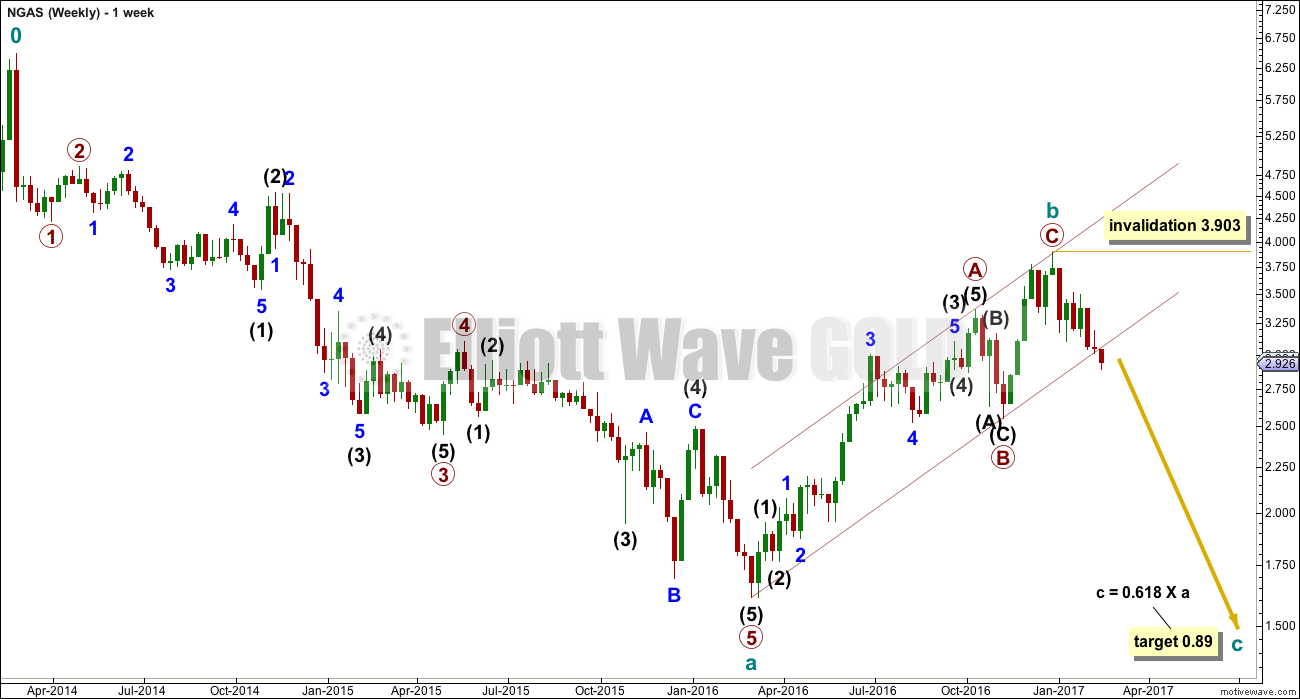
The trend channel about cycle wave b has been breached now at the weekly and daily chart level. This may offer some confidence in a trend change.
DAILY CHART
Click chart to enlarge.
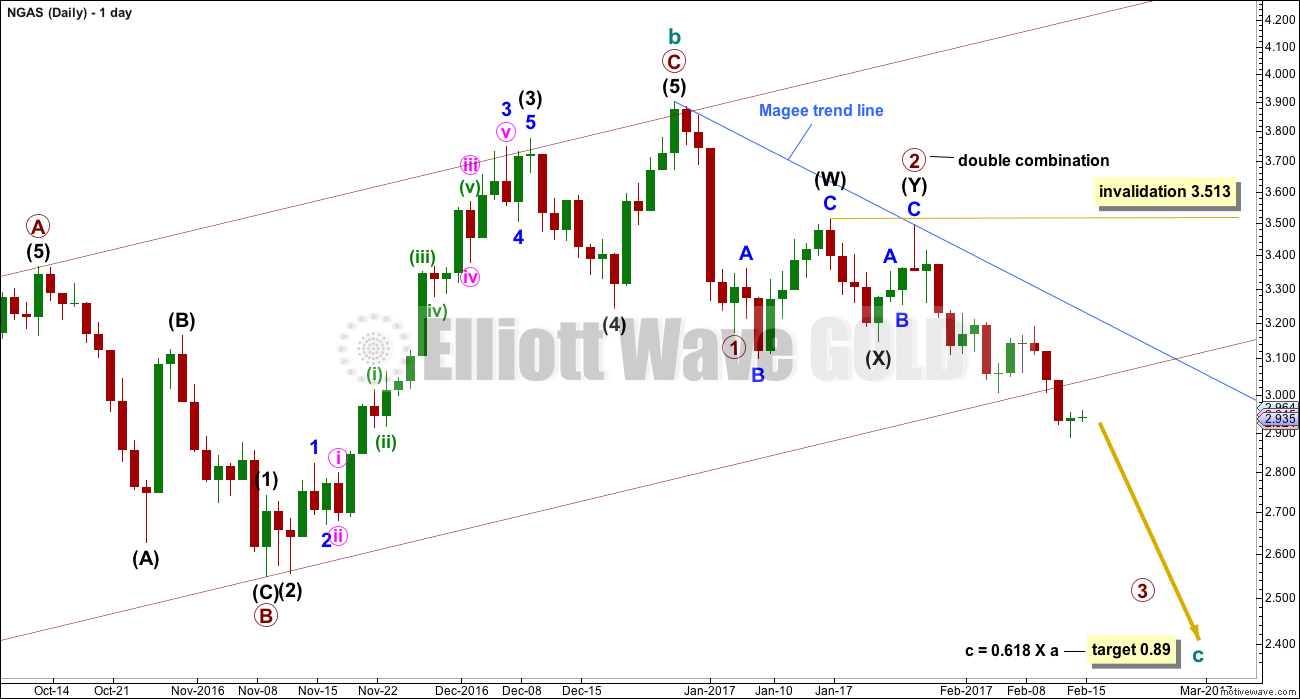
Cycle wave b may be complete. A cycle wave c down may be in the early stages. This wave should last one to several years if the wave count is correct. The lower edge of the channel about cycle wave b is now breached by two daily candlesticks.
Look for bounces to find resistance at the Magee trend line.
I do have an alternate wave count, but it too is bearish at this time. Publication of it would add nothing to the analysis. If any member wants it, then please email me and I’ll send it to you.
USDJPY
TECHNICAL ANALYSIS
Click chart to enlarge. Chart courtesy of StockCharts.com.
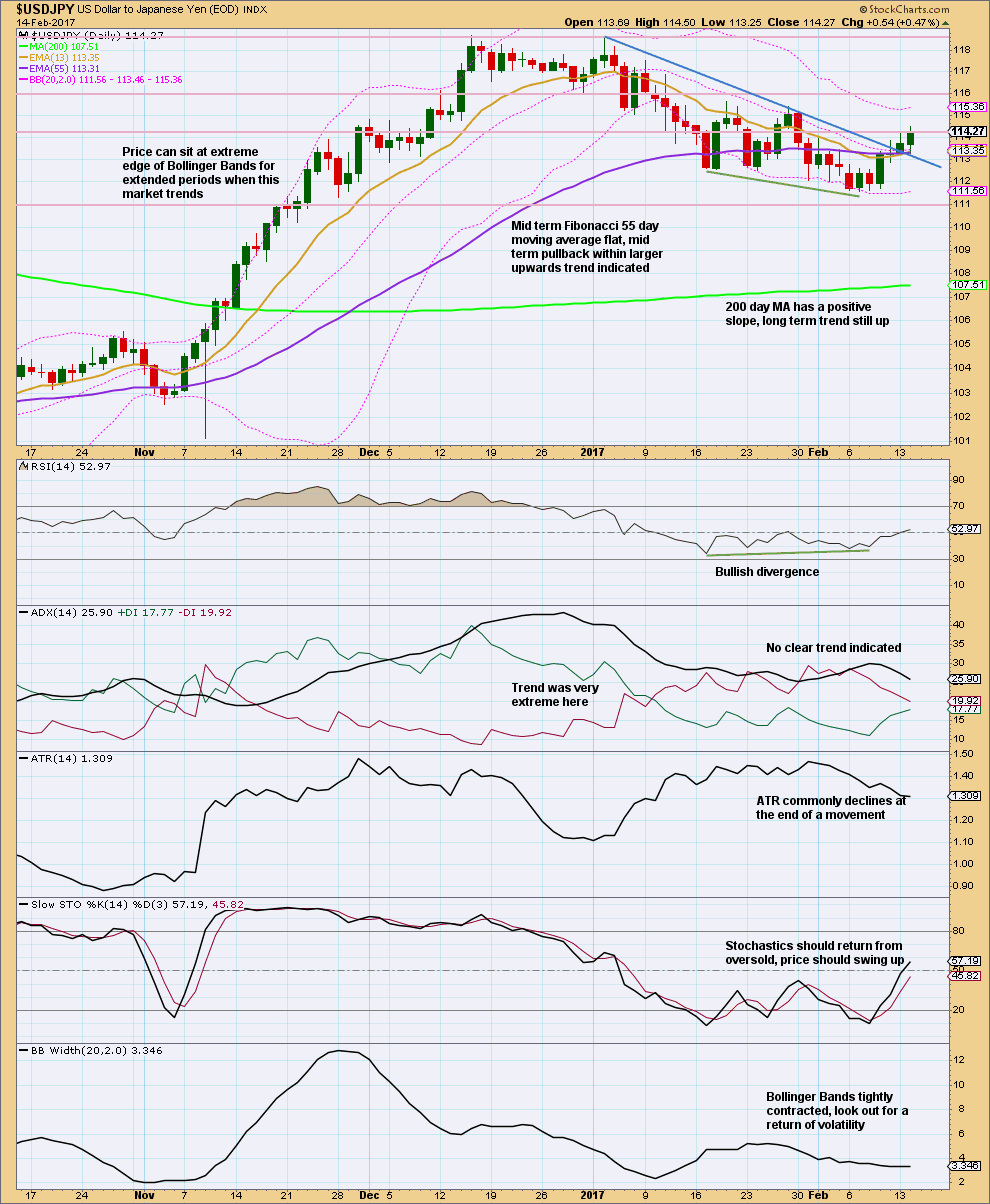
Price has moved upwards, as expected, since last publication of analysis of this pair. There is now a full daily candlestick above the blue line, which previously provided resistance and may now provide support.
Trading advice for members only: [wlm_private “GOLD Daily YT|GOLD Daily NT|GOLD Daily NTGR|GOLD DAILY 6M NT|GOLD DAILY 6M YT|GOLD DAILY 6M NT GFR|GOLD Plus Daily YT|GOLD Plus Daily NT|OIL SILVER Weekly YT|OIL SILVER Weekly NT|GOLD Plus Daily 6M NT|GOLDPLUSDAY6M|OIL SILVER Weekly 6M NT|GOLDPLUSDAY1M|GOLDPLUSDAY1MYT|GOLDDAY6M|GOLDDAY1M|GOLDDAY1MYT|OILSILVERWEEK6M|OILSILVERWEEK1M|OILSILVERWEEK1MYT”]If a long position is entered here, then stops may be set either just below the blue trend line or just below the last swing low. If using the trend line, then allow for overshoots to give the market room to move.[/wlm_private]
ELLIOTT WAVE ANALYSIS
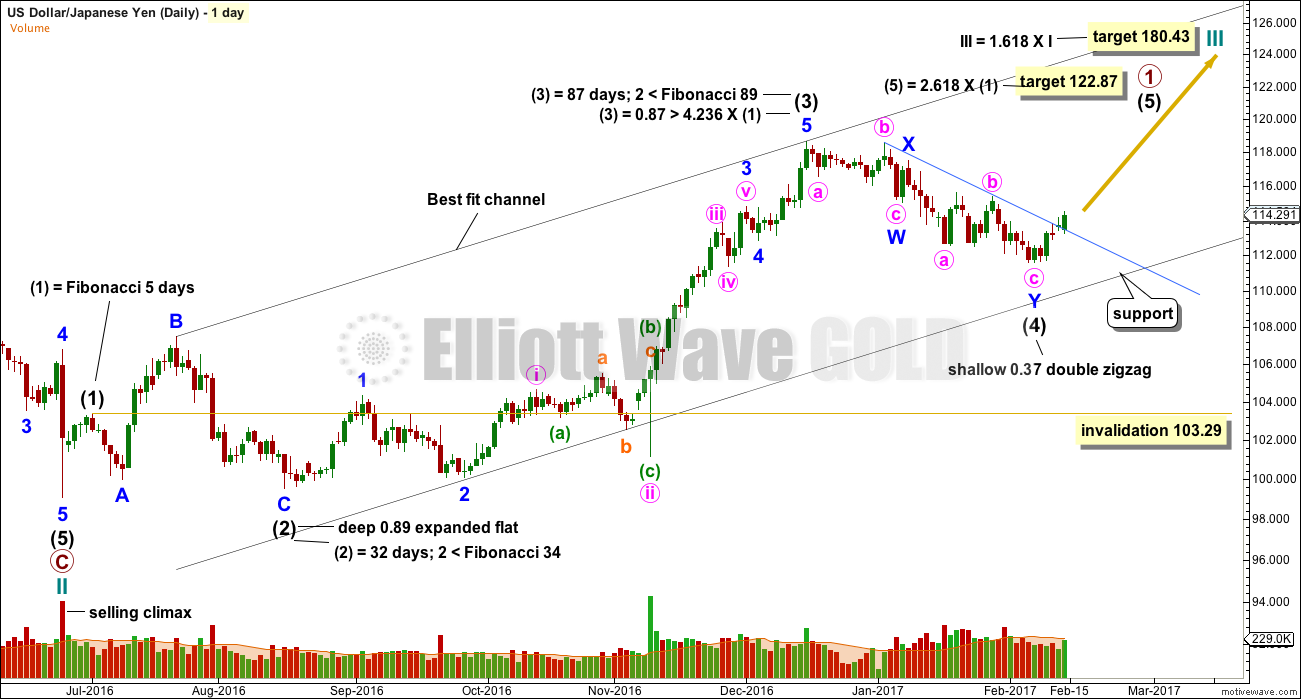
Click chart to enlarge.
This market is behaving as expected so far. Elliott wave targets may be used as profit targets.
DISCLAIMER
As always, it is essential that anyone using this analysis for trading advice manages risk carefully. Follow my two Golden Rules:
1. Always use a stop.
2. Never invest more than 1-5% of equity on any one trade.
Trading is about probabilities, not certainties. Failure to follow my two Golden Rules of trading indicates failure to manage risk.
Accept that this analysis may be wrong. It is impossible for any analyst to predict with certainty what a market will do next.
This analysis is published @ 12:35 a.m. EST.
Lara, this market may not have huge volume, but it may be at a major turning point. Big bullish engulfing candle today. Looking at the last several years, the yearly low comes early in the year.
Got chocolate?
The basic concept of Trading Room is for us all to make more $$.
And so please, if members would like me to take a look at a market that you think may offer an opportunity let me know here in comments.
I will do an Elliott wave count for markets with sufficient volume; indices, commodities and currencies. Individual equities do not offer sufficient volume for Elliott wave analysis of any reliability, but I will apply solid technical analysis to them 🙂
Hi Lara, Is it possible you could have a quick look at ‘Copper’, Although i am not sure if there is enough volume for good analysis. Thx
Certainly. There should be enough volume, it’s a global market.