
Price is still range bound. On Balance Volume is giving a strong signal about what direction price will break out.
Summary: A new high above 55.24 would indicate an upwards breakout, and the target would be 58.81. A new low below 51.22 would indicate a downwards breakout, and the target would be 28.61, minimum, with a next target possibly at 25.59.
New updates to this analysis are in bold.
MONTHLY ELLIOTT WAVE COUNT
Click chart to enlarge.
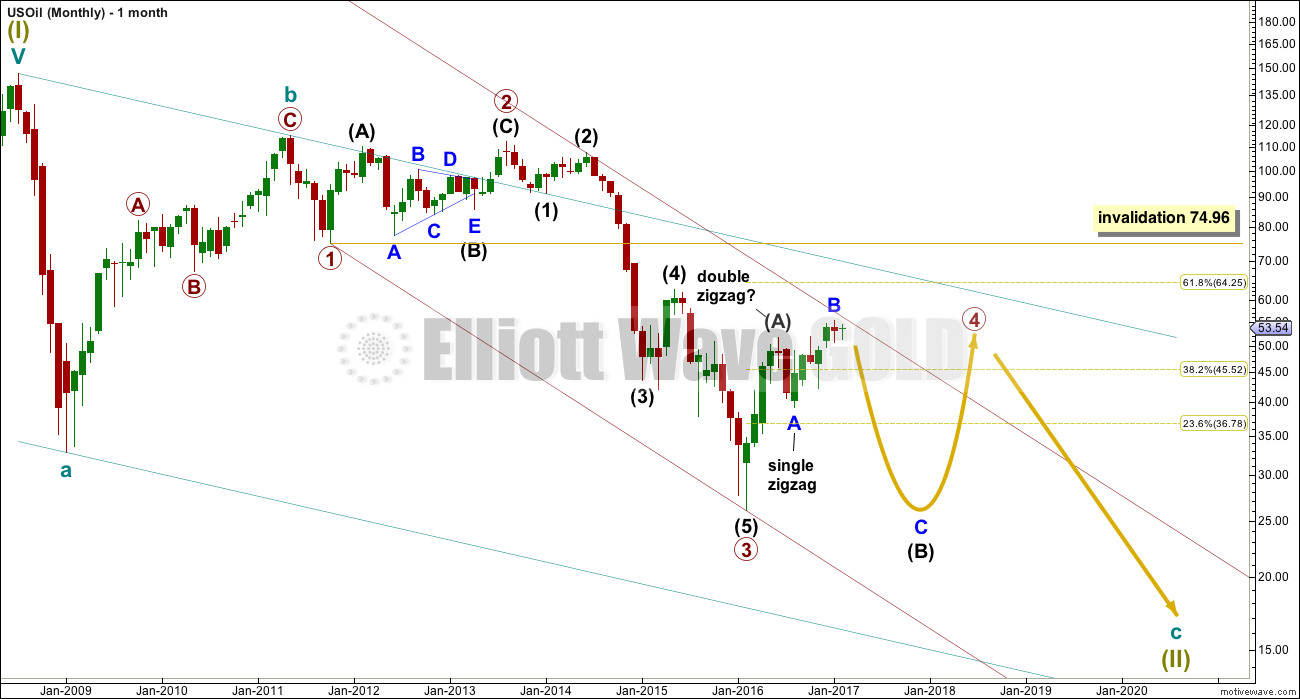
Within the bear market, cycle wave b is seen as ending in May 2011. Thereafter, a five wave structure downwards for cycle wave c begins.
Within cycle wave c, at this stage it does not look like primary wave 5 could be complete. That would only be possible if primary wave 4 was over too quickly.
Primary wave 1 is a short impulse lasting five months. Primary wave 2 is a very deep 0.94 zigzag lasting 22 months. Primary wave 3 is a complete impulse with no Fibonacci ratio to primary wave 1. It lasted 30 months.
Primary wave 4 is likely to exhibit alternation with primary wave 2. Primary wave 4 is most likely to be a flat, combination or triangle. Within all of these types of structures, the first movement subdivides as a three. The least likely structure for primary wave 4 is a zigzag.
Primary wave 4 is likely to end within the price territory of the fourth wave of one lesser degree; intermediate wave (4) has its range from 42.03 to 62.58.
It no longer looks like primary wave 4 can be contained within the channel, so it may overshoot the upper edge.
Primary wave 4 is most likely to be shallow to exhibit alternation in depth with primary wave 2. So far it has passed the 0.382 Fibonacci ratio at 45.52. It may now continue to move mostly sideways in a large range.
Primary wave 4 may not move into primary wave 1 price territory above 74.96.
At this stage, primary wave 4 has completed intermediate wave (A) only. Intermediate wave (B) is incomplete.
WEEKLY ELLIOTT WAVE COUNT
Click chart to enlarge.
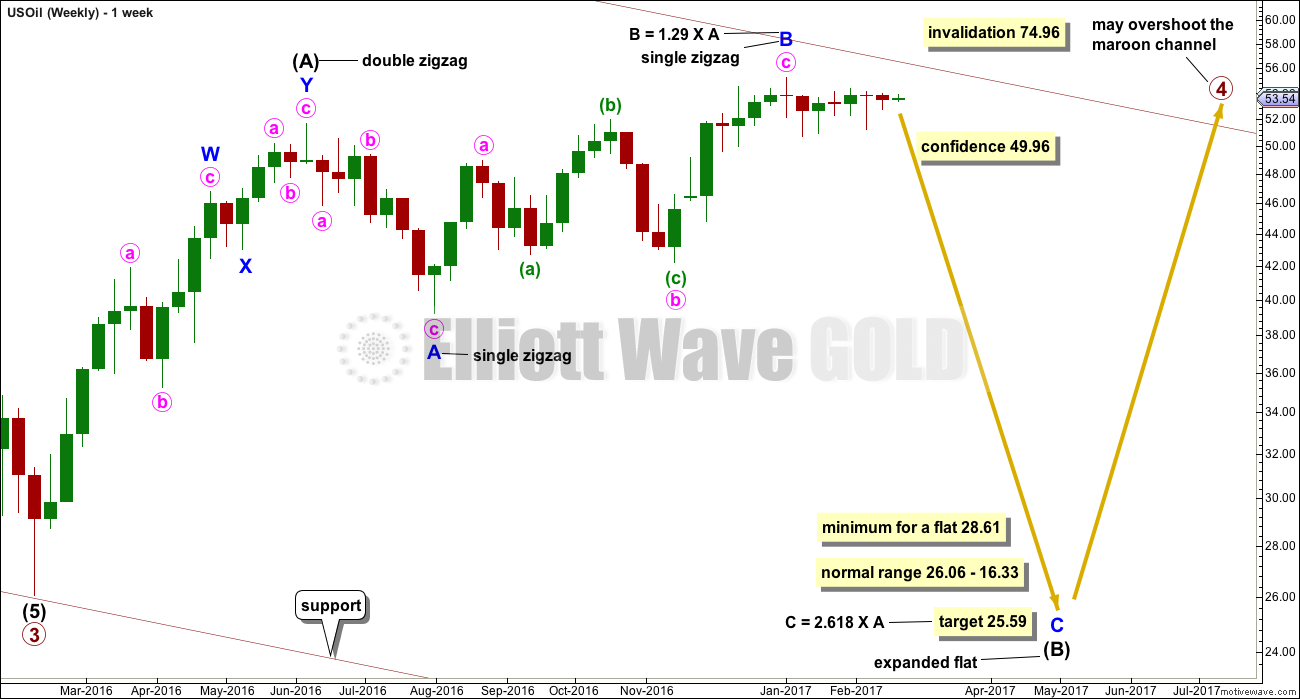
The whole structure of primary wave 4 is seen here in more detail.
The first wave labelled intermediate wave (A) is seen as a double zigzag, which is classified as a three.
Intermediate wave (B) is also a three. This means primary wave 4 is most likely unfolding as a flat correction if my analysis of intermediate wave (A) is correct. Flats are very common structures.
Intermediate wave (B) began with a zigzag downwards. This indicates it too is unfolding most likely as a flat correction.
Within intermediate wave (B), the zigzag upwards for minor wave B is a 1.29 correction of minor wave A. This indicates intermediate wave (B) may be unfolding as an expanded flat, the most common type.
The normal range for intermediate wave (B) within a flat correction for primary wave 4 is from 1 to 1.38 the length of intermediate wave (A) giving a range from 26.06 to 16.33.
Primary wave 4 may not move into primary wave 1 price territory above 74.96.
Within the larger expanded flat correction of primary wave 4, intermediate wave (B) must retrace a minimum 0.9 length of intermediate wave (A) at 28.61 or below.
DAILY ELLIOTT WAVE COUNT
Click chart to enlarge.
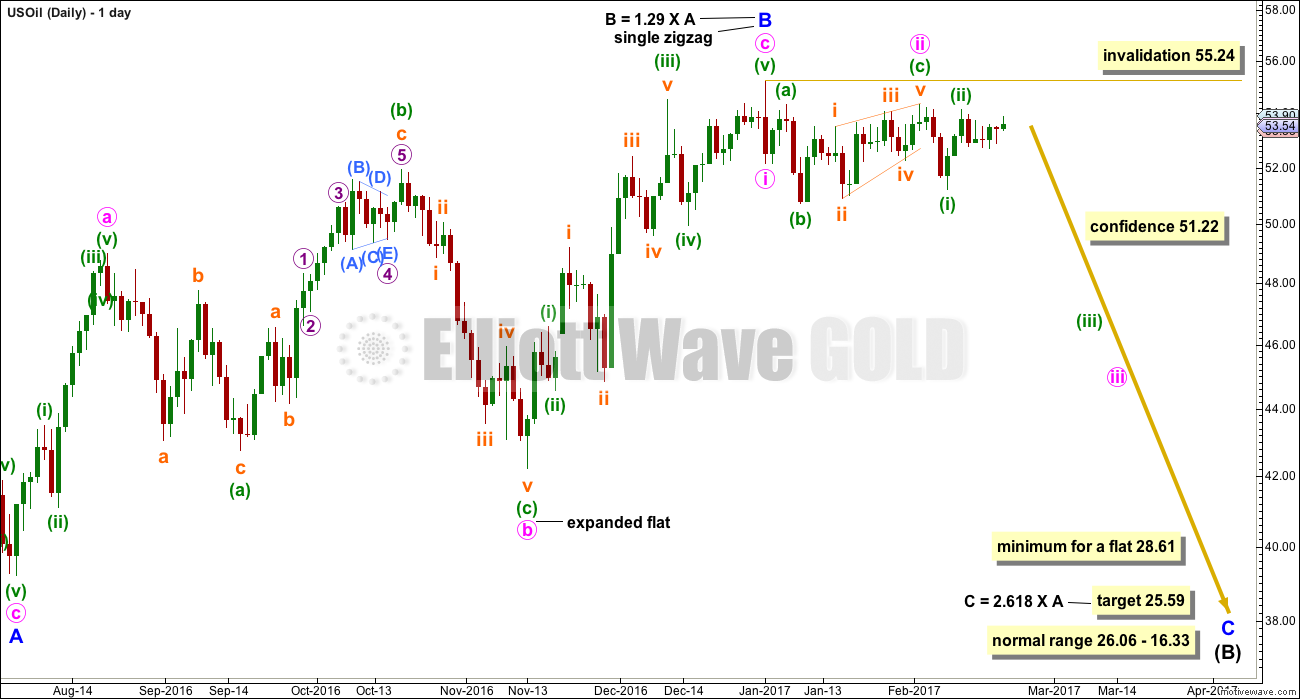
Minor wave B is seen in this main wave count as a complete single zigzag. The upwards wave labelled minute wave a is seen as a five wave impulse.
Minor wave C downwards should have begun. Within minor wave C, minute wave ii may not move beyond the start of minute wave i above 55.24.
Minor wave C downwards must subdivide as a five wave structure.
Minute wave ii may now be a complete expanded flat correction. Minuette wave (c) is labelled as an ending contracting diagonal, the classic pattern equivalent is a rising wedge. These are terminal structures. The fifth wave ends at the i-iii trend line and there is no overshoot. An overshoot would have a better look, but it is not necessary as it is not a rule.
A new low below 51.22 would invalidate the alternate wave count below and provide some confidence in this main wave count.
ALTERNATE DAILY ELLIOTT WAVE COUNT
Click chart to enlarge.
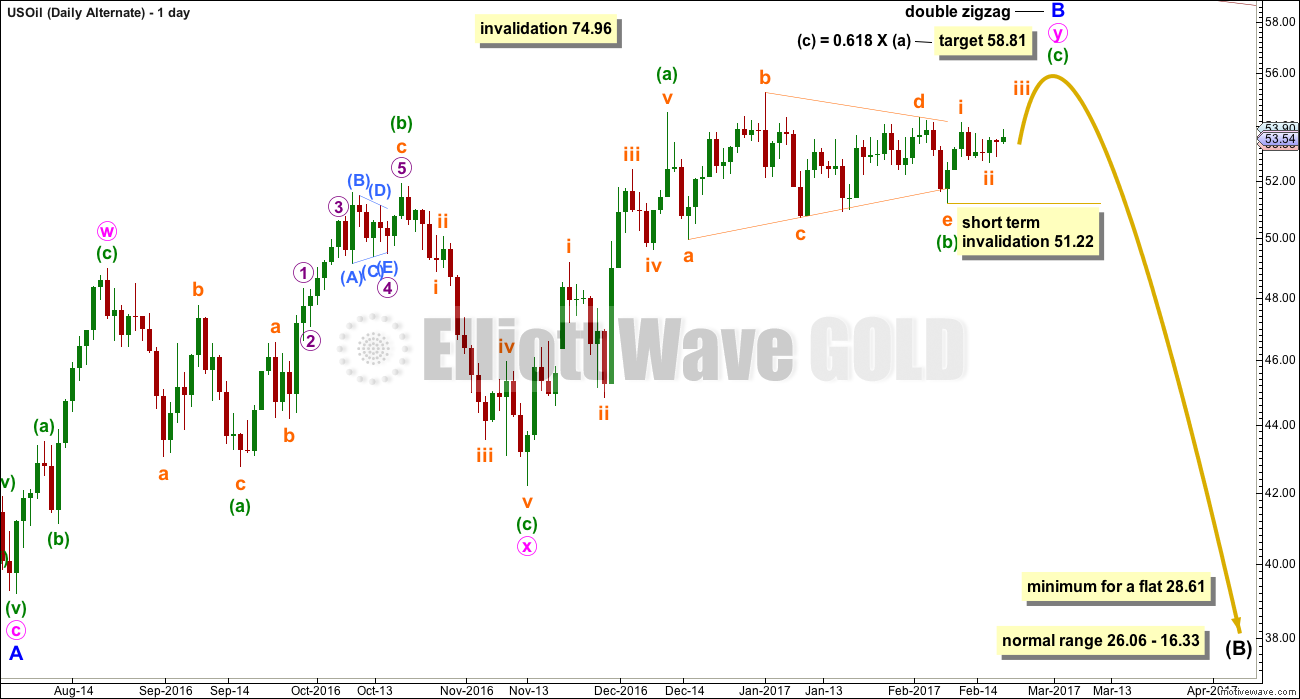
Minor wave B is seen as an incomplete double zigzag. The first wave up labelled minute wave w is seen as a zigzag. This is the main difference between the two wave counts.
Minute wave y must subdivide as a zigzag. Sideways movement over the last few weeks may be a triangle within it for minuette wave (b).
Minuette wave (c) would be very likely to make at least a slight new high above the end of minuette wave (a) at 54.50 to avoid a truncation.
The normal range for minor wave B within the larger flat correction of intermediate wave (B) is from 1 to 1.38 the length of minor wave A, giving a range from 51.67 to 56.41. With the classic technical analysis chart looking fairly bullish, a higher target is calculated. If minuette wave (c) has a more common Fibonacci ratio with minuette wave (a), then minor wave B may be a little longer than the common length.
In the short term, within minuette wave (c), the correction for subminuette wave ii may not move beyond the start of subminuette wave i below 51.22.
TECHNICAL ANALYSIS
DAILY CHART
Click chart to enlarge. Chart courtesy of StockCharts.com.
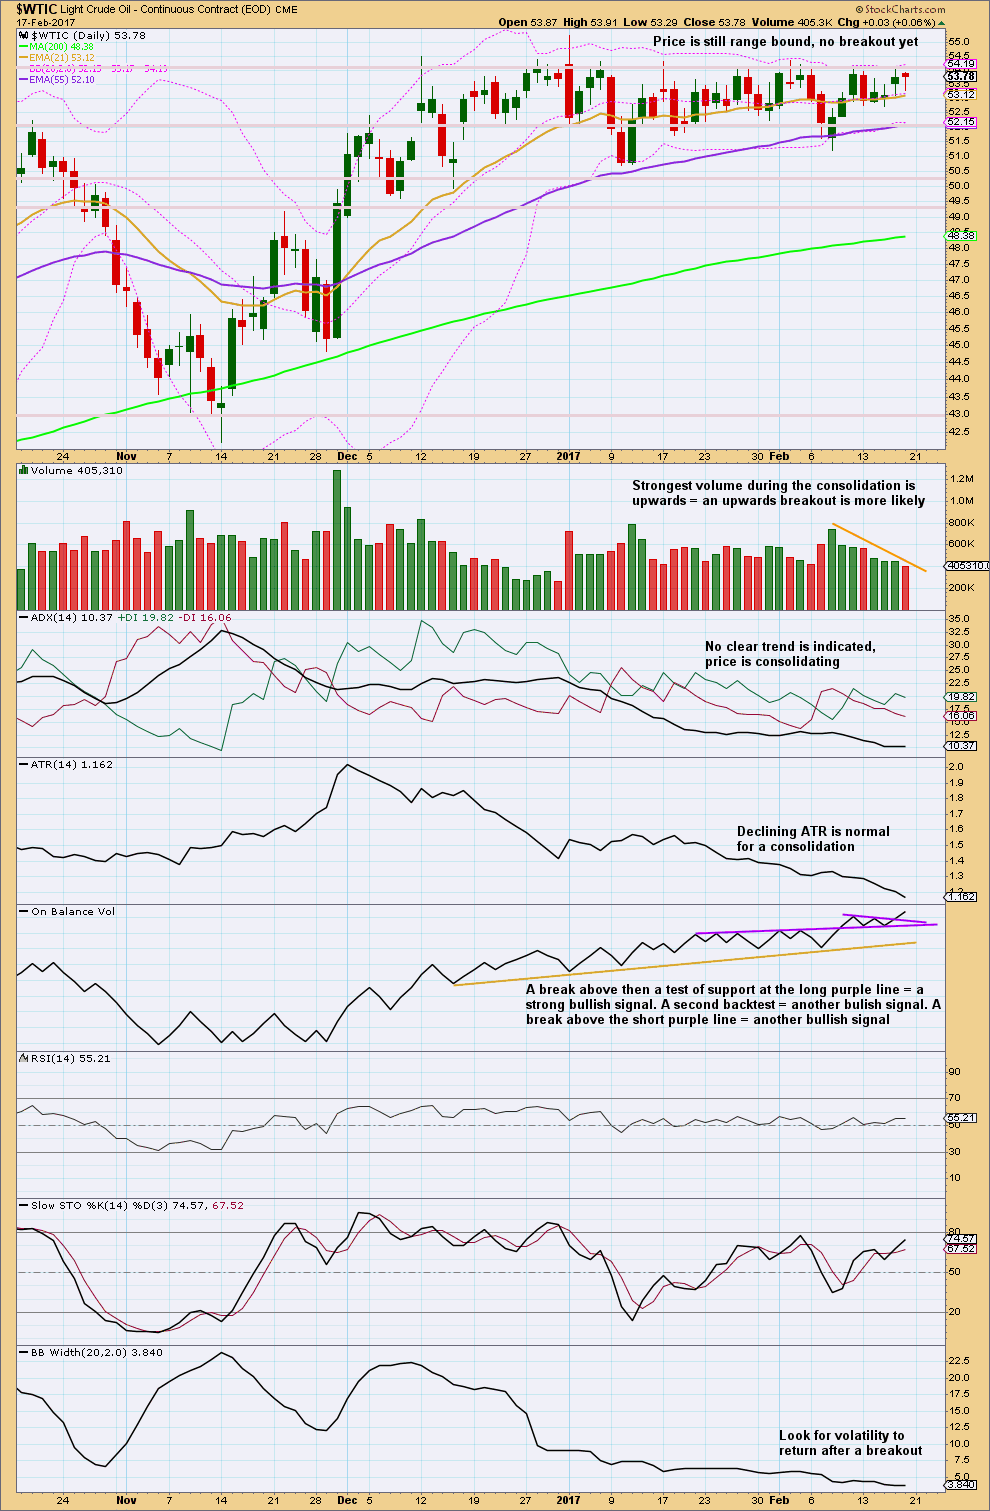
Oil is still range bound with resistance about 54.15 to 55.20 and support about 52 to 50.70. A breakout has not yet occurred.
On Balance Volume is very bullish this week. This strongly supports the alternate daily Elliott wave count.
A breakout should see price close above resistance or below support. An upwards breakout should have support from volume for confidence. A downwards breakout does not necessarily require strong volume but if seen that does increase confidence.
After a breakout, look for price to then turn and test prior resistance or support. If price behaves like that, it would offer an entry to join a trend after the breakout.
At any one time markets will be doing one of two things: trending or consolidating. Trending markets are relatively easy to profit from; simply join the trend and hold on until it is confirmed as over. Consolidating markets are very difficult to profit from and should be strictly avoided by all but the most experienced of traders.
VOLATILITY INDEX
Click chart to enlarge. Chart courtesy of StockCharts.com.
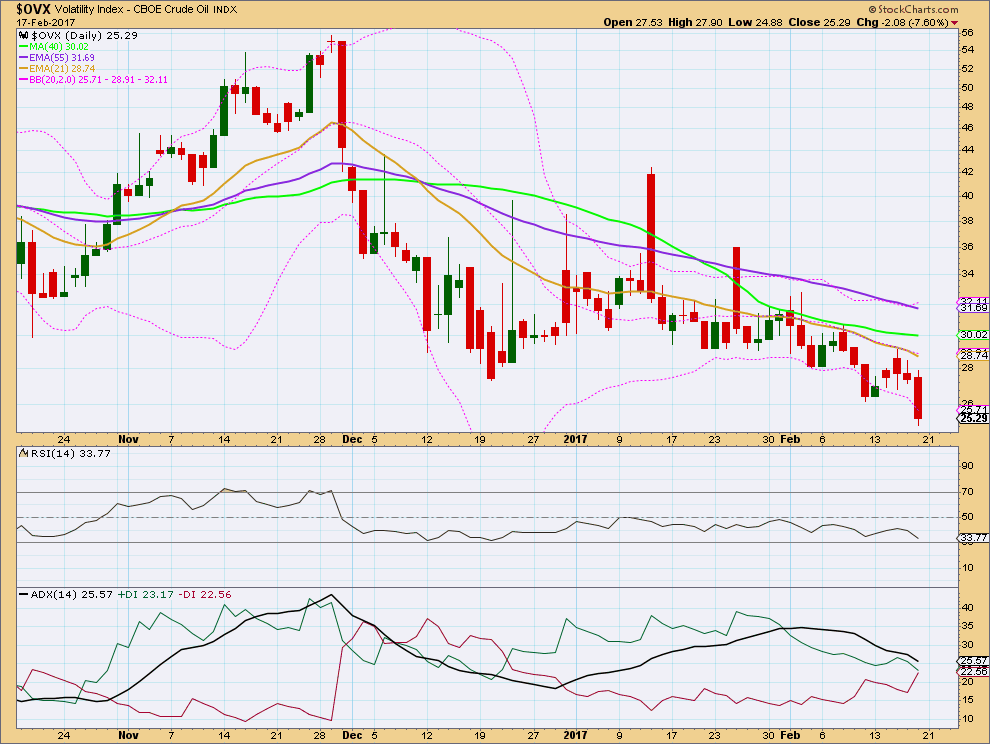
Normally, volatility should decline as price rises and volatility should increase as price falls. Divergence from this normal can provide a bullish or bearish signal for Oil.
Price is moving sideways and volatility is declining. This is also reasonably normal for a consolidation.
On the 17th of February price completed an inside day, more sideways movement. Volatility sharply declined. Normally, a sharp decline in volatility would be accompanied by a rise in price, but that did not happen for the 17th. The conclusion still is that there is something wrong with price and this is interpreted as bearish.
This analysis is published @ 06:33 p.m. EST.